Stronger Dollar and Sterling Swings Add Volatility to United Kingdom Ishares MSCI ETF (EWU)
United Kingdom Ishares MSCI ETF is nearing a spring stretch that has delivered steady gains over the past decade, giving investors a clear seasonal backdrop as they reassess U.K. equity risk in a shifting global environment.

Key takeaways
- United Kingdom Ishares MSCI ETF enters a 51-day seasonal window starting Mar 13 that has historically been favorable for long positions.
- Across the past 10 years, this window was profitable in 100% of cases, with 10 winners and 0 losers.
- Average profit in those winning years was 3.62%, with a cumulative gain of 42% over the sample.
- The TradeWave Ratio of 2.46 indicates that price has typically traveled meaningfully in the trade direction within the window.
- Intraperiod swings have been material, with some years showing deep drawdowns before finishing higher, underscoring the importance of managing volatility.
- The pattern has tended to build gains gradually across the window rather than relying on a single sharp move.
According to historical data from TradeWave.ai, this upcoming stretch for United Kingdom Ishares MSCI ETF has shown a distinct seasonal tendency in prior years. The next section looks at how that pattern has behaved and what it may signal about the backdrop for U.K. equity exposure this spring.
Seasonal window
This seasonal window begins on Mar 13, 2026 and spans 51 trading days. Historically, during this period, United Kingdom Ishares MSCI ETF has shown a consistently strong tendency in the long direction, with every year in the past decade finishing the window in positive territory. That track record gives investors a clear quantitative backdrop as they weigh how to position U.K.-focused equity exposure into the spring.
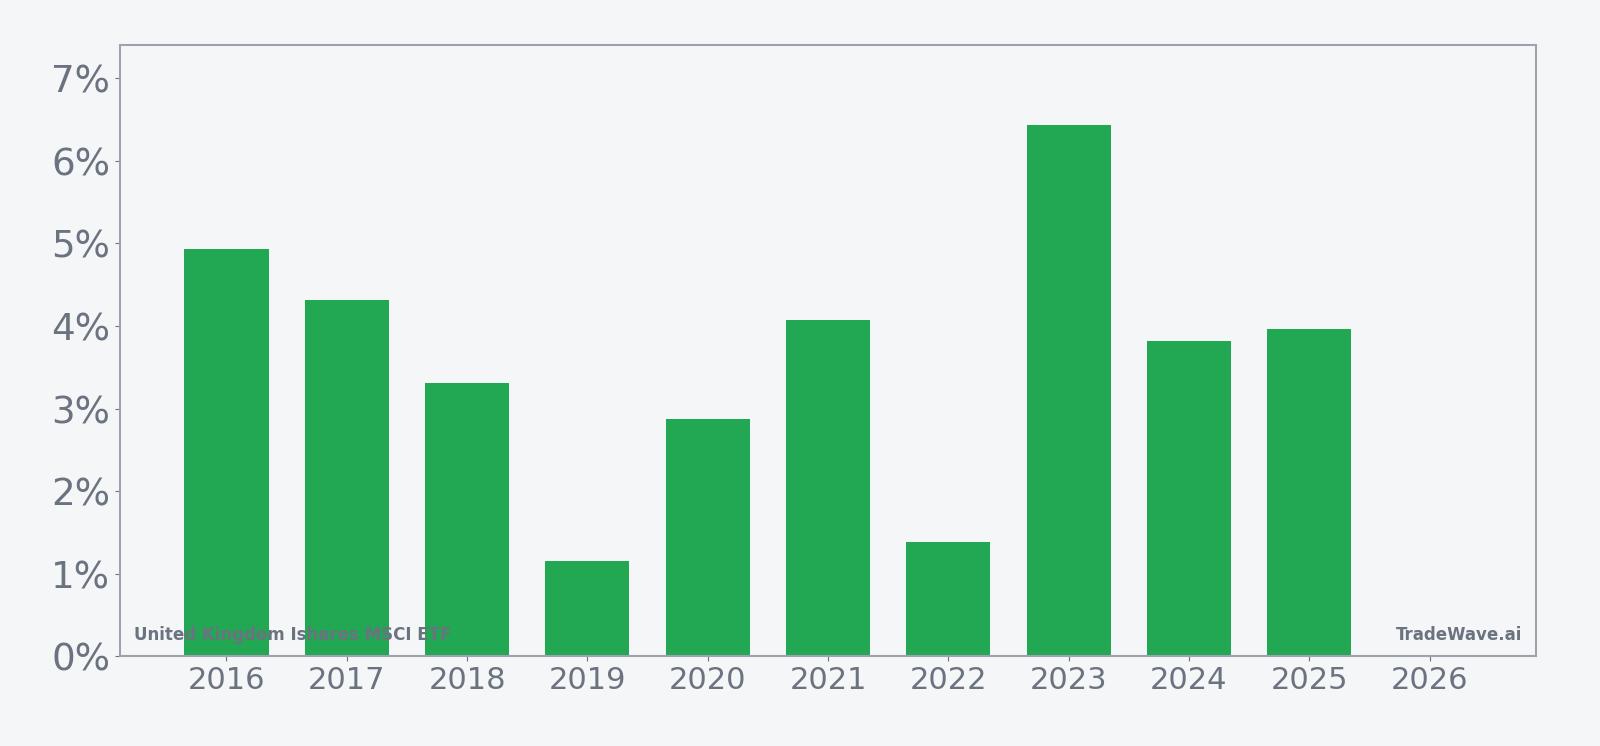
Across the 10-year sample, the pattern has been unambiguously aligned with the long side: every instance produced a positive net return over the 51-day span, with an average gain of 3.62% and a median outcome of 3.89%. The strongest year in the sample was 2023, when the ETF advanced 6.44% during the window, while the softest outcome was 2019, which still delivered a 1.15% gain by the end of the period.
The intraperiod path has not always been smooth. In 2020, for example, the ETF ultimately finished the window up 2.87%, but the worst drawdown from entry reached a sharp 18.78% before recovering, highlighting how adverse excursions can coexist with a positive final result. By contrast, 2019 saw a relatively modest maximum adverse move of 0.49% and a maximum favorable move of 3.22%, illustrating that some years have been comparatively calm.
On the upside, several years have recorded sizable peak run-ups within the window. Maximum favorable moves ranged from 3.22% in 2019 to 8.7% in 2020, with 2023 and 2022 also posting strong intraperiod rallies of 8.53% and 8.16% respectively. That combination of solid average gains and repeated instances of larger upside swings is consistent with the relatively high TradeWave Ratio of 2.46, which summarizes how far price has typically traveled in the trade direction during this stretch.
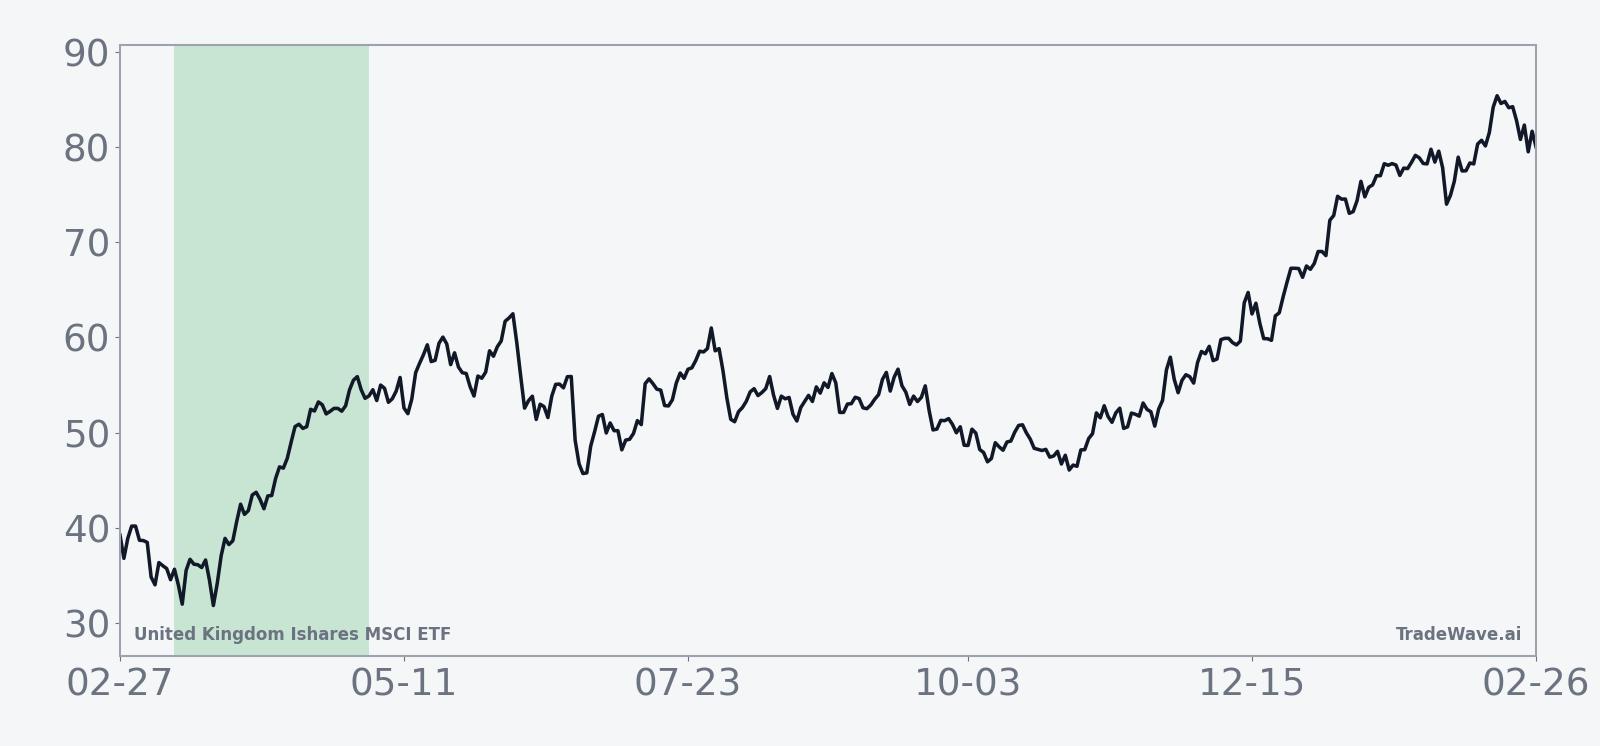
The 10-year average seasonal trend suggests that gains have tended to accumulate gradually rather than arriving in a single burst. The typical path shows an early stabilization phase followed by a steady upward drift into the latter half of the window, consistent with a pattern where pullbacks have historically been bought rather than extended into deeper declines.
A closer look at yearly net results alongside peak run-ups and worst drawdowns highlights how upside potential and downside risk have interacted within this window.
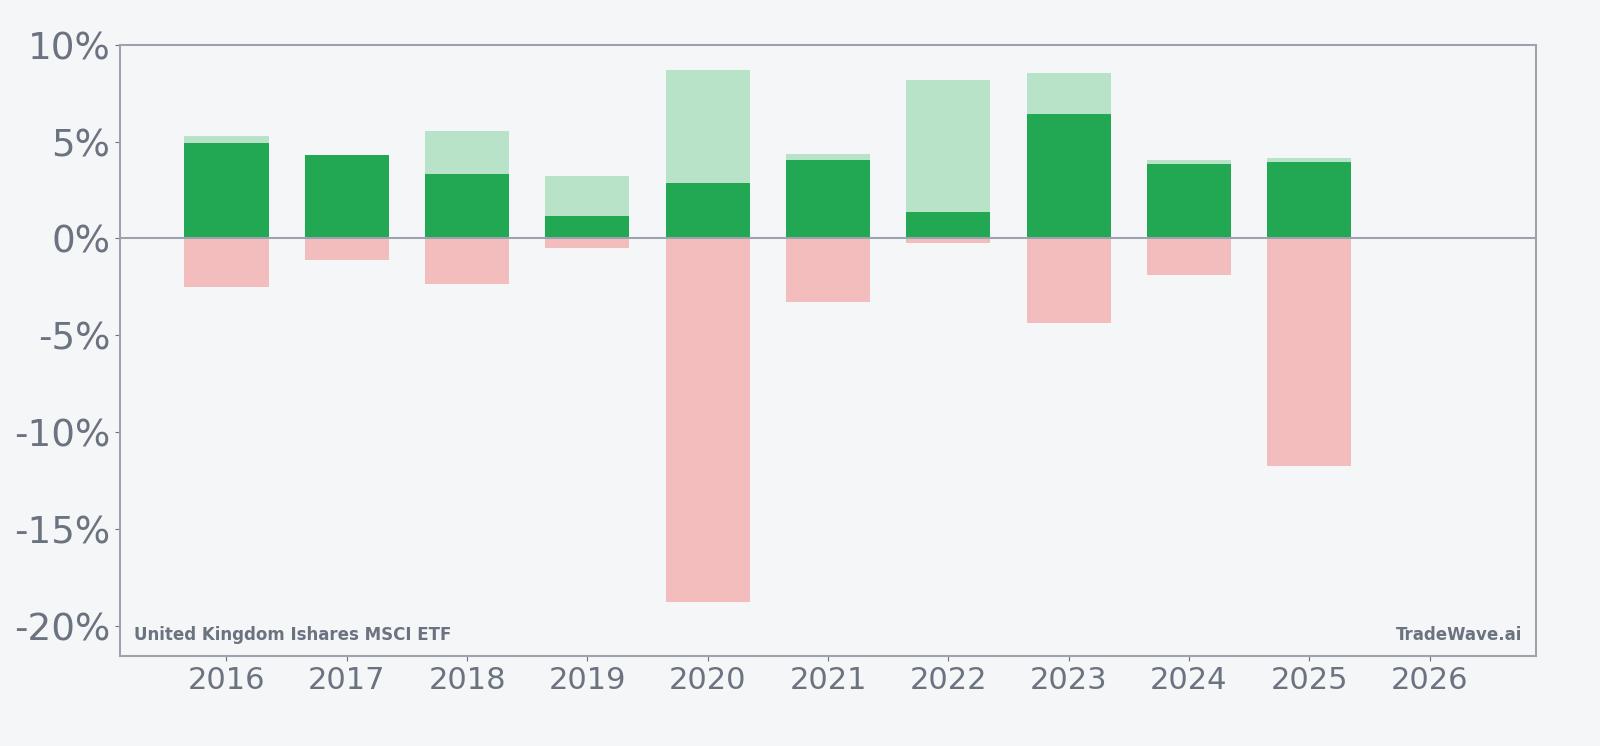
Viewed together, the per-year net, best run-up and worst drawdown bars show a window that has historically rewarded long exposure but with meaningful volatility in several instances. Years like 2020 and 2025 combined respectable final gains of 2.87% and 3.96% with deep intraperiod drawdowns of 18.78% and 11.77%, while others such as 2017 and 2019 delivered smoother profiles with relatively contained downside. Taken together, the historical pattern defines the quantitative seasonal backdrop for the upcoming period.
History does not guarantee future results, and adverse excursions can be large even in windows that ultimately finish higher.
Price and near-term drivers
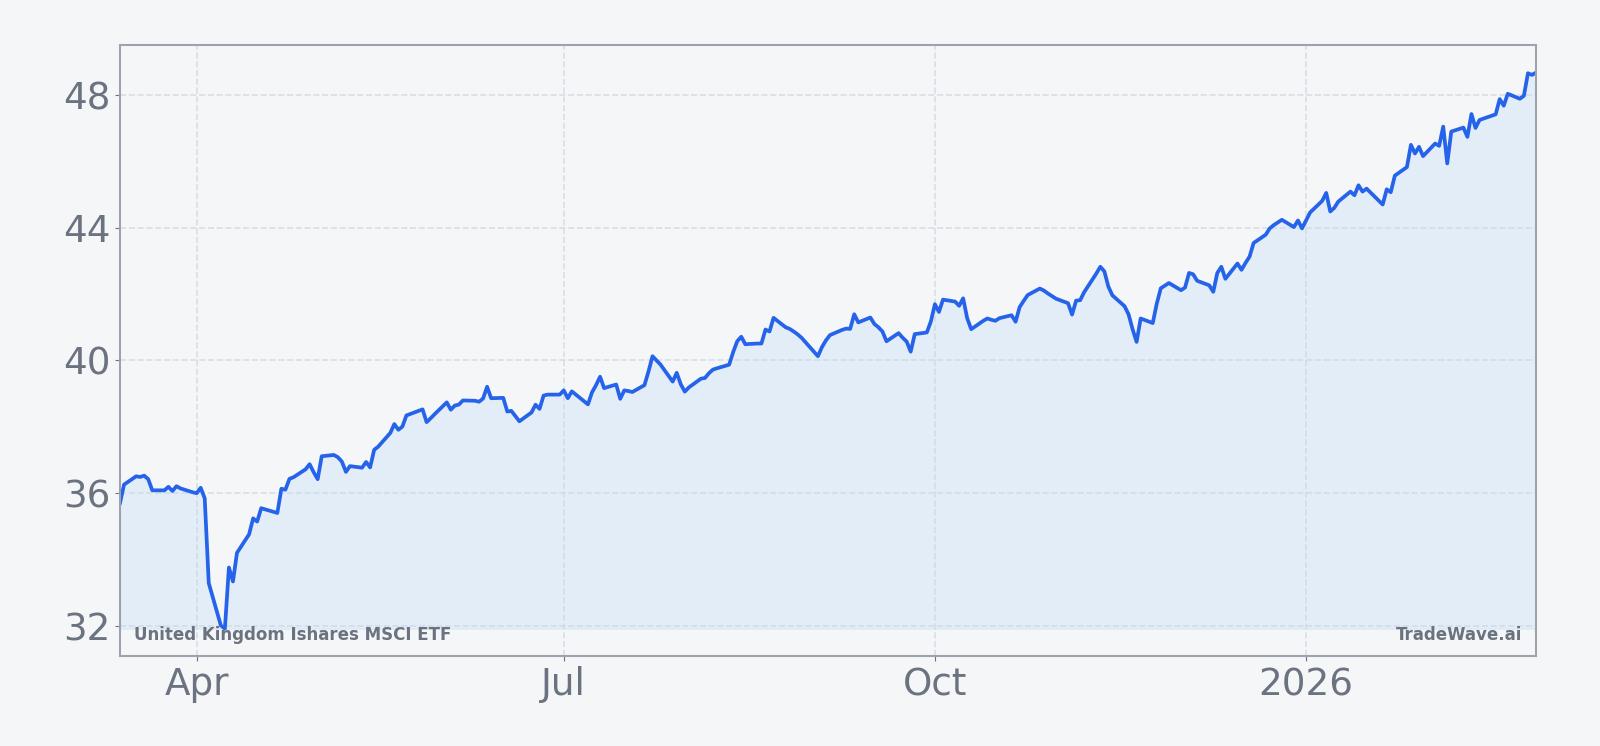
Real-time pricing and flow data for United Kingdom Ishares MSCI ETF were not available as of this analysis, leaving the seasonal pattern as the clearest quantitative anchor for investors evaluating U.K. equity exposure. The ETF tracks a broad basket of U.K. large- and mid-cap stocks, so its performance tends to reflect shifts in global risk appetite toward overseas markets as well as country-specific factors such as domestic growth, currency moves and policy expectations.
The chart below situates the ETF’s recent behavior in its broader 12-month context.
Broader sentiment toward international equities has been sensitive to shifting views on trade and tariffs. On Feb 22, 2026, for example, a strategist commentary highlighted the risk of a reversal in overseas stocks following signals of potential tariff increases, underscoring how policy headlines can quickly alter flows into non-U.S. markets.[1] For an ETF like EWU, which aggregates U.K. blue chips across sectors, such macro currents can matter as much as company-level news when it comes to short-term performance.
Against that backdrop, the upcoming seasonal window offers a structured way to think about risk and opportunity. Historically, the pattern has combined a high hit rate with episodes of sizable intraperiod volatility, suggesting that investors who use the window as context may want to focus not only on direction but also on how quickly moves can develop. The historical maximum favorable and adverse excursions show that rallies and pullbacks alike have tended to unfold within the 51-day span rather than being confined to a narrow band.
Macro and exposure context
United Kingdom Ishares MSCI ETF provides diversified exposure to U.K. equities, which are often viewed as a proxy for both domestic economic prospects and broader global risk appetite. The index methodology typically tilts toward large financials, energy, consumer and industrial names, so sector-level developments in those areas can have an outsized impact on the ETF’s path.
Because the fund is denominated in U.S. dollars while holding U.K.-listed stocks, currency moves between sterling and the dollar can also influence returns for U.S.-based investors. Periods of sterling strength have historically amplified local equity gains in dollar terms, while a weaker currency can offset or even reverse positive moves in the underlying shares. That currency overlay is an additional lens through which to view the upcoming seasonal window.
Tracking considerations such as fees and any small deviations from the underlying index can also shape realized performance, though for large, liquid country ETFs these effects are typically modest over a 51-day horizon. For investors comparing EWU to broader international benchmarks, the key questions often revolve around relative sector mix, currency exposure and how U.K.-specific policy or growth surprises might interact with global trends.
What to watch as the window approaches
As the Mar 13 start date nears, investors watching United Kingdom Ishares MSCI ETF may want to track how global risk sentiment toward overseas equities evolves, particularly in light of ongoing discussions around trade policy and tariffs that could affect non-U.S. markets.[1] Price behavior in the early days of the window will be important: historically, the pattern has tolerated pullbacks but ultimately resolved higher, so whether any initial weakness is bought or extended could signal how closely this year is tracking the historical template.
Key levels on the chart include recent swing highs and lows from the past several months, which can serve as reference points for whether the ETF is following the typical gradual uptrend seen in the seasonal average or diverging into a more volatile path. Investors may also monitor relative performance versus broader international and U.S. benchmarks to see if U.K. equities are attracting incremental flows or lagging amid global reallocations.
Finally, given the history of sizable intraperiod swings in some years, it will be worth watching how volatility behaves inside the window. A pattern of higher daily ranges or sharp reversals would be consistent with prior episodes where the ETF experienced deep drawdowns before finishing higher, while a smoother climb would resemble the calmer years in the sample. How these dynamics unfold will determine whether the 2026 instance of this 51-day stretch ultimately fits the historical mold or marks a departure from it.
Sources
- The Wall Street Journal, “MARKET DATA,” Sep 4, 2025.
- CNBC, “Stocks making the biggest moves premarket,” Oct 22, 2025.
- Yahoo Finance, “Unlocking Q3 Potential of Oracle (ORCL),” Mar 5, 2025.
- CNBC, “WisdomTree Europe Value UCITS ETF EUR Acc quote page,” Dec 18, 2025.
- CNBC, “Janus Henderson Mexico Government Bond UCITS ETF quote page,” Dec 20, 2025.
- Reuters, “Western Alliance profit rises on higher interest income,” Oct 21, 2025.
- Forbes, “Second Quarter Earnings Season Preview,” Jul 13, 2025.
- CNBC, “FT Intl High Div Equity 58 CA quote page,” Dec 18, 2025.
- Seeking Alpha, “Commodities Tracker: September 2025,” Sep 28, 2025.
- Seeking Alpha, “Kolanovic warns of reversal in overseas stocks after Trump signals tariff hike,” Feb 22, 2026.
- Seeking Alpha, “S&P 500: Stay Safe And React - Week Starting 7th April,” Apr 6, 2025.