Fed Rate-Cut Debate Keeps Dow Jones Utility (DJU) Range-Bound Into Year-End
Dow Jones Utility is nearing a late-year seasonal stretch that has often seen the index soften in the year after a presidential election, just as investors reassess rate expectations and defensive positioning into early 2026.

Key takeaways
- Dow Jones Utility is approaching a 41-day seasonal window that begins on Dec 30 in the year after the presidential election and has historically favored downside moves for short positions.
- The pattern is grouped by election cycle and shows a short trade direction in this phase as policy and rate expectations reset heading toward the midterm election year.
- Historically, 89% of years in this window have been profitable for the short side, with 8 winners and 1 loser across the sample.
- Average gains in winning short years have been 5.13%, while including all years brings the average outcome to 4% in favor of the short direction.
- The TradeWave Ratio of 1.76 and a Sharpe ratio of 0.89 point to a window where price has typically traveled meaningfully in the trade direction with moderate risk-adjusted returns.
- Intraperiod swings have included notable adverse excursions, so even historically favorable short windows have carried meaningful drawdown risk before resolving lower.
According to historical data from TradeWave.ai, this upcoming stretch for Dow Jones Utility has behaved differently from a typical defensive consolidation period in past cycles, with a clear directional bias that traders often overlook.
Seasonal window
This seasonal window begins on 2025-12-30 and spans 41 days, and in years after a presidential election it has historically been a weak stretch for Dow Jones Utility when viewed from the perspective of short sellers. With the index trading near the end of a choppy year and investors weighing how utilities will respond to the next leg of the Federal Reserve’s policy path, the timing of this pattern into early 2026 gives portfolio managers another lens on potential downside and volatility.
Because the analysis is grouped by the presidential election cycle, it compares only years that share a similar policy backdrop: the year after a presidential election, when new administrations are implementing early agendas and markets are digesting the first wave of fiscal and regulatory signals. For utilities, which sit at the intersection of rate sensitivity, infrastructure policy and energy regulation, this phase can be especially important as capital spending plans and allowed returns are reassessed.
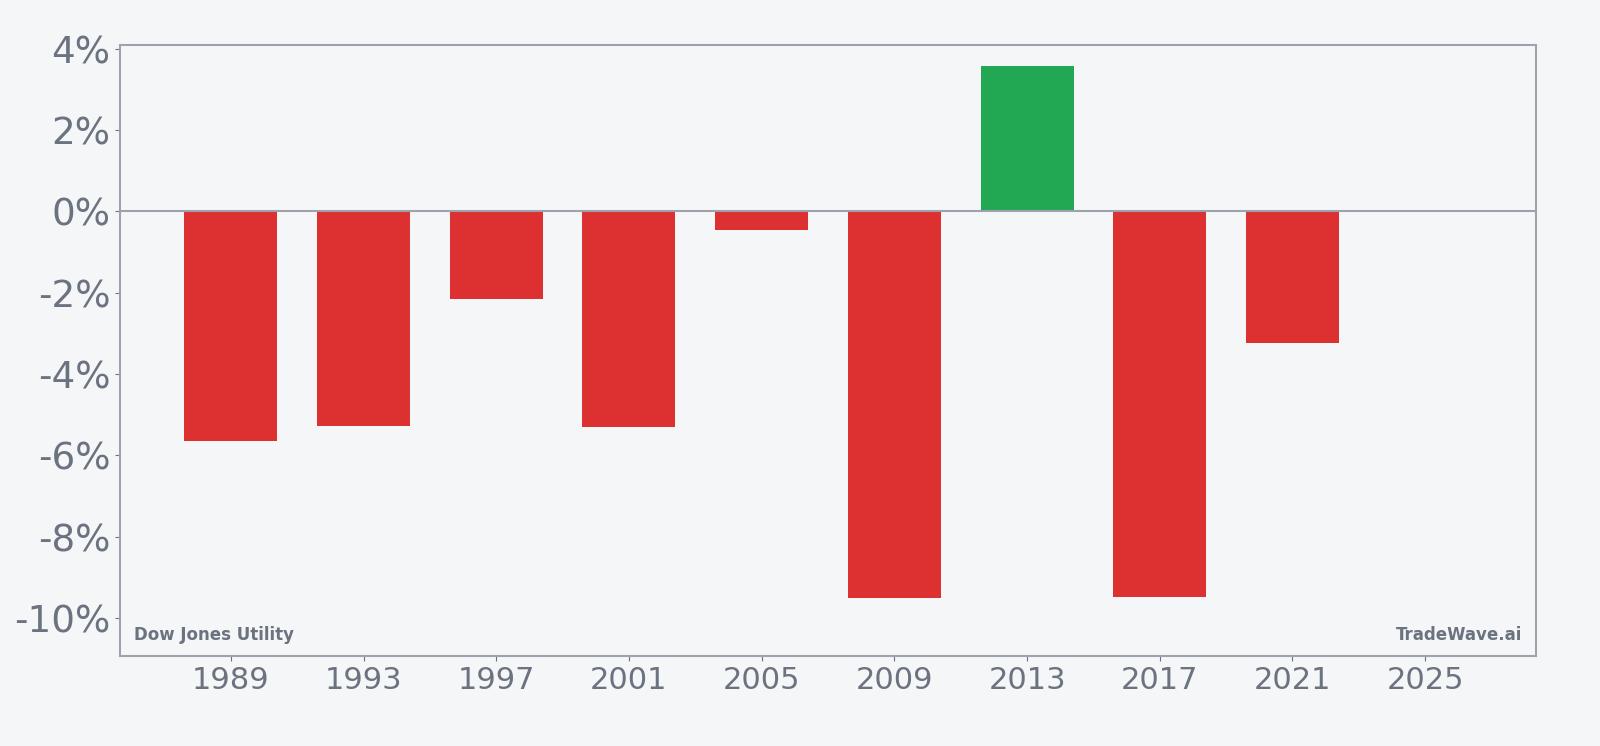
In this window, the trade direction is short, meaning the historical pattern has favored downside outcomes for the index rather than rallies. Across the sample, 89% of years have been profitable for the short side, with 8 winners and just 1 loser, indicating that in most cycles the index has tended to drift or break lower during this stretch. Average profit in winning years has been 5.13%, while the average across all years, including the one losing outcome, is 4%, which suggests that even when the pattern has not worked perfectly, the typical move has still leaned in favor of shorts.
The distinction between those two averages matters. Avg Profit reflects winners only, while Avg Profit - All includes every year in the sample, so the gap between 5.13% and 4% shows that the lone losing year did not fully erase the gains from the stronger short episodes. The average loss in down years for the pattern is -3.56%, which frames the scale of unfavorable outcomes when the index has instead rallied against the short direction.
The per-year breakdown shows that the strongest short-friendly outcome came in 2009, when the index fell 9.52% from entry to exit during the window, with a worst intraperiod drawdown of -10.02% from the starting level and only a modest 0.22% peak move against the short. By contrast, 2013 stands out as the weakest year for the pattern, with a 3.56% net gain for the index that would have been a losing outcome for shorts, even though the maximum adverse move against the short was limited to -2.09% and the best move in favor of the short reached 4.64% at one point before reversing.
A second view that layers net results with peak favorable and adverse moves helps clarify how far the index has typically swung inside the window before settling at its final level.
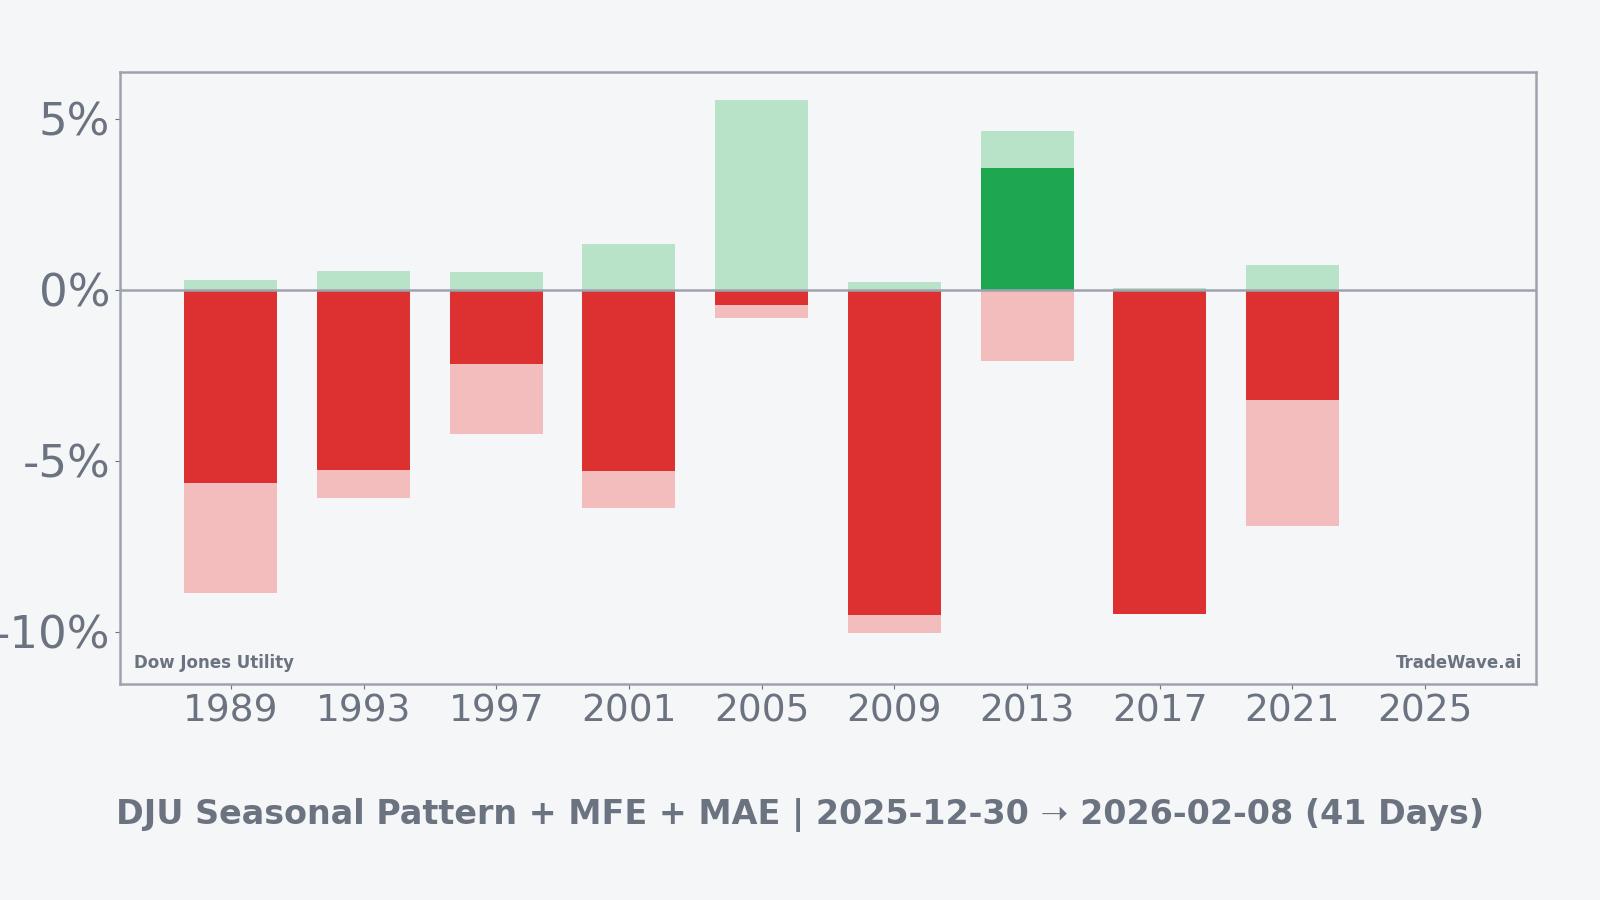
The combined net, maximum favorable excursion and maximum adverse excursion profile indicates that in many years the index has moved meaningfully in the short direction at some point during the window, consistent with the 1.76 TradeWave Ratio, yet there have also been episodes where early rallies created uncomfortable drawdowns before the pattern resolved. Taken together, the historical pattern defines the quantitative seasonal backdrop for the current period.
History does not guarantee future results; adverse excursions (MAE) can be large even in winning windows.
Price and near-term drivers
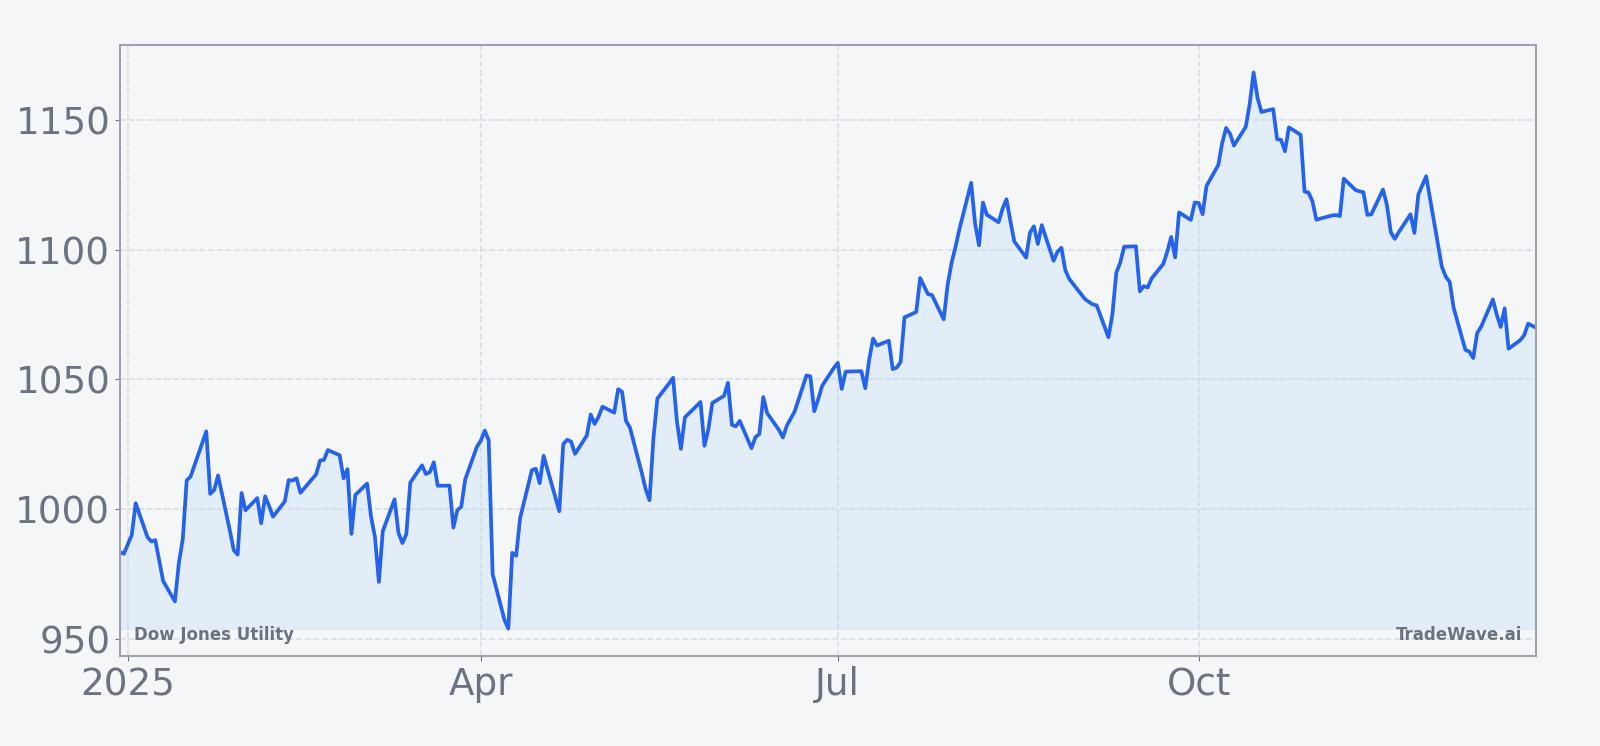
With only a few trading days left in 2025, Dow Jones Utility is finishing the year without a clear directional breakout, reflecting the broader tug of war between falling inflation, shifting rate expectations and sector-specific headlines in energy and utilities markets.[3] Recent sessions have seen utilities trade in line with the broader equity complex as investors respond to ongoing earnings updates, commodity price swings and evolving expectations for how quickly central banks might ease policy in 2026.[2]
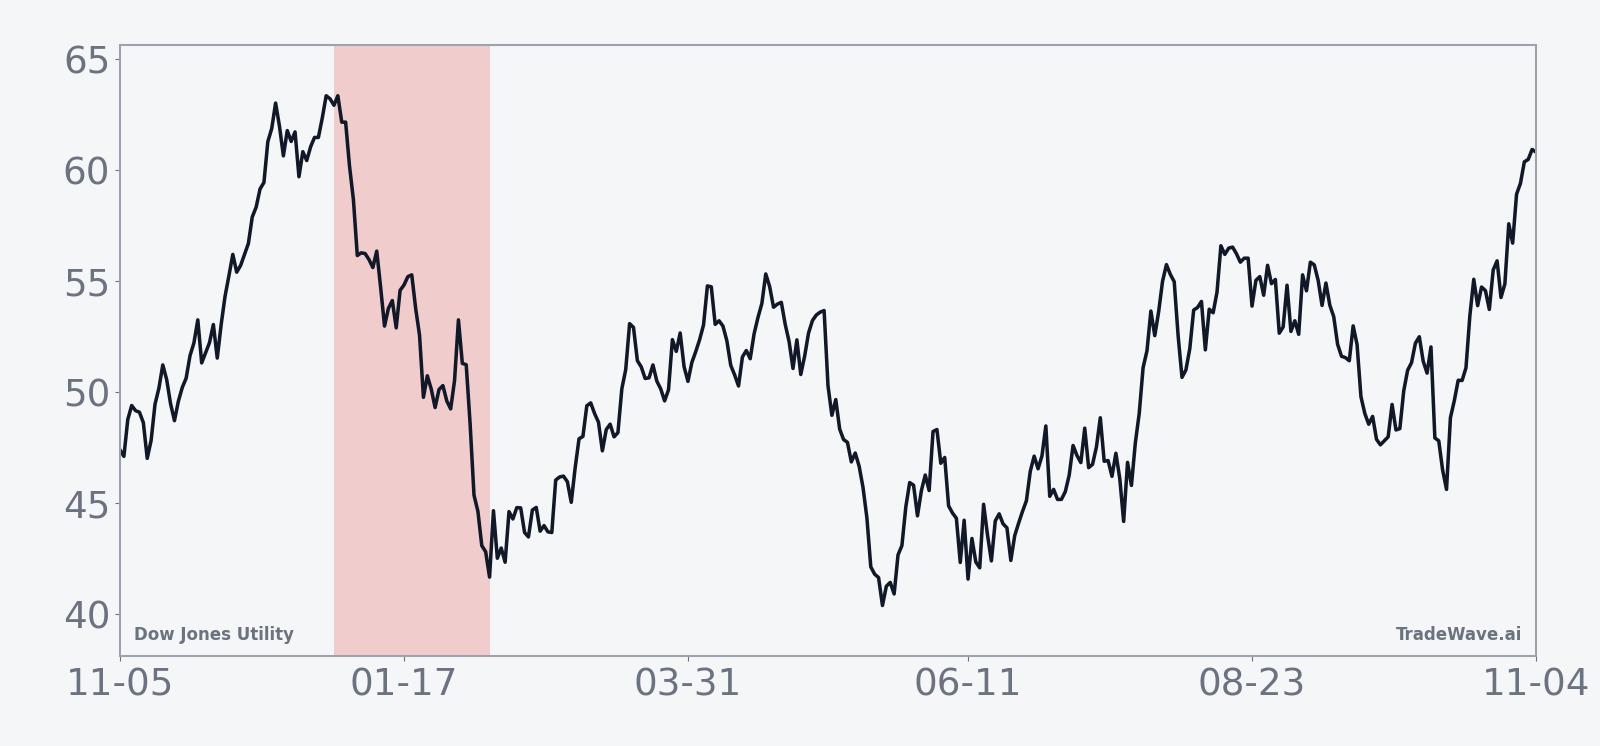
The chart below situates the latest move in its recent multi-month context.
Utilities have remained a focal point in broader market discussions about how income-oriented investors should position if bond yields continue to drift lower from their recent peaks, potentially restoring some of the relative appeal of regulated dividends.[4] At the same time, sector commentary has highlighted how policy debates around grid investment, renewable integration and reliability could shape capital spending and earnings trajectories for major utility constituents in the index over the next several years.[5]
That mix of macro and policy uncertainty is typical of the late part of the year after a presidential election, when the first wave of legislative and regulatory initiatives has been introduced but not fully implemented. As markets look ahead to the midterm election year, investors in defensive sectors such as utilities often reassess whether to lean into the traditional safe-haven role of the group or to rotate toward more cyclical areas if growth and liquidity conditions appear supportive.[6]
What to watch as the window opens
As this 41-day window begins on Dec 30, the first focal point will be how Dow Jones Utility trades relative to its recent range. Historically, the pattern has not required an immediate breakdown on day one; instead, weakness has often accumulated over the course of the window, with some years showing early rallies that later faded. Traders will be watching whether any initial strength is quickly sold into, which would be more consistent with the historical short-friendly profile, or whether sustained buying pressure challenges the pattern.
Policy and macro catalysts will also matter. Any fresh guidance on the pace of rate cuts, changes in inflation expectations or new signals on infrastructure and energy regulation could influence how investors value the sector’s dividends and growth prospects. A backdrop of falling yields and supportive policy could blunt the typical seasonal softness, while renewed concerns about funding costs or regulatory pressure might reinforce it.
From a technical perspective, the behavior of intraperiod swings will be important. In prior years, maximum favorable moves in the short direction and maximum adverse rallies against shorts have both been meaningful, underscoring that even historically weak windows can feature sharp countertrend bounces. If the index experiences sizable rallies that are quickly reversed, it would align with the pattern of volatility that has still tended to resolve lower by the end of the window. Conversely, a clean, low-volatility grind higher would look more like the outlier year in the sample and would signal that the market is treating this cycle differently.
For investors and risk managers, the takeaway is not that a particular outcome is guaranteed, but that this specific stretch in the calendar, in the context of the year after a presidential election and heading toward a midterm year, has repeatedly produced a distinct behavior profile for Dow Jones Utility. Monitoring how price action, policy headlines and rate expectations evolve as the window opens will help clarify whether 2026 is tracking closer to the historical script or writing a new one.
Sources
- [1] Barchart.com, “3 High-Growth Dividend Kings For Generations of Income - And Still Rated 'Buy',” Nov 15, 2025. Link
- [2] Seeking Alpha, “Wall Street returns to green as earnings push persists, gold touches $4.2K (DJI:),” Oct 15, 2025. Link
- [3] Seeking Alpha, “Wall Street finished higher to kick off the holiday shortened trading week,” Dec 22, 2025. Link
- [4] The Wall Street Journal, “Energy & Utilities Roundup: Market Talk,” Mar 05, 2025. Link
- [5] The Wall Street Journal, “Energy & Utilities Roundup: Market Talk,” Aug 26, 2025. Link
- [6] The Wall Street Journal, “Energy & Utilities Roundup: Market Talk,” Aug 21, 2025. Link
- [7] MarketBeat, “HudBay Minerals Inc $HBM Stock Holdings Raised by Franklin Resources Inc.,” Dec 01, 2025. Link
- [8] Barchart.com, “Forget the AST SpaceMobile Deal: It’s Verizon (VZ) Stock’s Wildly Rare Quant Signal That’s the Showstopper,” Oct 09, 2025. Link
- [9] Barchart.com, “Rosen Law Firm Encourages Soleno Therapeutics, Inc. Investors to Inquire About Securities Class Action Investigation - SLNO,” Oct 05, 2025. Link
- [10] Barchart.com, “Agricultural Biologicals Market Size, Growth Drivers, Latest Trends, Opportunities, Top Companies, Recent Developments, Future Outlook, and Forecast – 2030,” Oct 06, 2025. Link
- [11] Barchart.com, “Jensen Huang Says the U.S. Is Desperate for Data Centers. Here’s 1 Top-Rated Stock to Buy Now.,” Oct 14, 2025. Link
- [12] Barchart.com, “As SoundHound Announces New Apivia Deal, Should You Buy, Sell, Or Hold SOUN Stock?,” Oct 08, 2025. Link
- [13] Seeking Alpha, “S&P 500: This Is Unusual, Week Starting 7th July (Technical Analysis) (SP500),” Jul 06, 2025. Link
- [14] Barchart.com, “Rosen Law Firm Encourages Telix Pharmaceuticals Ltd. Investors to Inquire About Securities Class Action Investigation - TLX,” Oct 10, 2025. Link