S&P 500 Healthcare Sector SPDR (XLV) Has Dropped in 6 of 6 Midterm Spring Windows
S&P 500 Healthcare Sector SPDR is heading toward a historically weak 49-day midterm-year stretch just as the sector’s rally from last year’s lows faces a new policy and rate backdrop.

Key takeaways
- Across the last 6 midterm election years, this 49-day window has produced losses for S&P 500 Healthcare Sector SPDR in every single case, aligning with a short trade direction.
- The upcoming pattern window begins on Mar 18, 2026 and runs for 49 trading days, covering the heart of the spring policy and earnings season for healthcare.
- Percent Profitable is 100% with 6 winners and 0 losers for the short setup, with average profits of 3.9% in those winning years.
- The TradeWave Ratio of 4.66 indicates that price has typically traveled meaningfully in the short direction within the window, even beyond the final net move.
- Historical best and worst intraperiod swings show that favorable downside moves have often been accompanied by sizeable adverse rallies, underscoring a choppy, high-variance environment.
- For a sector ETF that recently staged a roughly 25% rally off an August low in a prior cycle, this midterm-year pattern flags a potential stress test for healthcare leadership.[1][2]
According to historical data from TradeWave.ai, this midterm-year spring stretch in healthcare behaves very differently from an average month on the calendar, and the next iteration is about to open.
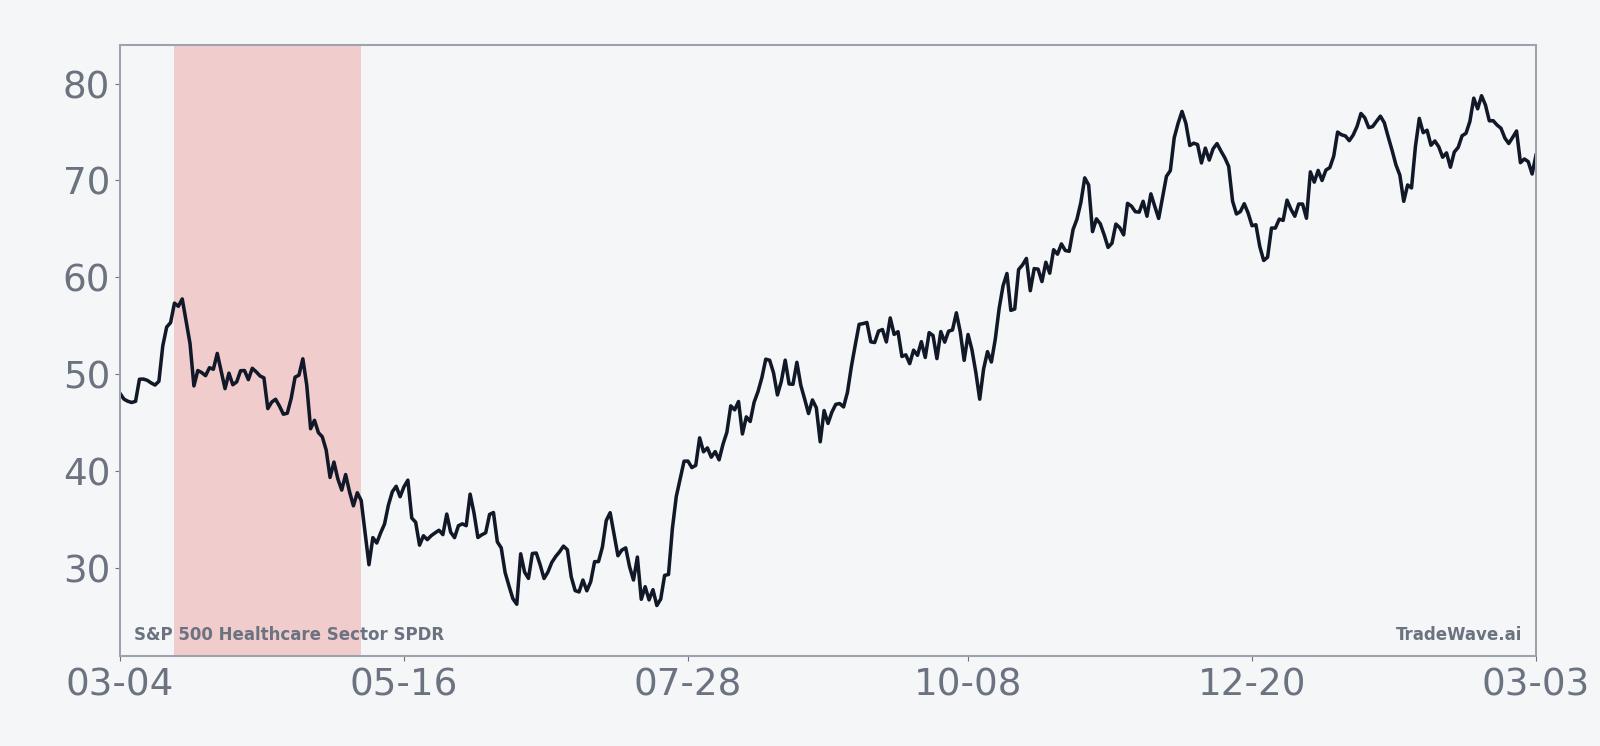
Seasonal window
S&P 500 Healthcare Sector SPDR has posted short-side gains in all 6 midterm election years during this 49-day spring window, averaging 3.9% profits for the short setup. The next window begins on Mar 18, 2026, with XLV trading within sight of its 52-week high after a steady grind higher over the past year. That combination of a clean uptrend and a historically one-sided bearish window is what makes this slice of the calendar stand out for healthcare traders.
The presidential election cycle matters here because this pattern is built only from midterm election years, a phase that often brings policy fights over drug pricing, reimbursement and fiscal restraint. Grouping by the cycle strips out noise from other years and focuses on how healthcare has behaved when Washington is in the middle of a four-year term and markets are digesting both regulation and budget debates.
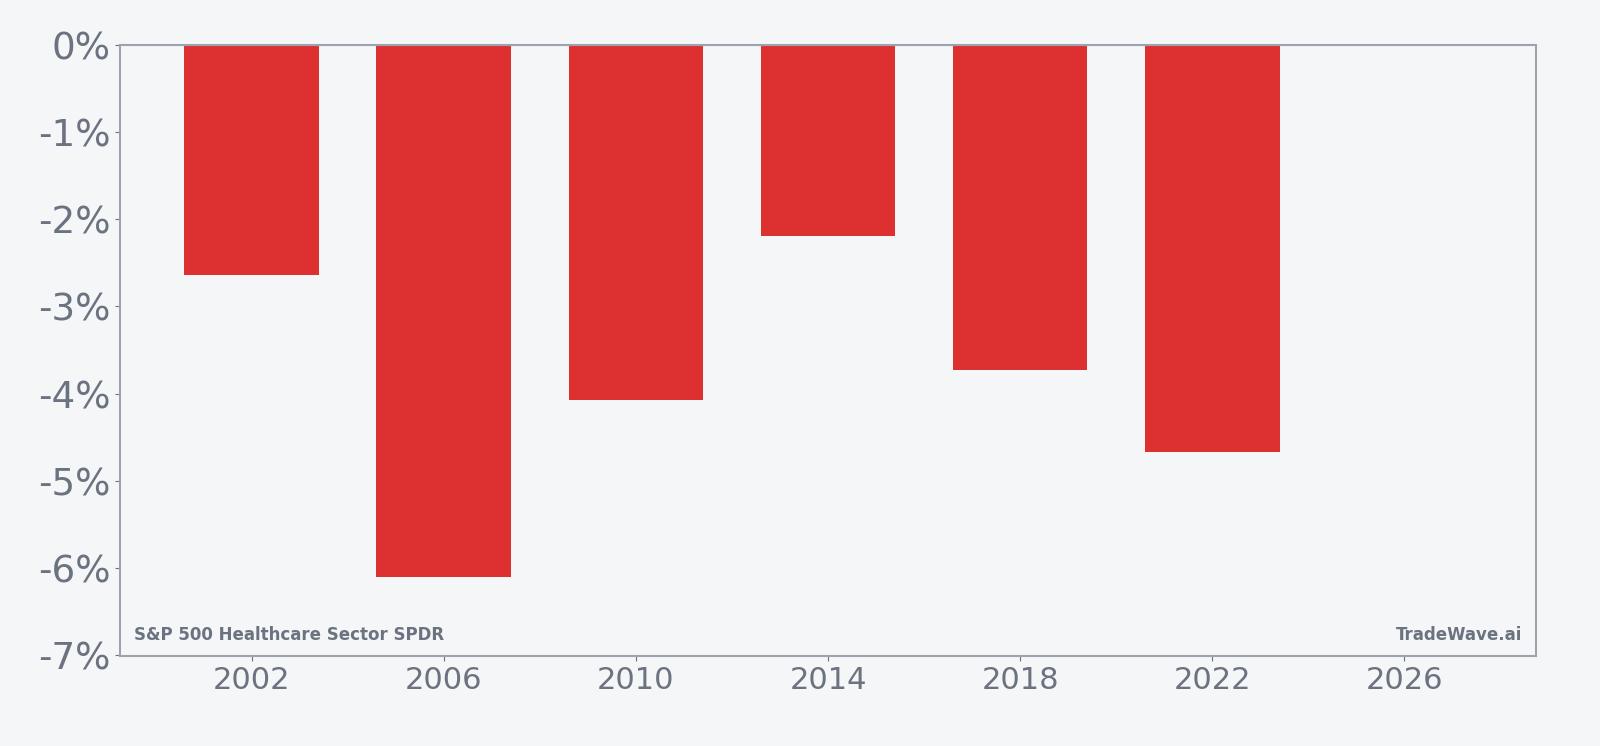
The average seasonal trend line slopes lower for most of the 49-day span, consistent with a short trade direction that has worked in every midterm year in the sample. Losses for XLV in those years ranged from about 2.2% to 6.1% on a close-to-close basis, with the cumulative return across all six windows totaling 25% for the short side. The pattern tends to see pressure build as the window progresses rather than a single sharp break, which fits with a backdrop of rolling policy headlines and earnings revisions rather than one-off shocks.
Year-by-year bars that combine net results with peak rallies and drawdowns show how much XLV has typically moved inside the window, not just where it finished.
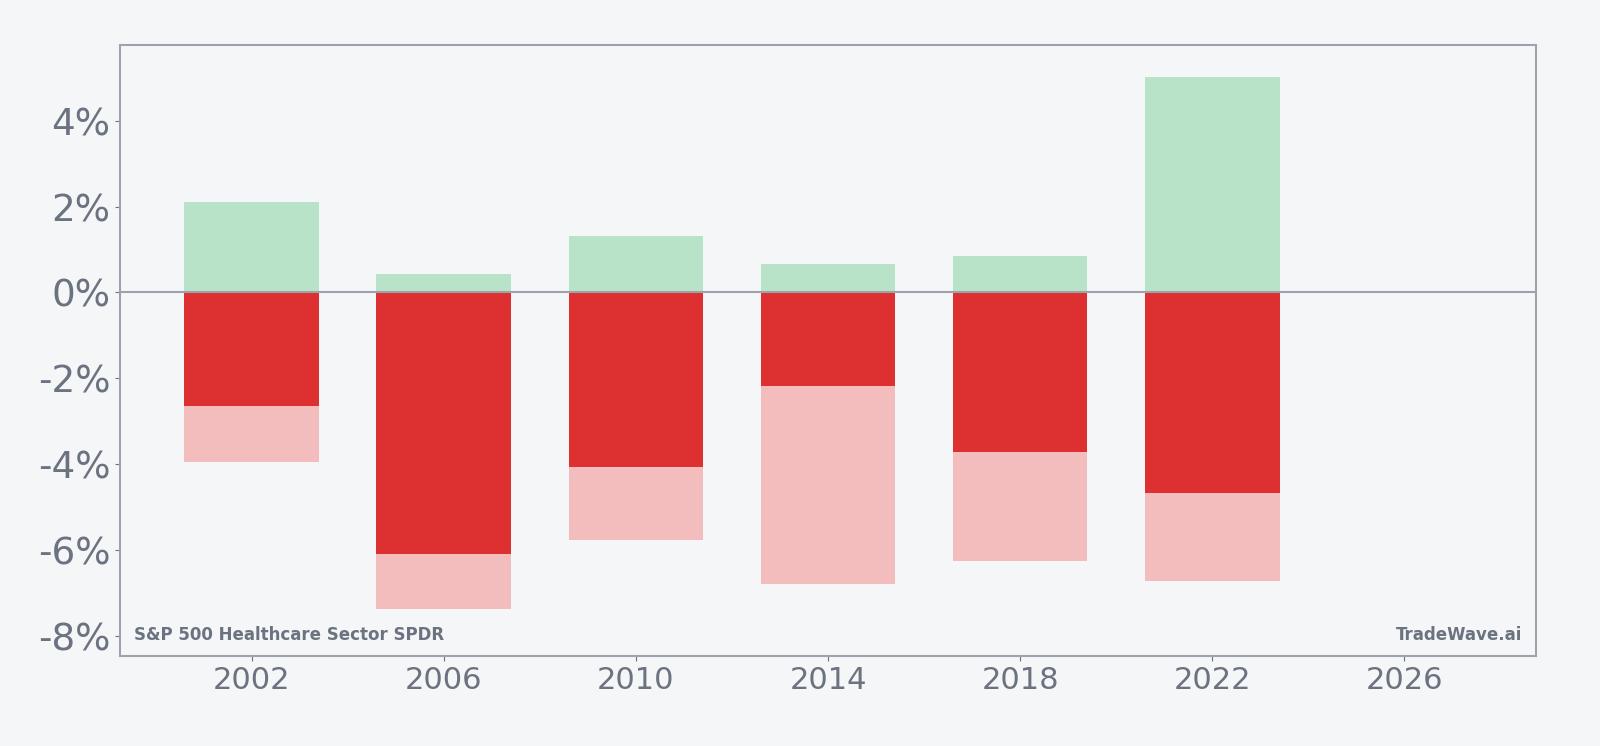
Intraperiod swings have been meaningful. In 2006, XLV fell 6.1% over the window with a worst drawdown from entry of about 7.38%, while the best rally against the short was only 0.43%. In 2022, the short still finished ahead with a 4.67% gain, but the ETF staged a sizable countertrend rally of 5.02% at one point and also saw a 6.73% adverse move from the entry before rolling over. That mix of strong maximum favorable moves and sizeable maximum adverse excursions is what the TradeWave Ratio of 4.66 is capturing: when this window moves, it tends to move hard in both directions before settling lower.
Across the six midterm years, the weakest short outcome came in 2014 with a 2.19% gain, while 2006 stands out as the strongest at 6.1%. None of the windows produced a losing year for the short setup, which is unusual for a sector ETF with a generally upward long-term trend. Add it up and you get a pattern that has quietly leaned against healthcare strength in every midterm spring in the dataset.
History does not guarantee future results, and even in a window with six of six winning shorts, adverse excursions within the period have been large enough to challenge timing and risk management.
Price and near-term drivers
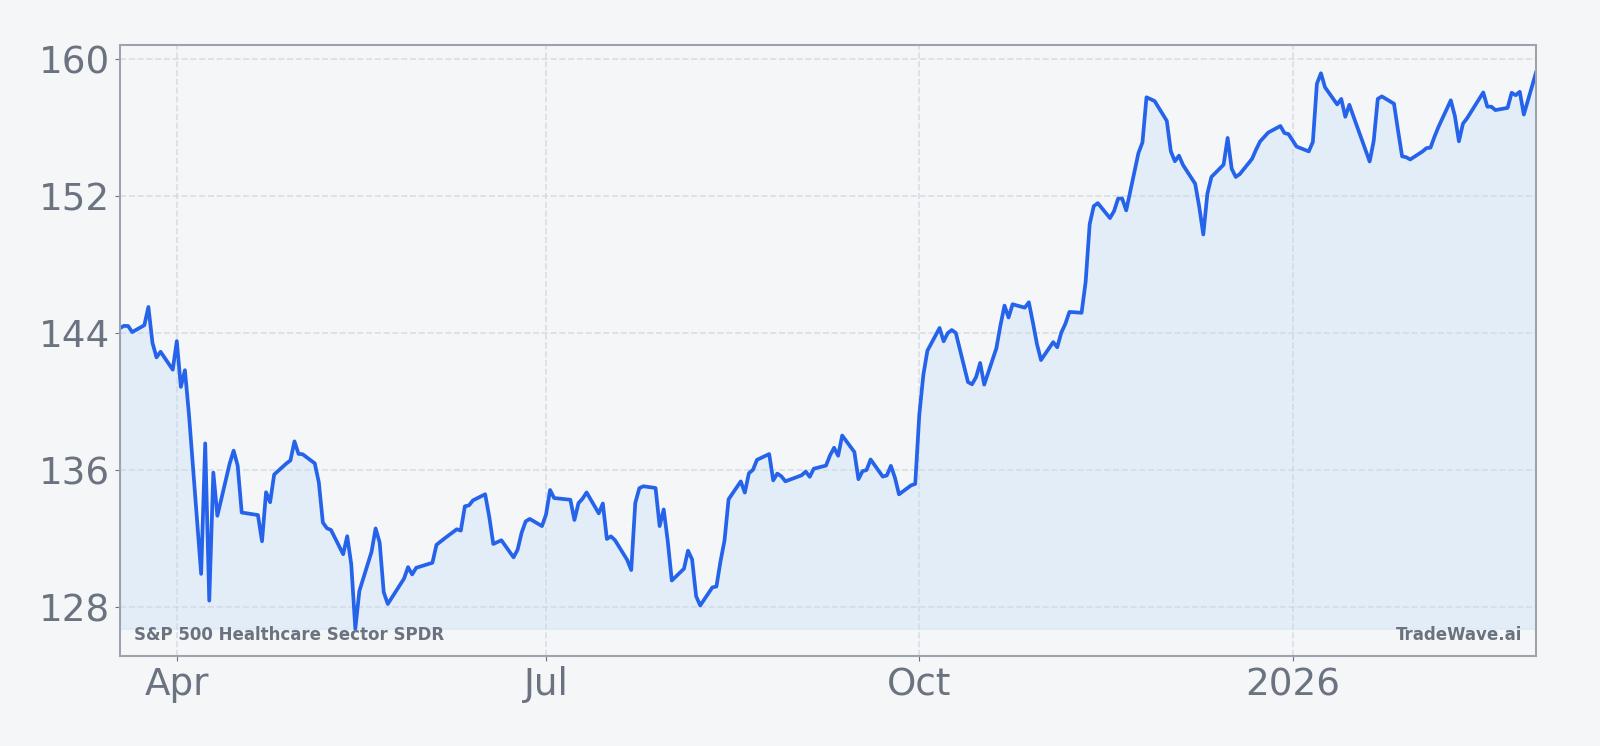
XLV has been trading in a firm uptrend over the past year, helped by a roughly 25% rally from an August low in a prior cycle that reestablished healthcare as one of the steadier S&P 500 sectors.[2] That move came as investors rotated back into defensives during bouts of macro stress, with healthcare benefiting from its mix of stable cash flows and exposure to innovation.
The chart below situates the latest move in its recent multi-month context.
Macro and policy headlines have kept healthcare in the crosshairs. In one earlier episode, U.S. stocks came under pressure as jobs data and tariff worries collided with renewed focus on healthcare costs, reminding investors how quickly sentiment can swing when Washington turns its attention to the sector.[1] At other points, healthcare has led S&P 500 sector gains as investors sought relative safety and leaned into clean breakout patterns in XLV.[2]
Those cross-currents are likely to intensify as the United States moves deeper into the midterm election year. Drug pricing, reimbursement formulas and the structure of public programs tend to resurface in budget debates, while large-cap pharma and managed care names inside XLV often become political talking points. For an ETF that has recently rewarded dip-buyers, the historical pattern of midterm spring weakness is a reminder that this part of the cycle has not been a straight line for healthcare.
What to watch as the window opens
The seasonal clock starts on Mar 18, 2026 and runs for 49 trading days, carrying XLV through much of the spring policy and earnings calendar. Traders watching this window will focus on three things.
First, the policy tape. Any renewed push on drug pricing, reimbursement cuts or broader healthcare cost controls could echo prior midterm years when sector headlines weighed on XLV even as the broader market chopped sideways.[1] The more Washington rhetoric heats up, the more the historical pattern of spring softness comes into play.
Second, price behavior relative to the seasonal script. In prior cycles, XLV has tended to roll over during the window rather than explode higher, with rallies often fading into lower closes by the end of the 49 days. If the ETF instead powers to fresh highs and shrugs off intraperiod drawdowns, that would mark a clear break from the six-for-six short record. If it starts to stall near recent peaks and sells off in waves, the pattern would be tracking closer to its historical template.
Third, volatility inside the window. The history of sizeable maximum adverse and favorable excursions means that even when the short side has ultimately won, the path has been bumpy. Large intraday and multi-day swings, especially around earnings clusters for big XLV constituents, would be consistent with that profile. A quieter tape with shallow pullbacks would be less in line with prior midterm springs.
For healthcare investors and traders, the message is not that XLV must repeat its six-for-six record, but that this specific midterm-year stretch has behaved differently from the rest of the calendar. As the window opens, how the ETF trades around policy headlines, earnings surprises and key price levels will show whether this cycle is another entry in the same seasonal playbook or the one that finally breaks the streak.