S&P 500 Healthcare Sector SPDR (XLV) Has Dropped in Every Midterm Spring Since 2002
S&P 500 Healthcare Sector SPDR is heading toward a 49-day midterm-year stretch that has historically favored the bears, just as the ETF trades near the upper end of its recent range.

Key takeaways
- A 49-day seasonal window for S&P 500 Healthcare Sector SPDR (XLV) begins on Mar 18 and runs through early May in midterm election years.
- Across the last 6 midterm election years, this window has produced 6 winners and 0 losers for a short bias, with XLV falling every time.
- The average move in those winning short years was a 3.9% decline, with cumulative losses of 25% across the sample.
- Intraperiod swings have been meaningful, with maximum adverse moves against the short side reaching between about 4% and 7% before the pattern ultimately finished lower.
- The pattern clusters in the early part of the midterm election year, when policy uncertainty around healthcare pricing and regulation has often been elevated.
- Traders watching XLV’s recent strength should be aware that this specific slice of the calendar has not rewarded complacent longs in prior midterm cycles.
According to historical data from TradeWave.ai, this upcoming midterm-year stretch has behaved very differently from an average spring for XLV. The next section walks through how that pattern has played out in past cycles and what it implies for the backdrop this year.
Seasonal window
S&P 500 Healthcare Sector SPDR has declined in all 6 midterm election years during this 49-day spring window, averaging 3.9% losses for a short bias. The next iteration begins on Mar 18, with XLV trading within its recent 52-week band and healthcare still digesting a powerful rally from last year’s lows. That combination of a clean, all-down history and a market leaning bullish into the window makes this slice of the calendar hard to ignore for anyone exposed to the sector.
The pattern is built on the last 6 midterm election years, a phase of the presidential cycle that often brings heavier policy noise for healthcare. Grouping by the election cycle matters here because midterm years tend to concentrate legislative risk, from drug pricing debates to reimbursement changes, in ways that do not show up if you simply average all years together.
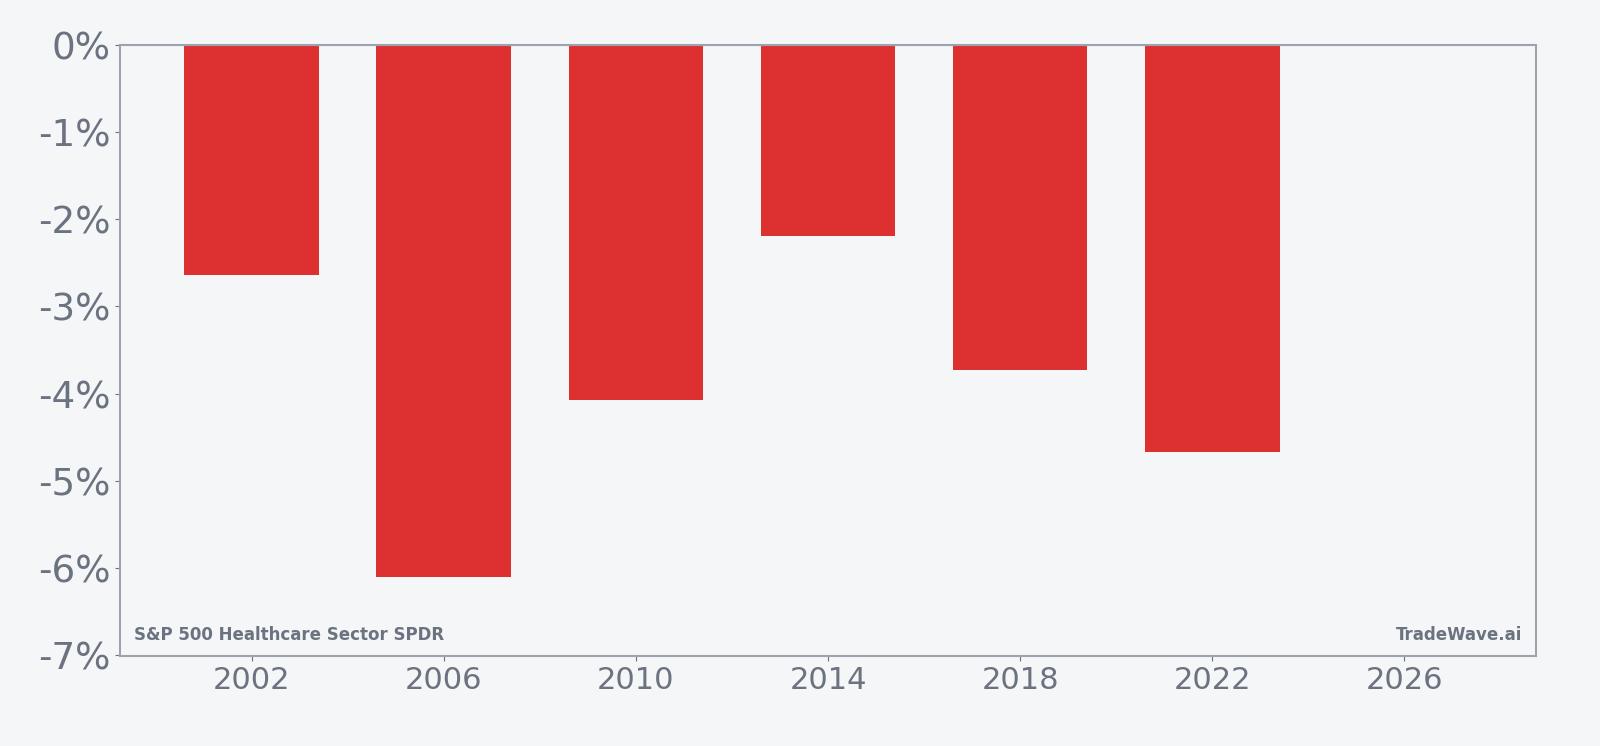
Historically, the trade direction for this window has been short. Every midterm-year sample from 2002 through 2022 finished with XLV lower over the 49-day span, with net returns ranging from a 2.19% drop in 2014 to a 6.1% decline in 2006. For a short bias, those are all “winning” years, and the 100% Percent Profitable record with 6 winners and 0 losers is unusually clean for a sector ETF.
The average profit of 3.9% reflects the mean decline across those six short-favorable years. Because there were no losing years in the sample, the all-years average lines up with that same 3.9% figure, and the cumulative return across the pattern is a 25% drop for XLV over the combined windows. The median outcome is also a 3.9% decline, which tells you the typical midterm-year move has not been skewed by a single outlier.
Intraperiod behavior has not been one-way traffic. Maximum favorable excursions, the best point-to-peak moves in the trade direction, have ranged from about 2.1% in 2002 to 5.02% in 2022, showing that in some years the short side saw most of its gains only late in the window. Maximum adverse excursions, the worst drawdowns against the short, have been larger, between roughly 3.95% and 7.38%, which means shorts have often had to sit through rallies of 4% to 7% before the pattern ultimately resolved lower.
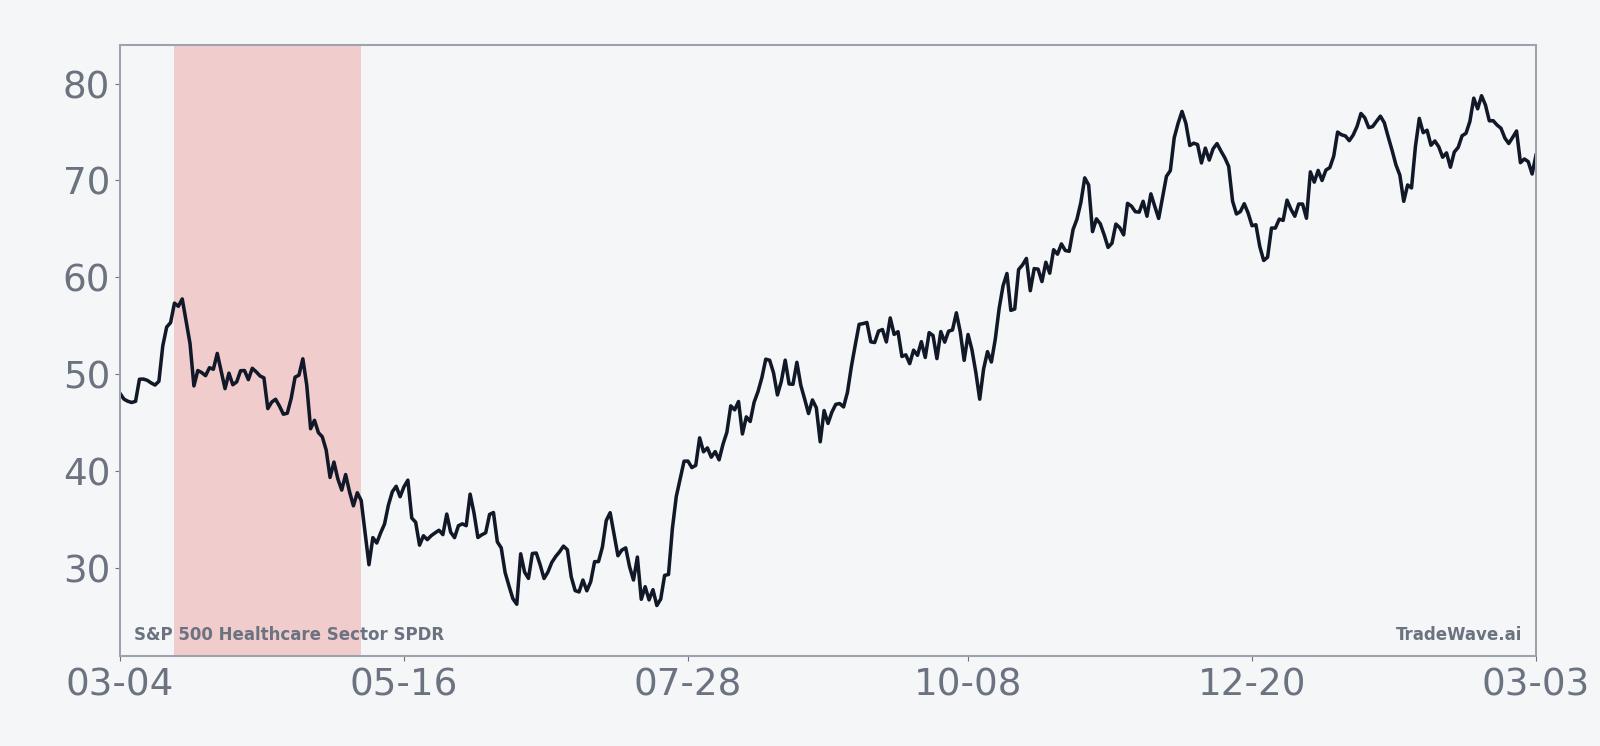
The historical trend profile for this window leans toward choppy weakness rather than a straight slide. In several years, XLV first pushed modestly higher or sideways before rolling over, which fits with the idea of early-year optimism in healthcare giving way to policy or valuation concerns as the midterm calendar develops. The seasonal trend chart shows that, on average, the bulk of the downside has tended to accrue in the back half of the 49-day span rather than in the opening days.
Year-by-year bars with embedded best and worst excursions show how consistently the window has leaned lower while still delivering sizable countertrend swings.
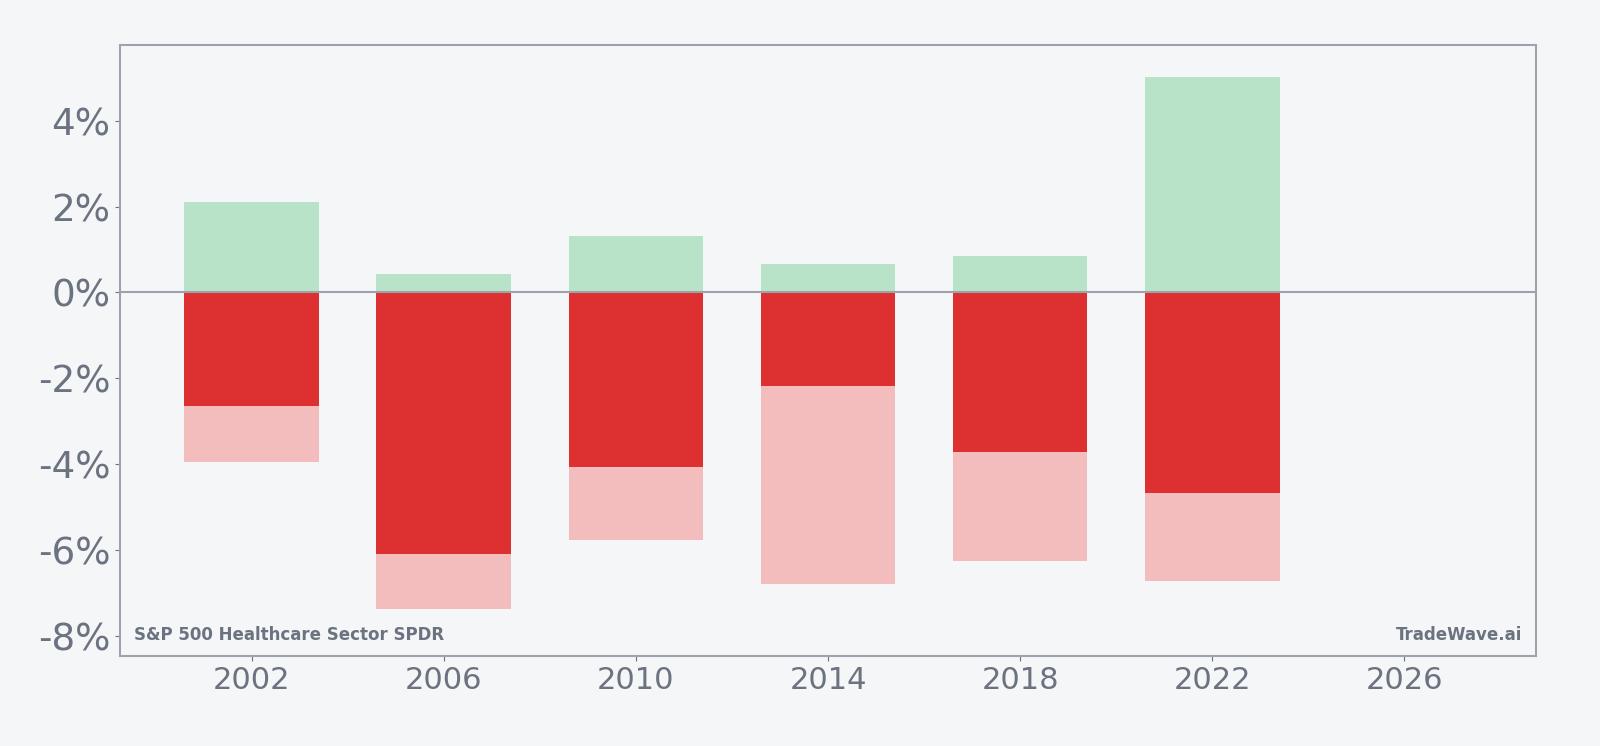
The stacked net, maximum favorable, and maximum adverse bars underline the trade-off. Shorts have ultimately been rewarded in every sample, but the adverse excursions show that timing and risk management have mattered, with several years featuring rallies of more than 5% before the downtrend reasserted itself. Add it up: six for six in favor of the short side, but rarely in a straight line.
History does not guarantee future results; adverse excursions can be large even in winning windows, and past midterm-year behavior may not repeat.
Price and near-term drivers
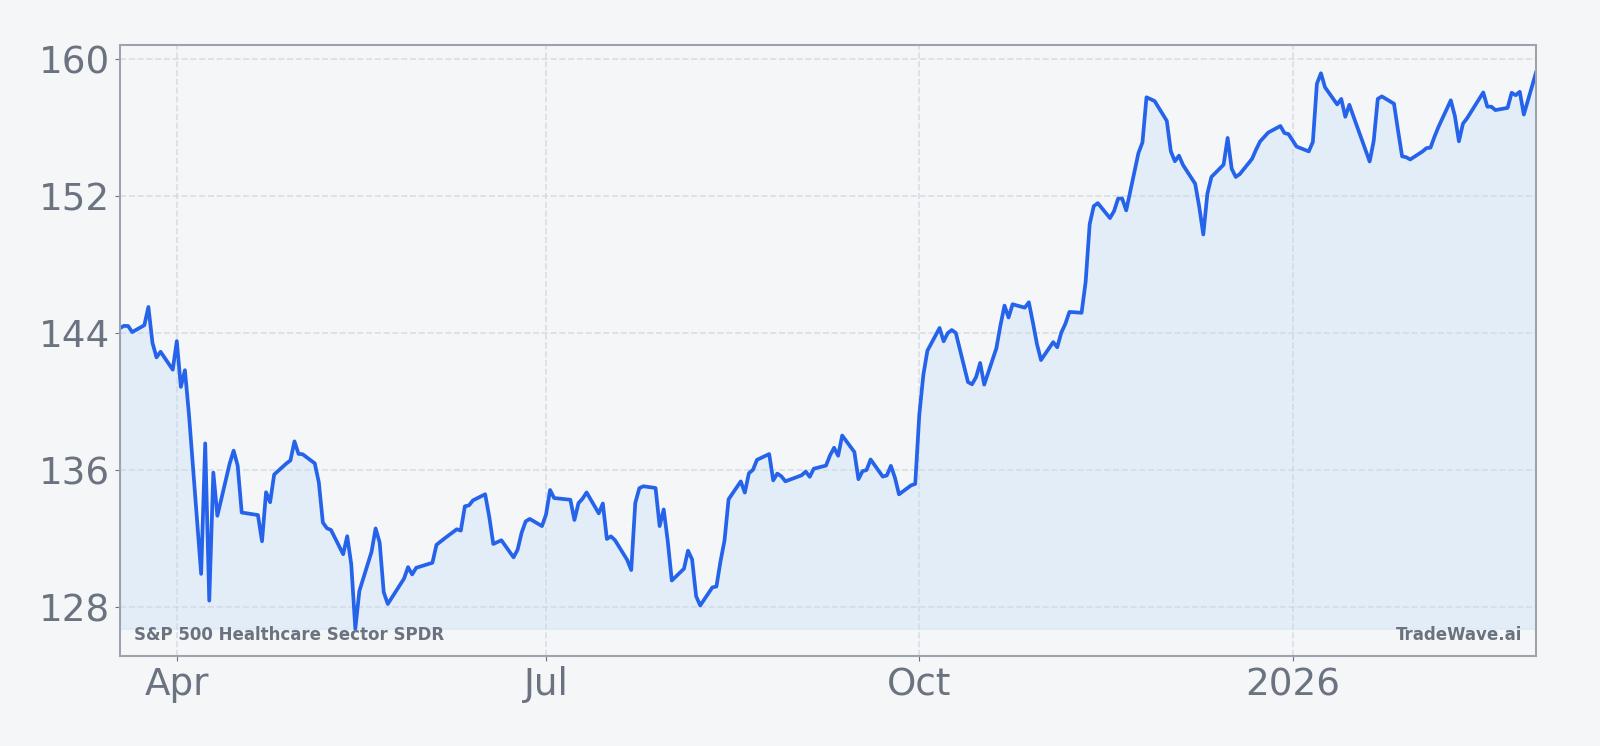
XLV’s exact last trade and daily move were not available as of this writing, but the ETF is operating between a 52-week low near 123.94 and a high around 160.59, with a 20-day average volume of roughly 14.6 million shares. That leaves healthcare near the upper half of its recent range after a powerful rebound from last year’s weakness, setting up a potential clash between bullish momentum and a historically soft midterm spring.
Sector narratives help explain why the calendar window matters. Political pressure on drug pricing has resurfaced, with renewed focus on big pharma’s margins and reimbursement structures that could weigh on the largest weights inside XLV.[1] At the same time, healthcare has been a leadership pocket in the broader market, with the ETF up roughly 25% from an August low in a rally that has left some technicians flagging overbought conditions and the risk of a shakeout.[8] That mix of policy uncertainty and stretched price action is exactly the kind of backdrop where a recurring seasonal pattern can become a catalyst rather than just a curiosity.
The chart below situates the latest move in its recent multi-month context.
Macro and political backdrop
The midterm election year is often when healthcare policy moves from rhetoric to draft legislation. Trump’s ultimatum to big pharma has already put drug pricing and reimbursement in the spotlight, raising questions about how aggressively a new administration might push on margins for large pharmaceutical and managed-care names that dominate XLV.[1] Even if concrete policy changes take time, the sector has a history of reacting first and asking questions later when headlines turn hostile.
At the same time, the broader healthcare complex has been a relative winner in the equity market, benefiting from defensive cash flows and renewed interest after a period of underperformance.[8] That leadership status can cut both ways. On the one hand, investors often lean into healthcare as a haven when macro uncertainty rises. On the other, when a crowded trade meets a seasonally weak window and a noisy policy tape, even modest disappointments can trigger outsized rotations.
For XLV, the early part of the midterm year has historically been the choppier half of the cycle, with this 49-day window capturing a chunk of that turbulence. The fact that the pattern is defined specifically on midterm years, rather than all years, suggests that the policy calendar and election-cycle positioning are integral to how the ETF trades in this stretch, not just background noise.
What to watch as the window opens
The first marker is the calendar itself. The seasonal window kicks off on Mar 18 and runs for 49 trading days into early May, a period that often coincides with renewed debate over drug pricing, Medicare reimbursement, and broader healthcare spending. Traders will be watching whether XLV can hold near the top of its 52-week range as that stretch begins, or whether early weakness confirms the historical pattern of midterm-year giveback.
Second, policy headlines around big pharma and managed care will matter more than usual. Any follow-through on Trump’s ultimatum to big pharma, or fresh proposals that target pricing power, could amplify the sector’s sensitivity in a window that has already leaned lower in past midterm cycles.[1] Conversely, signs of compromise or delay could blunt the seasonal tendency, especially if earnings and guidance from major healthcare constituents remain solid.
Third, watch how quickly any pullbacks develop relative to the historical template. In prior midterm years, XLV has often chopped or even pushed slightly higher before rolling over, with maximum adverse moves against the short side reaching 4% to 7% before the trade direction reasserted itself. If the ETF sells off sharply early in the window without a countertrend bounce, that would mark a departure from the typical path and could signal that positioning is lighter than in past cycles.
Finally, volume and cross-asset flows will be key tells. A sector that has rallied roughly 25% off its lows can see fast air pockets if investors decide to rotate toward other parts of the market.[8] If weakness in XLV during the window comes with rising volume and broad-based selling across pharmaceuticals, biotech, and managed care, it would look more like a classic midterm-year shakeout. If dips are shallow and quickly bought, the market may be signaling that this time, the seasonal pattern is running into a stronger fundamental floor.
Sources
- Trump’s ultimatum to big pharma (source_id 1, date not specified).
- Healthcare sector rally and overbought conditions in XLV (source_id 8, date not specified).