XLV’s 25% Breakout Leaves S&P 500 Healthcare Sector SPDR Extended as Midterm Window Nears
S&P 500 Healthcare Sector SPDR has been leading the market higher, but an approaching midterm-election seasonal window with a perfect short record flags a potential air pocket for the sector.

Key takeaways
- A 49-day midterm-election-year window for S&P 500 Healthcare Sector SPDR starting Mar 18 has produced 6 winners and 0 losers for short trades across the last six cycles.
- Average profit in those winning years is 3.9%, with a cumulative 25% gain for the short side and an annualized return of 3.89% over the sample.
- The pattern’s TradeWave Ratio of 4.66 suggests price has typically traveled meaningfully in the trade direction within the window, beyond just the final close.
- Intraperiod swings have been uncomfortable at times, with worst drawdowns inside the window reaching between roughly 4% and 7% before trades finished in the green.
- The setup appears just as XLV has broken out to lead the S&P 500 over one- and three-month horizons, raising the risk of a mid-cycle shakeout for a crowded sector.
According to historical data from TradeWave.ai, this specific slice of the midterm-election calendar has behaved very differently from an average spring for XLV. The next section walks through what that pattern has looked like in prior cycles and how it frames the coming weeks.
Seasonal window
The seasonal window beginning Mar 18 and running 49 trading days has produced profitable short trades in S&P 500 Healthcare Sector SPDR in all 6 of the last midterm election years, averaging 3.9% gains for the bears. That stretch arrives with XLV trading near its 52-week high of 160.59 after a strong breakout from its August low, leaving the fund looking extended after a roughly 25% rebound in less than a year.[1]
Grouping the data by the presidential election cycle matters here because healthcare policy, reimbursement rules and drug-pricing rhetoric tend to follow a four-year rhythm. Midterm years often bring legislative skirmishes and budget fights that hit managed care, hospitals and pharma at the same time, which can translate into sector-specific volatility even when the broader market trend is intact.
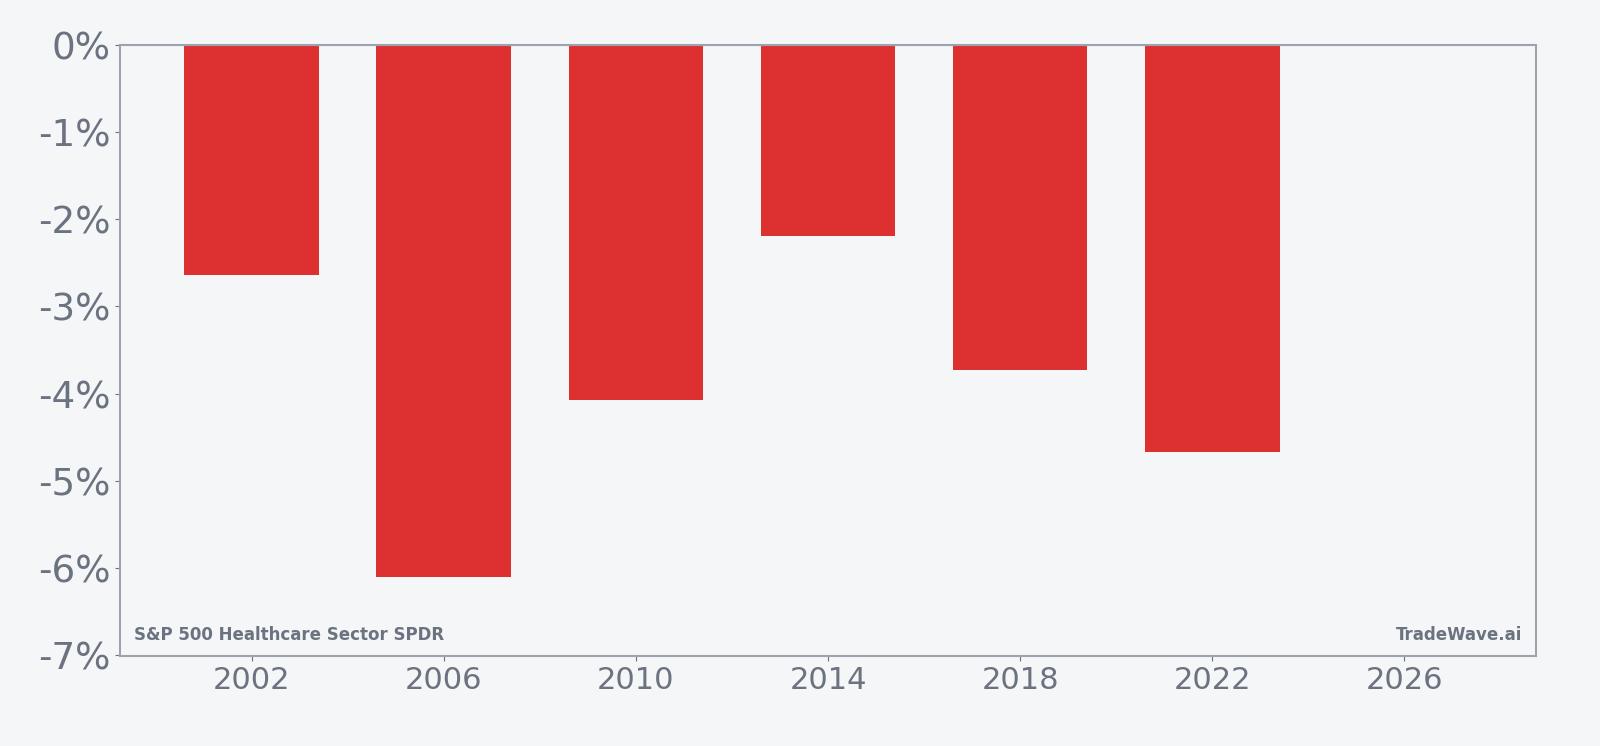
In this pattern, the trade direction is explicitly short. Every one of the six historical windows from 2002 through 2022 finished with XLV lower at the end of the 49 days, which is favorable for a short setup and unfavorable for long-only holders. The average winner gained 3.9% for the short side, and because there were no losing years in the sample, the all-years average lines up with that same 3.9% figure.
The per-year breakdown shows how consistent that behavior has been. In 2006, XLV fell 6.1% over the window, the largest net move in the sample, while 2014 was the mildest at a 2.19% decline. The other years, including 2010, 2018 and 2022, clustered in a fairly tight band between roughly 3.7% and 4.7% downside, which is unusual uniformity for a sector ETF that normally trades with a mix of idiosyncratic and macro drivers.
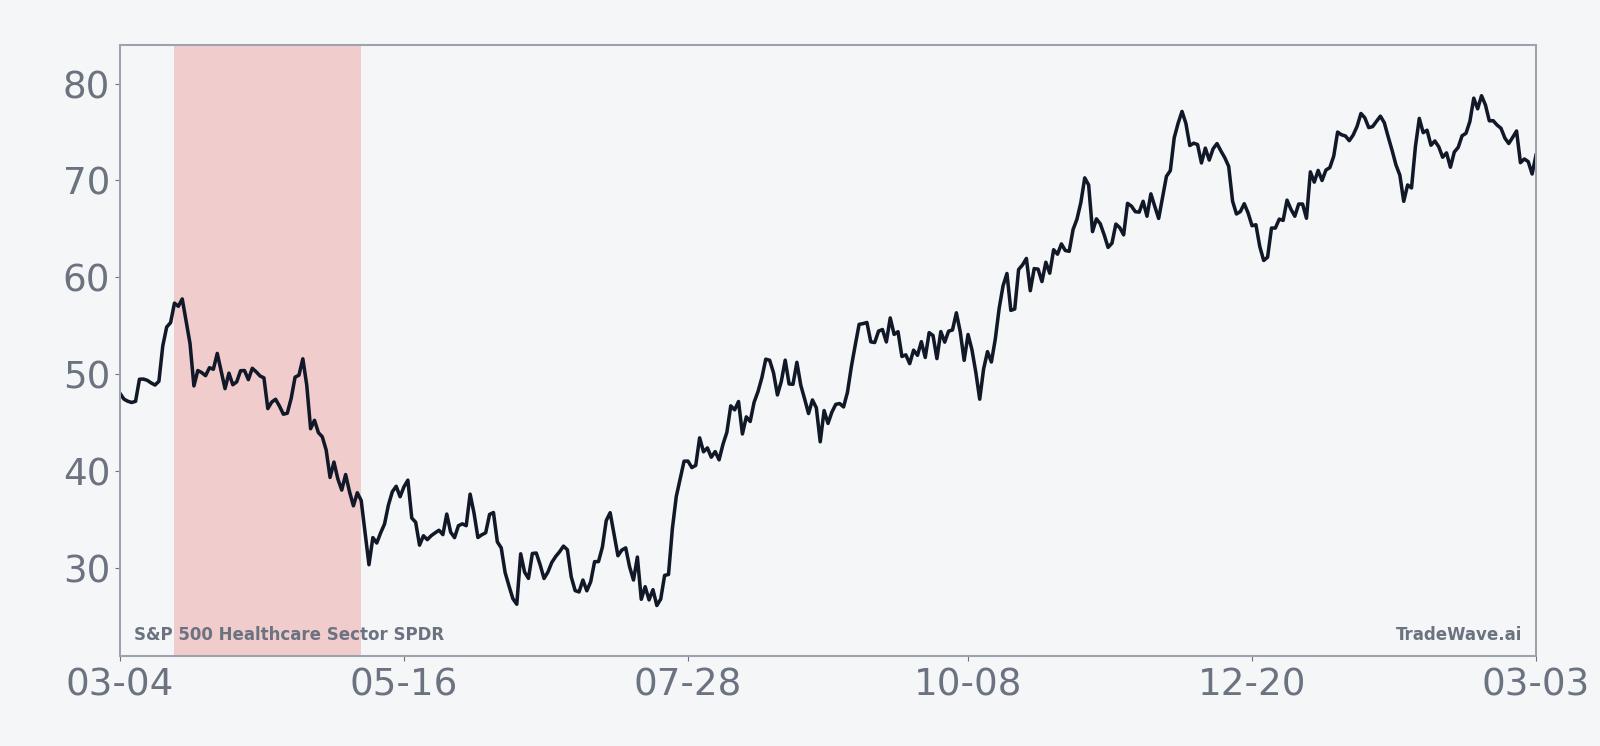
The historical average path in the trend chart tilts lower fairly steadily rather than collapsing in a single air pocket. That suggests prior midterm-year windows have tended to grind against longs over several weeks, with rallies failing rather than a one-day shock doing all the work.
The combined net, maximum favorable move and maximum adverse move bars show how much XLV has typically swung inside the window before settling at the final result.
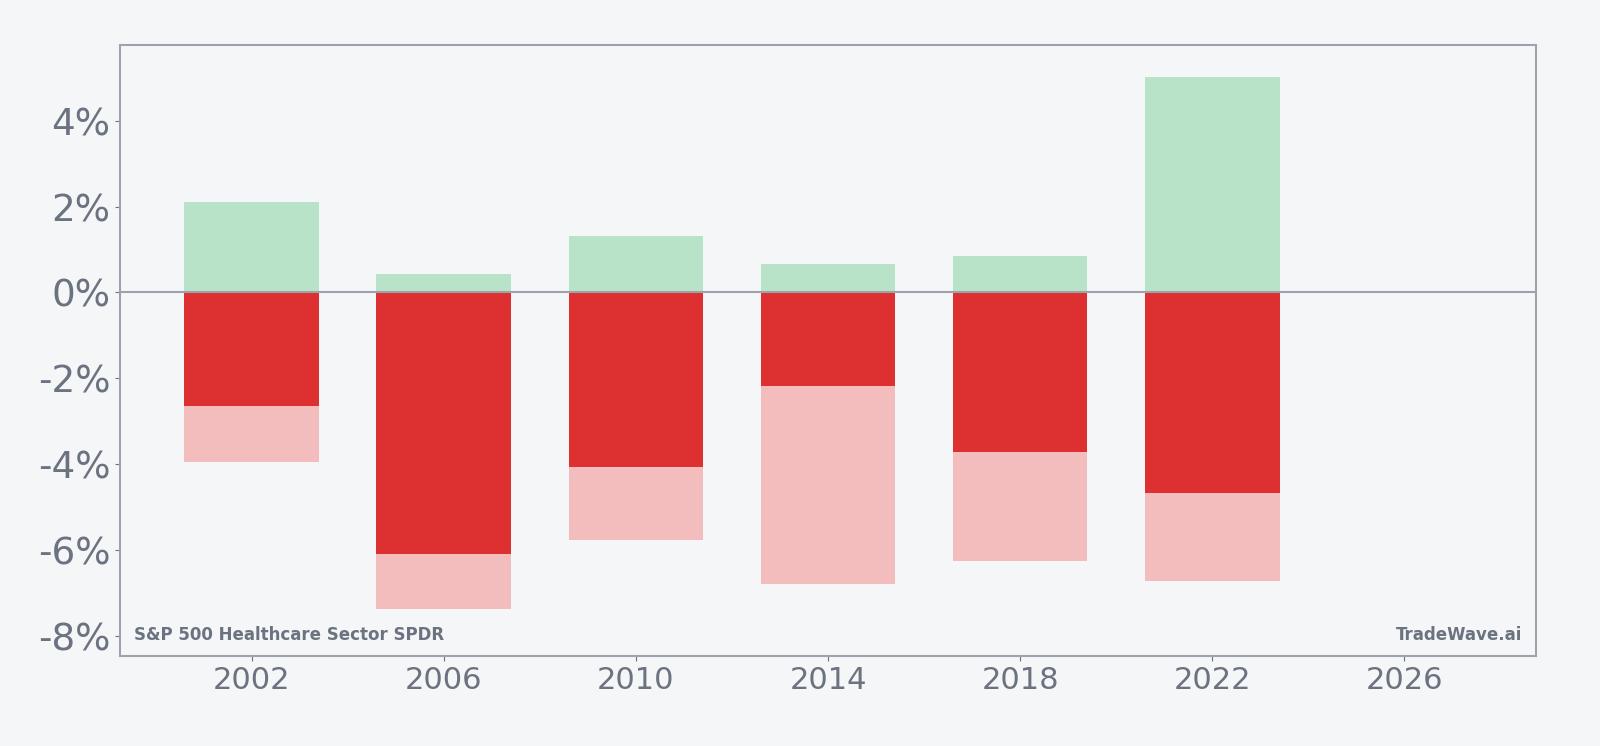
The MFE/MAE profile shows that even in winning short years, XLV has often pushed against the trade before rolling over. Maximum adverse moves inside the window ranged from about 3.95% to 7.38% against the short, while maximum favorable excursions sometimes extended beyond the final net decline, which is consistent with a choppy but ultimately downward bias.
History does not guarantee future results; adverse excursions can be large even in winning windows, and past midterm-year behavior may not repeat.
Price and near-term drivers
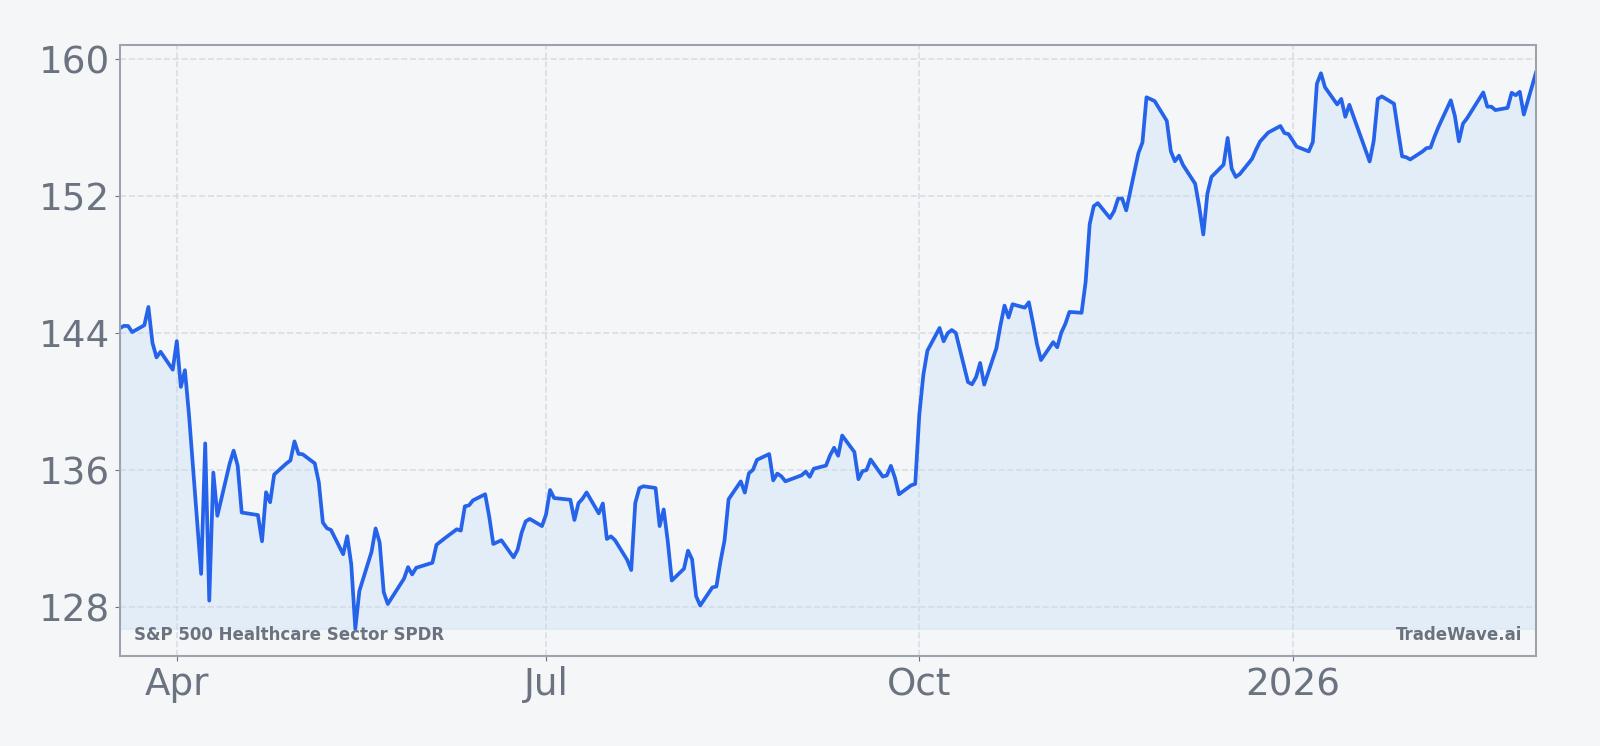
XLV has been in breakout mode, leading the S&P 500 over the past one and three months and climbing roughly 2.02% in the last month alone.[1] The fund has surged about 25% off its August low, a move that technicians describe as a textbook breakout that leaves healthcare looking extended and, by some measures, overbought.[1]
That strength has come as investors rotate back into defensive growth sectors after a choppy stretch for cyclicals. Healthcare’s mix of large-cap pharma, managed care and medical devices has offered a blend of earnings visibility and balance-sheet strength that screens well against a backdrop of lingering inflation worries and uneven global growth.[1]
Macro-wise, XLV’s leadership has coincided with a broader resumption of its long-term uptrend, even as the wider market has wrestled with rate expectations and patchy earnings breadth.[1] Sector strategists have pointed to healthcare’s role as a ballast in portfolios, especially when investors are reluctant to abandon equities outright but want to dial back exposure to more economically sensitive groups.[1]
At the same time, healthcare headlines have kept the sector in the news flow, from drug-pricing debates to reimbursement changes and regulatory scrutiny of high-profile therapies.[2] Those storylines tend to intensify as Washington moves deeper into the midterm-election year, which is exactly the phase the seasonal pattern isolates.
The chart below situates the latest move in its recent multi-month context.
Election-cycle context and what to watch
Calendar-wise, the market is in the midterm election year, and this XLV pattern specifically looks at the last six midterm cycles. That framing matters because healthcare policy risk is rarely linear; it tends to spike around budget negotiations, committee hearings and campaign rhetoric that cluster in the middle of the presidential term.
For investors who have ridden the recent healthcare rally, the key question is how XLV behaves once the Mar 18 window opens. A repeat of prior cycles would look like a sector that struggles to make new highs, sees rallies fade and ultimately finishes the 49-day stretch lower, even if the broader market holds up. A clear break from that script would be XLV grinding higher through the window with shallow pullbacks and limited intraperiod downside.
Three things to monitor as the window approaches. First, watch whether XLV can hold above its recent breakout zone on any pullbacks; repeated failures there would rhyme with the historical pattern of rallies stalling out. Second, track sector news flow around drug pricing, Medicare reimbursement and regulatory actions, which often act as catalysts for the swings captured in prior midterm-year windows. Third, pay attention to volume and leadership within the ETF: if mega-cap pharma and managed care names start to lag while the index grinds sideways or lower, that would be consistent with the kind of broad-based softening seen in earlier cycles.
Put together, the message is straightforward. XLV is entering a midterm-election spring with a strong recent uptrend and a seasonal record that has favored shorts in six straight cycles. The next 49 trading days after Mar 18 will show whether this year’s healthcare rally can shrug off that history or whether the sector once again uses this window to reset expectations.
Sources
- Health care sector rally and XLV breakout context (source_id 1, date not provided).
- Healthcare headlines and XLV’s role in sector news (source_id 2, date not provided).