Fed Rate Cut Bets Offer Cushion for Dow Industrials SPDR (DIA) After Jobs Shock
Dow Industrials SPDR is moving through a long seasonal stretch that has delivered consistent double-digit gains over the past decade, even as blue-chip sentiment adjusts to shifting economic and policy signals.

Key takeaways
- DIA is in a 276-day seasonal window starting Mar 1 that has historically been strongly bullish for the ETF.
- Across the past 10 years, this window was profitable in 100% of cases, with 10 winners and 0 losers.
- Average profit in winning years was 11.54%, with a cumulative gain of 196% over the sample.
- The pattern’s Sharpe ratio of 2.06 and TradeWave Ratio of 3.0 point to favorable risk-adjusted and directional behavior.
- Intraperiod swings have included deep drawdowns in some years, highlighting that adverse moves can be significant even in an overall positive window.
- For investors using DIA as a proxy for the Dow, this seasonal backdrop adds context to blue-chip exposure through year-end.
According to historical data from TradeWave.ai, the coming months for Dow Industrials SPDR line up with one of its most consistently positive long-term seasonal regimes. The next section looks at how that pattern has behaved across the past decade and what it implies for the current backdrop.
Seasonal window
This seasonal window is currently underway, spanning 276 days, and has historically been a strong stretch for Dow Industrials SPDR. DIA last closed at 435.72, down 1.27% on the day, leaving the ETF’s year-to-date performance unclear from available data but placing it near the upper end of its multi-year range.[4] The combination of a long, positive seasonal tendency and a blue-chip benchmark trading near prior highs gives investors a data-driven backdrop for thinking about risk and opportunity through the rest of the year.
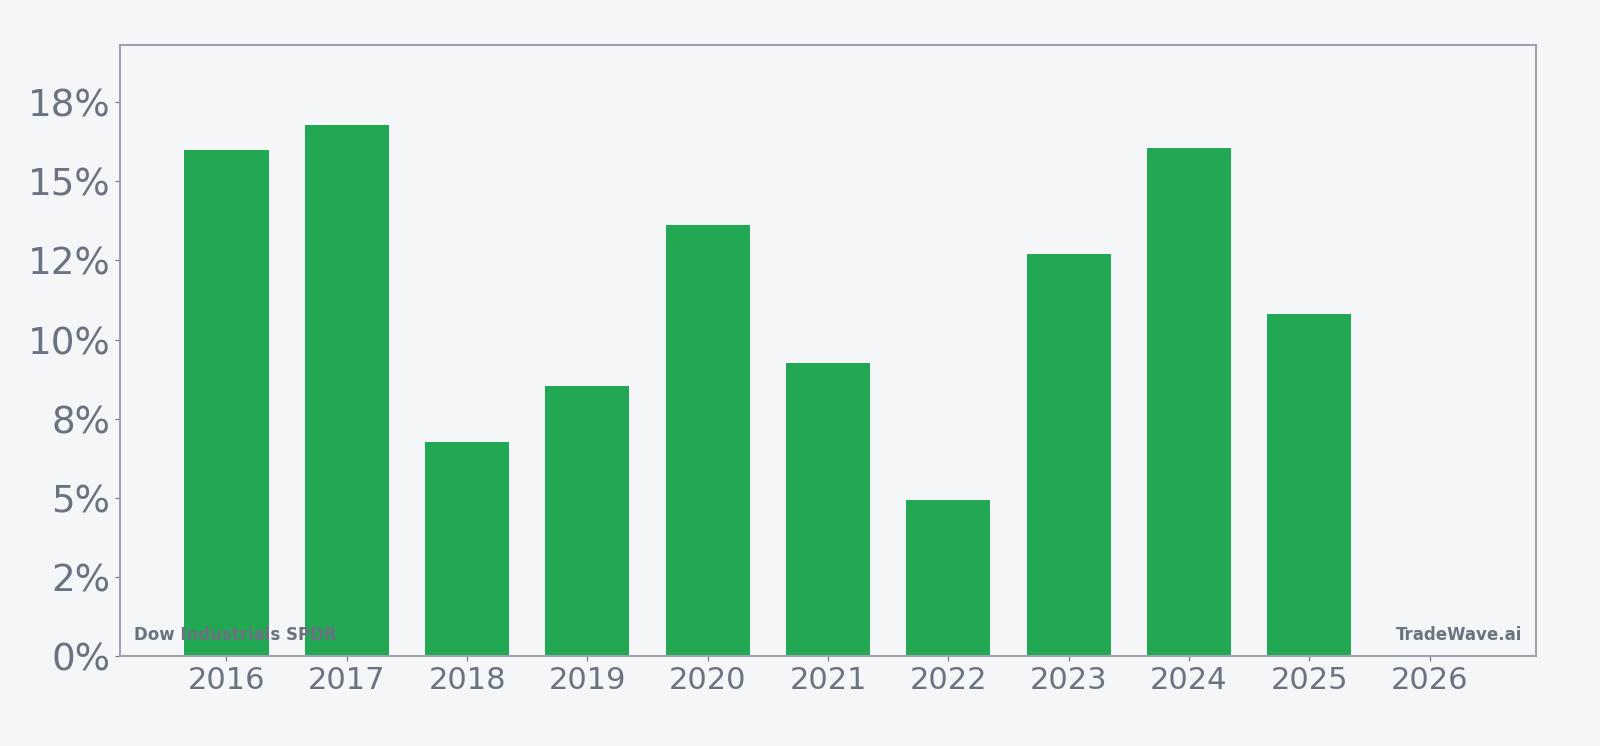
Historically, this long window has favored the long side for DIA, with every one of the past 10 years finishing higher over the period. Average profit across those winning years was 11.54%, with a median outcome of 11.76%, and the cumulative gain across all sample years totals 196%. The pattern’s Sharpe ratio of 2.06 suggests that, based on end-of-window results, returns have been relatively strong compared with the volatility of those outcomes.
Individual years show some dispersion around that average. The strongest gain in the sample came in 2017, when DIA rose 16.79% between the start and end of the window, closely followed by 2016 and 2024 with net returns of 15.99% and 16.04% respectively. The softest year was 2022, which still delivered a 4.93% gain over the same span, while 2018 and 2019 posted mid-single-digit to high-single-digit advances. Even in years with more modest net results, the pattern has not produced a losing outcome in this decade-long lookback.
Intraperiod swings, however, have been far from uniform. Maximum favorable moves, or the best point-to-peak rallies within the window, have often exceeded the final net gain, with years like 2021 showing a 17.1% peak run-up against a 9.25% final return. On the downside, maximum adverse moves, which capture the worst drawdown from the entry point, have ranged from relatively shallow pullbacks of less than 1% in 2016 to a sharp 31.6% drawdown in 2020 and a 15.06% setback in 2025. That mix of strong upside excursions and occasional deep pullbacks underscores that this has been a positive but sometimes volatile regime for blue-chip exposure.
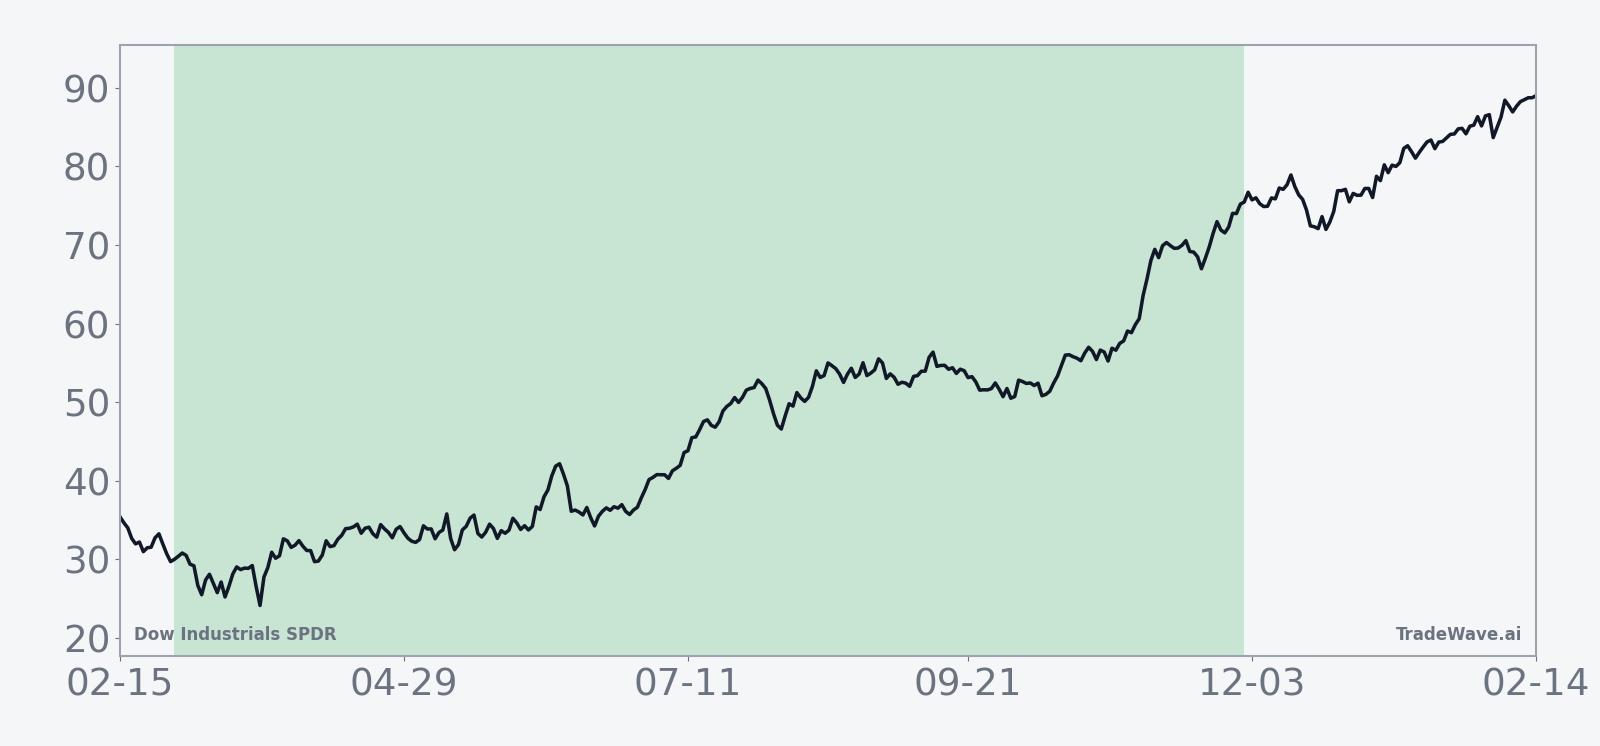
The 10-year average seasonal trend suggests that gains in this window tend to build gradually rather than in a single burst. The curve rises steadily across much of the period, with some mid-window choppiness but a tendency for the average path to finish the regime well above the starting point. That profile is consistent with a long directional bias where pullbacks have historically been absorbed over the course of the window.
Year-by-year bars that combine net results with peak rallies and worst drawdowns help clarify how that average has been built.
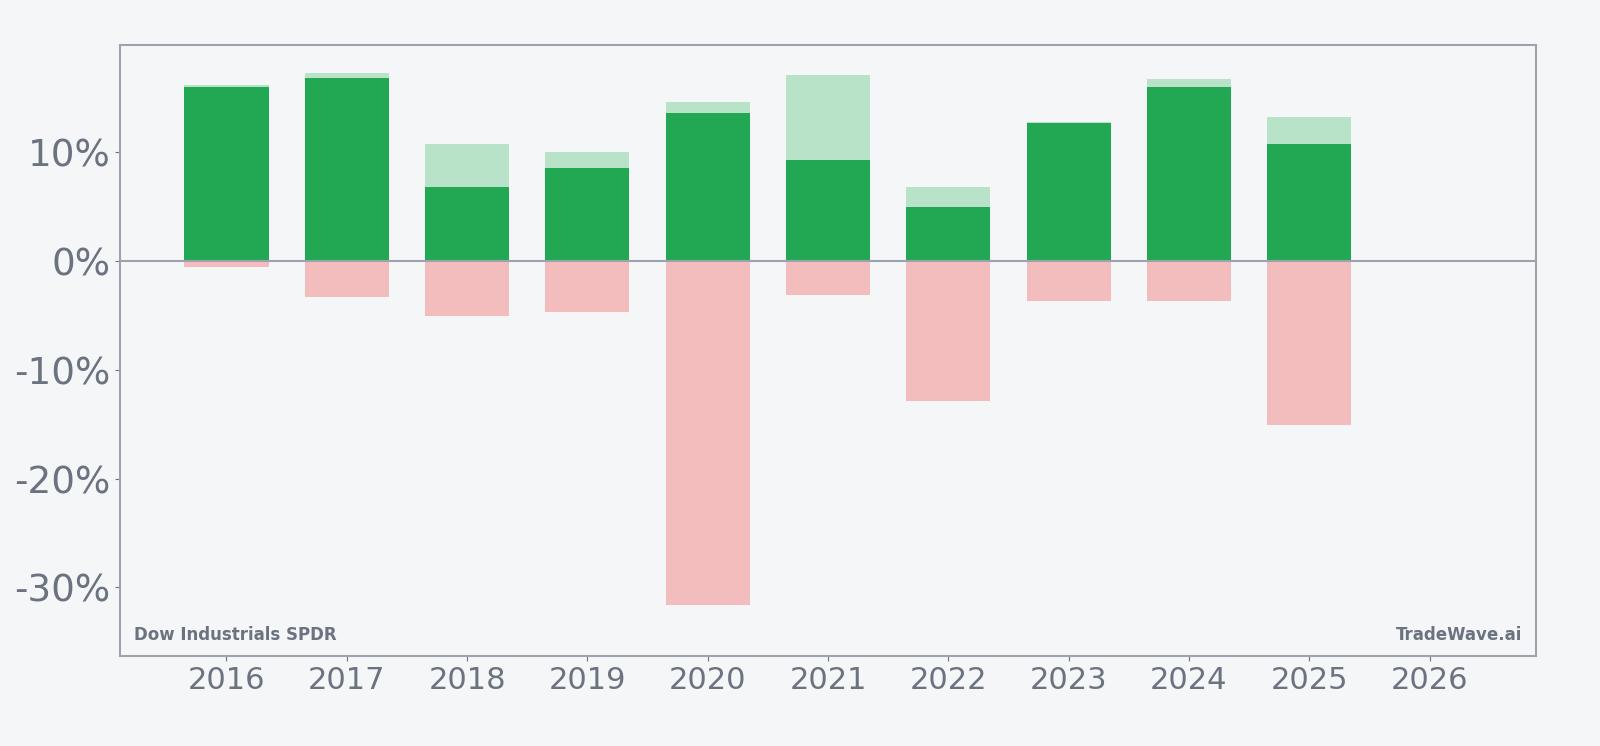
The combined net, peak-rally and worst-drawdown bars show a pattern where upside potential has often been substantial, but where some years required investors to sit through sizable interim losses to realize those gains. Years like 2020 and 2025 highlight that even within a historically favorable long window, shocks and corrections can be pronounced before the trend reasserts itself. Taken together, the historical pattern defines the quantitative seasonal backdrop for the current period.
History does not guarantee future results; adverse excursions can be large even in winning windows, and investors should treat this seasonal tendency as context rather than a forecast.
Price and near-term drivers
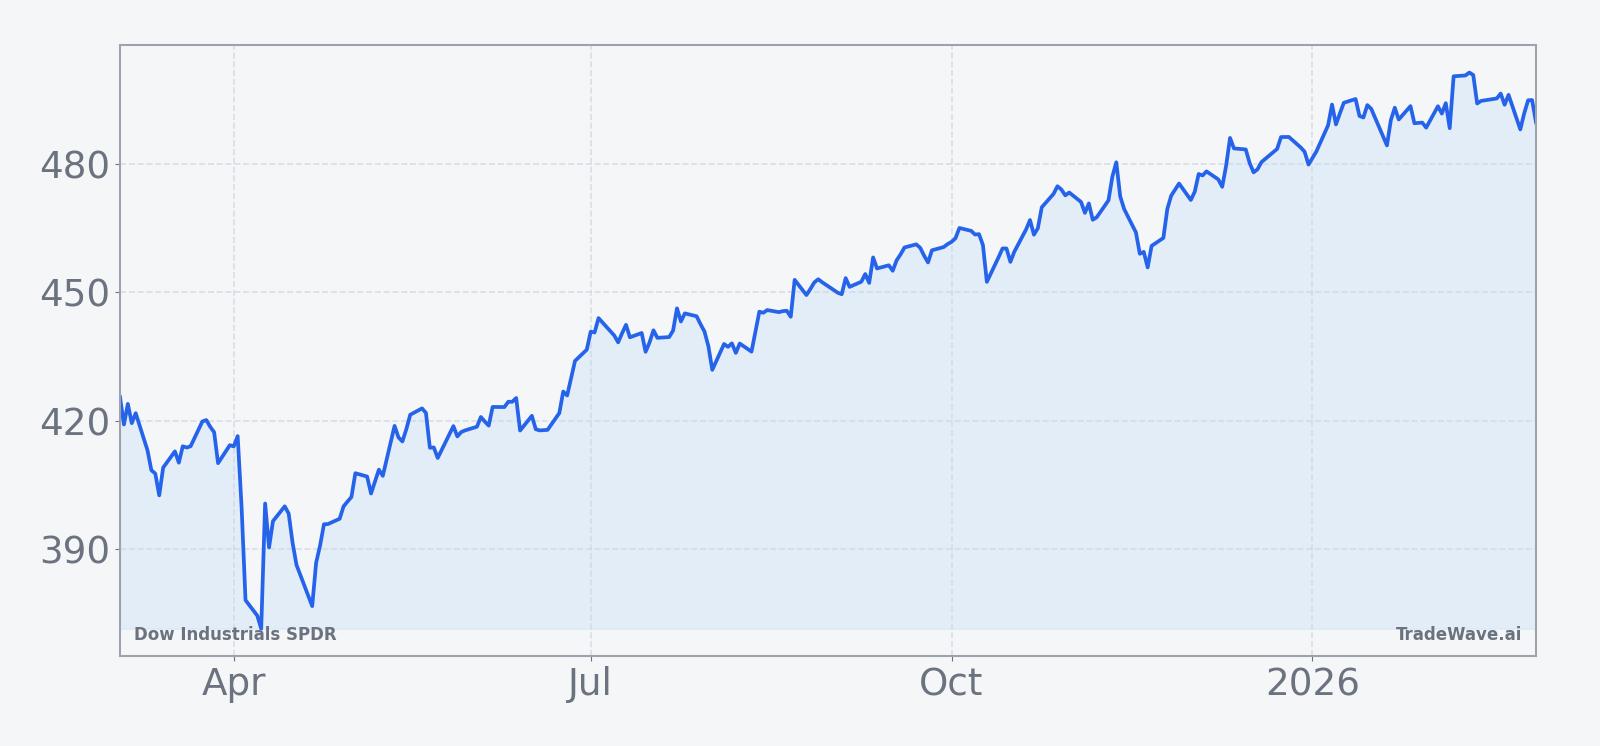
DIA’s latest close at 435.72 represents a 1.27% decline on the day, with limited visibility on its precise year-to-date gain or distance from 52-week extremes based on available data.[4] The move comes against a backdrop where the Dow and other major indices have already logged strong multi-year advances, leaving investors sensitive to signs that the blue-chip rally could be tiring or, alternatively, setting up for another leg higher.
Recent macro commentary has emphasized how quickly sentiment around large-cap U.S. equities can shift. In March 2025, one analysis argued that the prevailing equity environment did not resemble a classic recessionary bear market, even as volatility and policy uncertainty remained elevated.[5] By August 2025, another piece framed a shocking jobs miss as a potential turning point for the broader market, highlighting how labor data and growth concerns could weigh on benchmarks like DIA.[2] Later that year, strategists pointed to anticipated Federal Reserve rate cuts as a support for U.S. equities, while cautioning that gains might be more muted than in past easing cycles.[6]
Technical perspectives have also oscillated. In April 2025, market technicians urged caution around major U.S. indices, advising investors to “stay safe and react” as tariff headlines and macro crosscurrents drove choppy trading in stock index futures.[7] A few months later, chart-based work highlighted an unusual setup in which both the Dow and small caps appeared poised for breakouts at the same time, a configuration that can encourage barbell positioning between defensive blue chips and higher-beta names.[8] For DIA holders, those shifting narratives underscore how quickly the focus can move from downside protection to upside participation.
Macro commentary around growth and employment has been similarly divided. In October 2025, one analysis argued that the U.S. economy was already in recession, citing layoff figures and leading indicators as evidence of a more fragile backdrop for risk assets.[3] That view contrasted with earlier pieces that questioned whether equity weakness truly signaled a recessionary bear market, and with later arguments that policy support could extend the bull market, albeit at a slower pace.[5][6] For an ETF like DIA that concentrates on 30 large industrial and blue-chip names, these debates translate directly into questions about earnings durability, dividend resilience and the appetite for cyclical exposure.
The chart below situates the latest move in its recent multi-month context.
Macro and exposure context
DIA is designed to track the price and yield performance of the Dow Jones Industrial Average, giving investors a concentrated slice of U.S. large-cap industrial and blue-chip exposure. That focus means the ETF is particularly sensitive to shifts in expectations around manufacturing activity, global trade, capital spending and the health of multinational balance sheets. It also tends to be a reference point for investors seeking relatively lower-volatility equity exposure compared with broader benchmarks that carry heavier weights in high-growth technology names.
Macro themes flagged over the past year illustrate the crosscurrents facing that exposure. Commentary around a potential recession, driven by layoffs and weakening leading indicators, points to downside risk for cyclical earnings and capital investment.[3] At the same time, expectations for Fed rate cuts have been framed as a cushion for equity valuations, even if strategists warn that the magnitude of any rally could fall short of past easing cycles.[6] For DIA, which holds companies that often benefit from lower borrowing costs and improved business confidence, that mix of risk and support is central to the outlook.
Flows data specific to DIA are limited in the available context, but the ETF’s role as a core vehicle for Dow exposure means it often reflects broader asset-allocation decisions. When investors rotate toward perceived quality and dividend stability, DIA can attract inflows as a proxy for blue-chip safety. Conversely, when risk appetite swings toward higher-growth or small-cap segments, flows can favor other vehicles even if the Dow itself remains firm. The seasonal pattern described earlier provides an additional lens for interpreting those shifts: historically, this long window has coincided with periods when staying invested in DIA has been rewarded, despite intermittent volatility.
What to watch
For investors and traders using DIA as a benchmark or core holding, the key question for this seasonal window is whether the ETF continues to behave in line with its decade-long pattern of positive, if sometimes bumpy, performance. Historically, the 276-day stretch starting in early March has delivered consistent gains, but with occasional deep drawdowns that tested conviction before the trend reasserted itself. Monitoring how DIA reacts to macro data, policy headlines and shifts in sector leadership will be important in gauging whether this year tracks closer to the smoother paths of 2016 and 2017 or the more volatile profiles of 2020 and 2025.
Several concrete items bear watching. First, upcoming labor-market and growth data will shape the debate over whether the economy is slowing toward recession or merely cooling, a distinction that matters greatly for industrial and cyclical names inside DIA.[2][3] Second, communication from the Federal Reserve around the timing and pace of any rate cuts will influence both valuation multiples and investor appetite for blue-chip exposure.[6] Third, technical behavior around prior highs and recent support levels on the DIA price chart can offer clues about whether buyers are still willing to step in on pullbacks or whether rallies are starting to fade more quickly.
Finally, relative performance versus other major benchmarks will help clarify how investors are using DIA within portfolios. If the ETF continues to hold its ground or outperform during bouts of volatility, that would be consistent with its role as a defensive large-cap vehicle and with the historically favorable seasonal backdrop. If, instead, DIA lags meaningfully while risk-on segments lead, it could signal that the market is prioritizing growth and cyclicality over the more measured profile of the Dow, even within a window that has historically rewarded long exposure to this blue-chip basket. In all cases, the seasonal pattern should be treated as a framework for expectations rather than a script, with real-time price action and macro developments providing the final word.
Sources
- [1] Seeking Alpha, “Cantor Fitzgerald doesn’t believe in Wall Street’s recent reprieve rally,” Mar 21, 2025.
- [2] Seeking Alpha, “The Market Faces A Major Turning Point After Shocking Jobs Miss,” Aug 3, 2025.
- [3] Seeking Alpha, “The U.S. Is In Recession: 1 Million Layoffs In 2025 And LEI Data Says It All,” Oct 6, 2025.
- [4] Seeking Alpha, “Stock index futures pare losses as tariff driven volatility wavers,” Apr 7, 2025.
- [5] Seeking Alpha, “Part 1: This Is Not A Recessionary Bear Market,” Mar 9, 2025.
- [6] Seeking Alpha, “Fed rate cuts likely to support U.S. equities, but with muted gains: BMO’s Belski,” Sep 14, 2025.
- [7] Seeking Alpha, “S&P 500: Stay Safe And React - Week Starting 7th April (Technical Analysis),” Apr 6, 2025.
- [8] CNBC, “In unusual occurrence, both the Dow and small caps could be headed for a breakout, charts suggest,” Aug 13, 2025.