Intuit (INTU) Rises After Q2 Profit Jump, but Q3 Guidance Disappoints Wall Street
Intuit shares are trading near $409 after a profit beat but softer tax-season outlook, just as the stock heads toward a midterm-year seasonal stretch that has historically delivered solid gains with meaningful swings along the way.

Key takeaways
- Intuit is set to enter a historically strong long-side seasonal window tied to midterm election years, beginning Mar 14 and running for 157 trading days.
- Across the last 7 midterm election years, this window has been profitable in 100% of cases, with 7 winners and 0 losers and an average profit of 13.58%.
- The pattern’s Trade Direction is long, supported by a Sharpe ratio of 1.74 and a TradeWave Ratio of 1.85, indicating historically favorable risk-adjusted returns and meaningful travel in the trade direction.
- Individual years have seen sizable swings, with maximum favorable moves above 40% in the strongest case and adverse excursions approaching 20% in the weakest, underscoring intraperiod volatility.
- Today’s setup follows a higher second-quarter profit but softer guidance for the current tax season, which could interact with the upcoming seasonal tailwind as policy and rate expectations evolve.[6]
According to historical data from TradeWave.ai, Intuit’s behavior around midterm election years has followed a distinct seasonal pattern that differs from typical calendar-based views.
Seasonal window
This seasonal window begins on Mar 14, 2026 and spans 157 trading days. Historically, during this period in the last seven midterm election years, Intuit has shown a strong upside tendency for long positions, even as the broader policy backdrop and rate expectations have shifted from midterm uncertainty toward the pre-election year.
Grouping results by the presidential election cycle rather than by simple calendar years matters here because midterm years often feature a different mix of fiscal debate, regulatory noise and risk appetite than the years that follow. For a company tied to tax filing, small-business formation and consumer finances, that policy calendar can influence both sentiment and the pace at which investors are willing to pay for future growth.
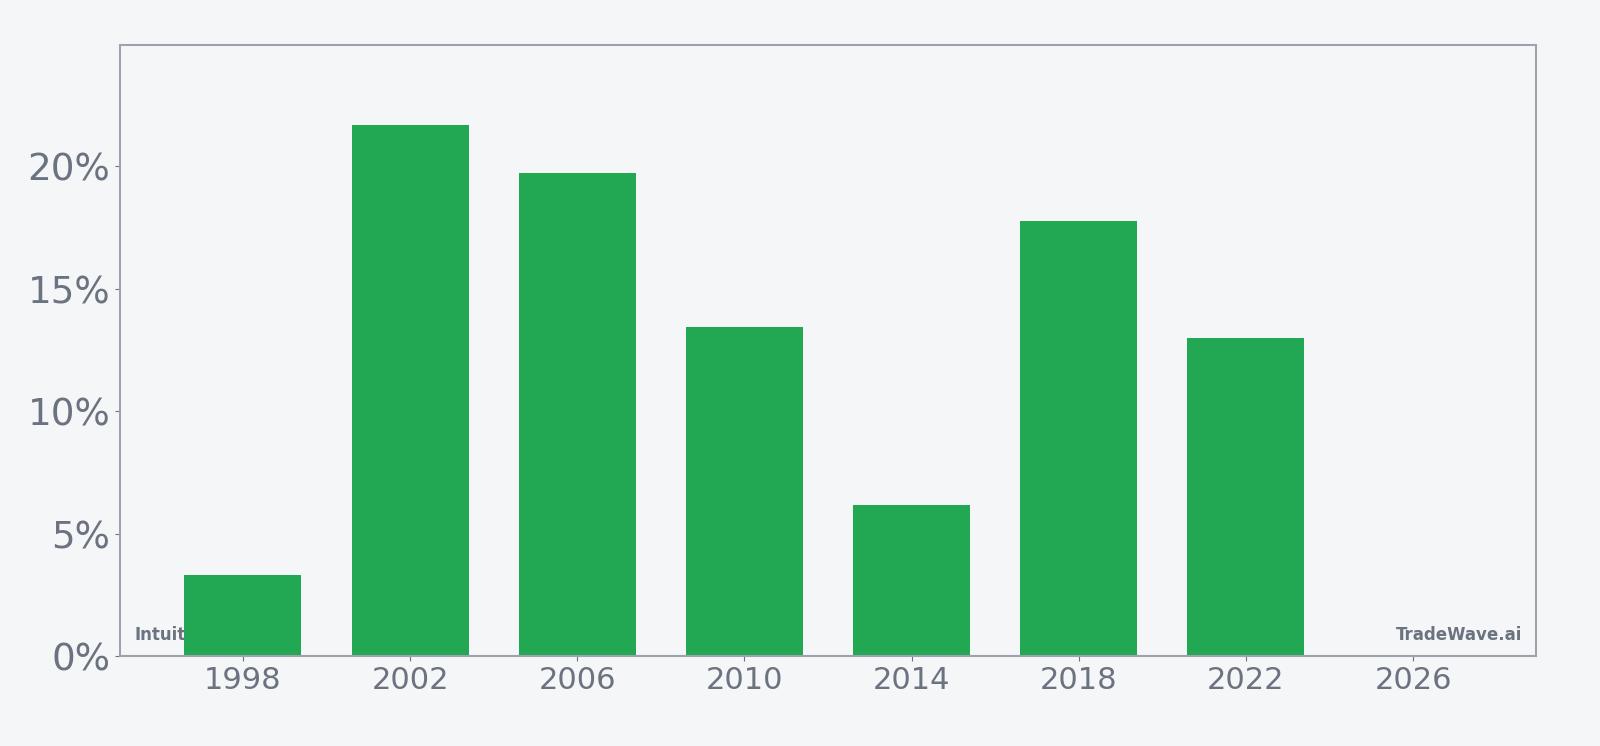
Across the seven midterm election years in this sample, the long-side pattern has been profitable every time, with 7 winners and 0 losers and an average profit of 13.58%. The median outcome of 13.45% is close to the average, which suggests that results have clustered around a mid-teens gain rather than being dominated by a single outlier year.
The strongest year in the set was 2002, when the window produced a net return of 21.69% with a maximum favorable move of 31.47% from the entry price, while the weakest net outcome was 3.34% in 1998 despite a maximum favorable excursion above 45% and an adverse move of 11.35% at one point. In 2022, the pattern still finished higher by 12.98%, but the worst intraperiod drawdown reached 19.97%, illustrating that even winning years have featured sizable downside swings before recovering.
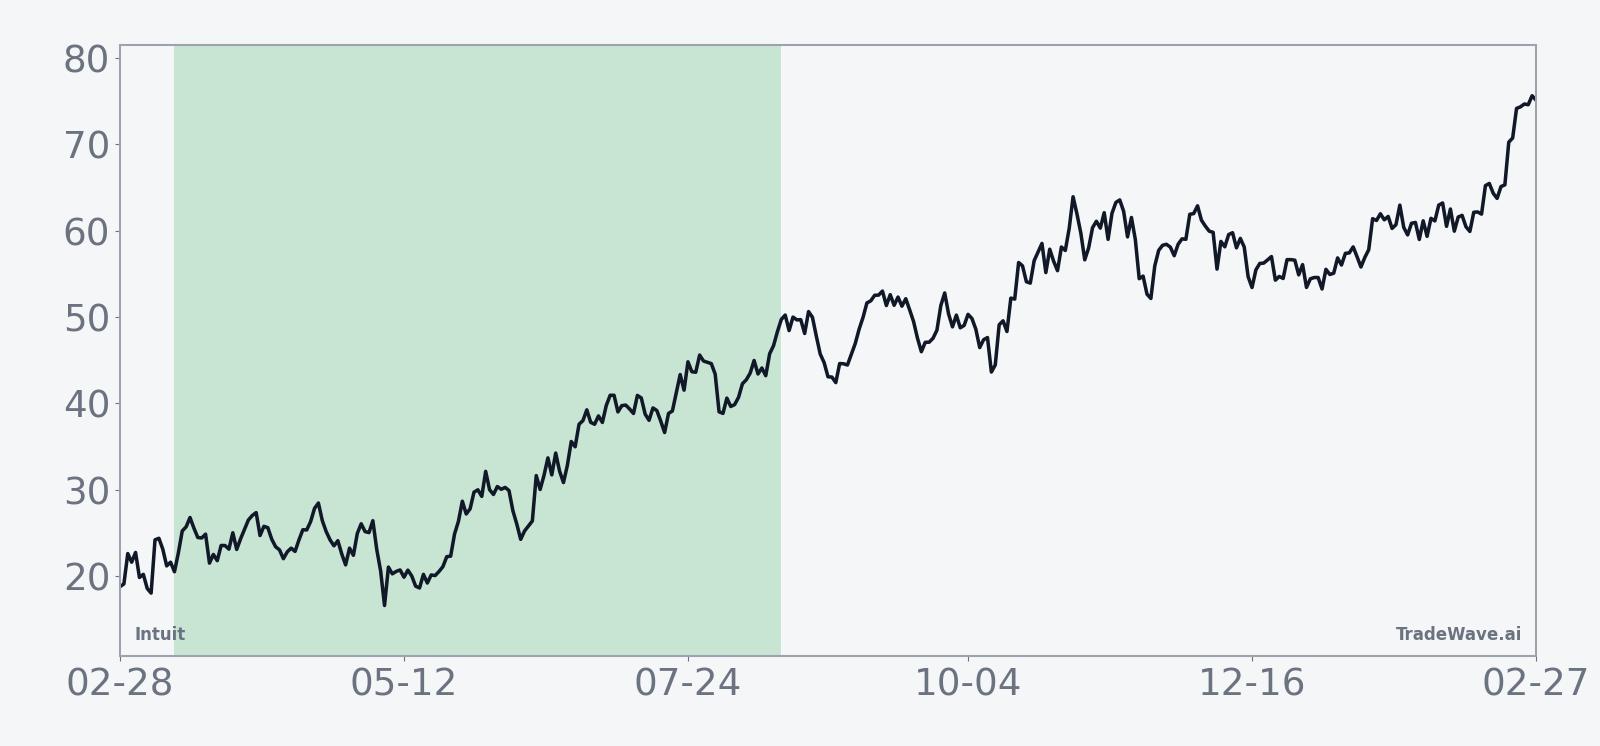
The historical seasonal trend chart points to a generally upward-sloping path across the window, with gains tending to build over time rather than arriving in a single short burst. There are periods of consolidation and pullback within the average line, but the overall profile is one of steady accumulation that aligns with the long trade direction.
A combined view of net returns and intraperiod swings highlights how upside and downside have interacted in prior cycles.
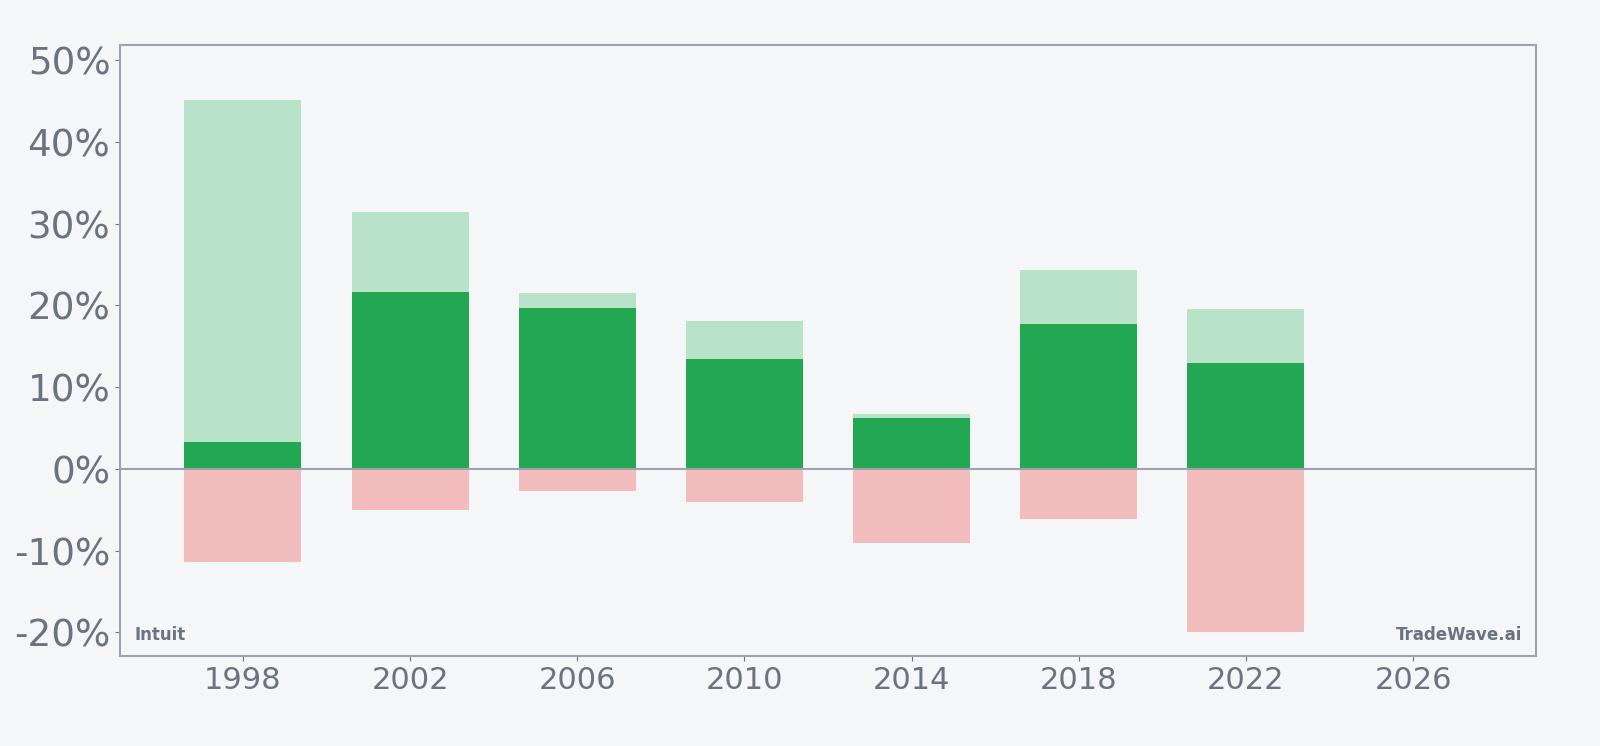
The stacked net, maximum favorable and maximum adverse bars show that while every year finished positive, the path was rarely smooth, with several cycles experiencing double-digit drawdowns before ending higher and others seeing large peak gains that later partially retraced. Taken together, the historical pattern defines the quantitative seasonal backdrop for the current period.
History does not guarantee future results, and adverse excursions can be large even in winning windows.
Price and near-term drivers
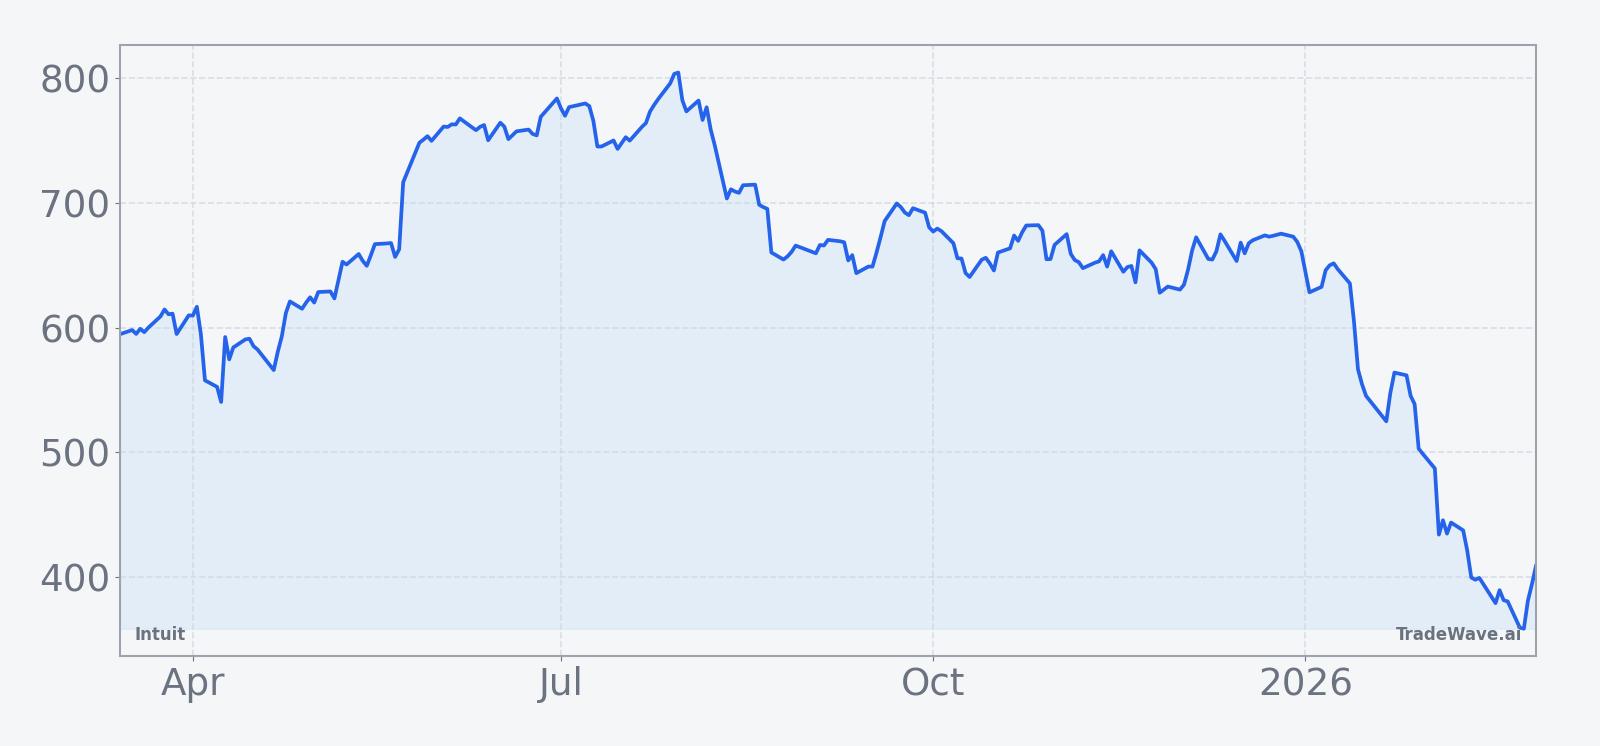
Intuit last traded at $409.03, up 3.7% on the day, after a stretch of trading that has left the stock without a clearly defined 52-week reference band in the available data. The latest move comes in the wake of second-quarter results that showed profit rising to $693 million from $471 million a year earlier, while guidance for the current quarter during peak tax season came in softer than Wall Street had expected.[6]
In its most recent update for the fiscal year, the company outlined revenue growth of 14% to 15% and an earnings range that sits close to, but not dramatically above, consensus estimates, suggesting that investors are weighing solid execution against a more measured outlook for the near term.[6] Earlier in the current cycle, Intuit had reported revenue and earnings ahead of expectations across several quarters, supported by demand for its tax, small-business and personal finance platforms, as well as ongoing investment in AI-powered tools.[1][2][3][5]
Analysts tracked by Scotiabank maintain an “Outperform” view on the stock with a consensus price target of $700, indicating that the sell-side still sees room for upside from current levels even after the recent rally.[4] That backdrop, combined with the upcoming seasonal window, leaves the stock at an intersection of fundamental optimism, valuation questions and historically supportive midterm-year behavior.
The chart below situates the latest move in its recent multi-month context.
Macro and policy backdrop
While the latest earnings report is the freshest catalyst for Intuit, the broader environment for tax and financial software is also shaped by policy and regulation that tend to come into sharper focus around midterm election years. Debates over tax thresholds, small-business incentives and digital compliance requirements can influence both customer demand and the competitive landscape for platforms like TurboTax and QuickBooks, even if the impact unfolds gradually rather than in a single quarter.[1][5]
In prior years, Intuit has navigated these shifts while leaning into AI and automation to deepen its value proposition, a theme that has featured prominently in management commentary about revenue growth and product strategy.[1][3] As the current cycle progresses from the early part of the midterm year toward the pre-election year, investors will be watching whether that combination of product momentum and policy sensitivity continues to support the stock in line with its historical seasonal pattern.
What to watch as the window opens
For the upcoming 157-day window that begins on Mar 14, traders and longer-term investors alike will be watching how Intuit trades around key calendar markers such as the remainder of the tax season, any updates to fiscal or regulatory proposals that touch on small businesses and personal finance, and the company’s next earnings checkpoints. Historically, this midterm-year stretch has seen the stock grind higher with mid-teens average gains, but with intraperiod drawdowns that can approach 20%, so the way Intuit behaves on pullbacks may be as informative as the size of any rallies.
On the fundamental side, the market’s reaction to the softer third-quarter profit outlook during peak tax season will remain a focal point, particularly if subsequent commentary from management or policymakers shifts expectations for consumer or small-business demand.[6] Price action around those updates, especially if it tests prior support zones on the chart, will help indicate whether the stock is tracking closer to the stronger historical years in the pattern or to the more volatile ones that saw deeper adverse moves before recovering.
Finally, investors will be monitoring how the broader technology and financial-software complex trades as the midterm year advances, since sector flows can amplify or dampen stock-specific seasonality. If Intuit’s share price responds to upcoming data and policy headlines with resilient buying on dips and a tendency to rebuild momentum after setbacks, that would be consistent with the historical midterm-year window; a sustained break of key levels on heavy volume, by contrast, would signal that this cycle may be diverging from the pattern despite its strong long-term track record.
Sources
- [1] Reuters, “Intuit expects quarterly revenue growth above estimates on strong financial tools demand,” Nov 20, 2025.
- [2] Reuters, “Intuit forecasts first-quarter revenue growth below estimates, shares fall,” Aug 21, 2025.
- [3] CNBC, “Intuit tops Wall Street estimates after tax season, issues strong guidance,” May 22, 2025.
- [4] Barchart.com, “Stocks Climb Before The Open On Optimism Over Trade Talks, Netflix Earnings On Tap,” Apr 17, 2025.
- [5] The Wall Street Journal, “Intuit Sales Jump, Expects Gains to Continue,” Aug 21, 2025.
- [6] The Wall Street Journal, “Intuit Logs Higher Second-Quarter Profit, Gives Soft Third-Quarter Outlook,” Feb 26, 2026.