Natural Gas (CME) (NG) Has Never Lost in This 12-Day Midterm Spring Stretch
Natural Gas (CME) is approaching a 12-day midterm-year window that has never produced a loss in the past eight cycles, just as prices sit far below last year’s peak and weather-driven swings stay intense.

Key takeaways
- A 12-day seasonal window for Natural Gas (CME) starting Mar 22 has been profitable in 100% of the last 8 midterm election years, with 8 winners and 0 losers.
- Average gain across those winning years is 5.67%, with cumulative returns of 54% and a long trade direction bias.
- The TradeWave Ratio of 2.19 signals that price has typically traveled meaningfully in the long direction within the window, even beyond the final close.
- Intraperiod swings have been sizable, with some years showing adverse moves near 8% before finishing higher, underscoring the need to respect drawdown risk.
- NG last settled at 3.182, well below its 52-week high of 7.827 and only modestly above the 52-week low of 2.622, after a volatile winter shaped by sharp weather shifts and choppy trading.[3][9]
- Traders watching policy, storage and weather into late March face a rare combination of strong historical seasonality and still-fragile spot pricing.
According to historical data from TradeWave.ai, this late-March stretch in midterm election years has behaved very differently from an average month on the natural-gas calendar, and the next iteration is now less than three weeks away.
Seasonal window
Natural Gas (CME) has risen in all 8 midterm election years during this 12-day window, averaging 5.67% gains. The next window begins on Mar 22, with NG currently trading at 3.182, far below last year’s 52-week high of 7.827 and only somewhat above the 52-week low of 2.622.[3][9]
The pattern groups the last eight midterm election years rather than consecutive calendar years, which matters for gas because policy, regulation and infrastructure spending often follow a four-year rhythm. Midterm years tend to be when Washington fights over budgets, energy permitting and environmental rules, all of which can shift expectations for future supply and demand in ways that show up in futures pricing.
In this specific window, the trade direction is long. Across the eight midterm-year samples, the Percent Profitable is 100%, with 8 winners and 0 losers. Average profit in those winning years is 5.67%, and the cumulative gain across all eight windows is 54%. That is an unusually clean track record for a commodity known for violent reversals.
The TradeWave Ratio (TWR) for this pattern is 2.19. TradeWave Ratio (TWR) reflects how far price typically travels in the trade direction within the window regardless of the final close. In plain English, NG has often moved substantially in the long direction at some point during these 12 days, even in years where the final gain was more modest.
Intraperiod swings have not been gentle. In 1994, for example, NG finished the window up 1.76% but suffered a worst drawdown of about 7.93% from the entry level before recovering. In 2010, the contract posted a 4.85% net gain while enduring an adverse move of roughly 6.59% along the way. Those years show that even “all green” windows can feel like a grind in real time.
The strongest outcome in the sample came in 2022, when NG rallied 10.83% during the window, with a best point-to-peak move of 13.41% and a relatively contained worst drawdown of 2.16%. On the softer side, 1994 and 2014 delivered smaller net gains of 1.76% and 2.06% respectively, but still finished positive despite mid-window dips.
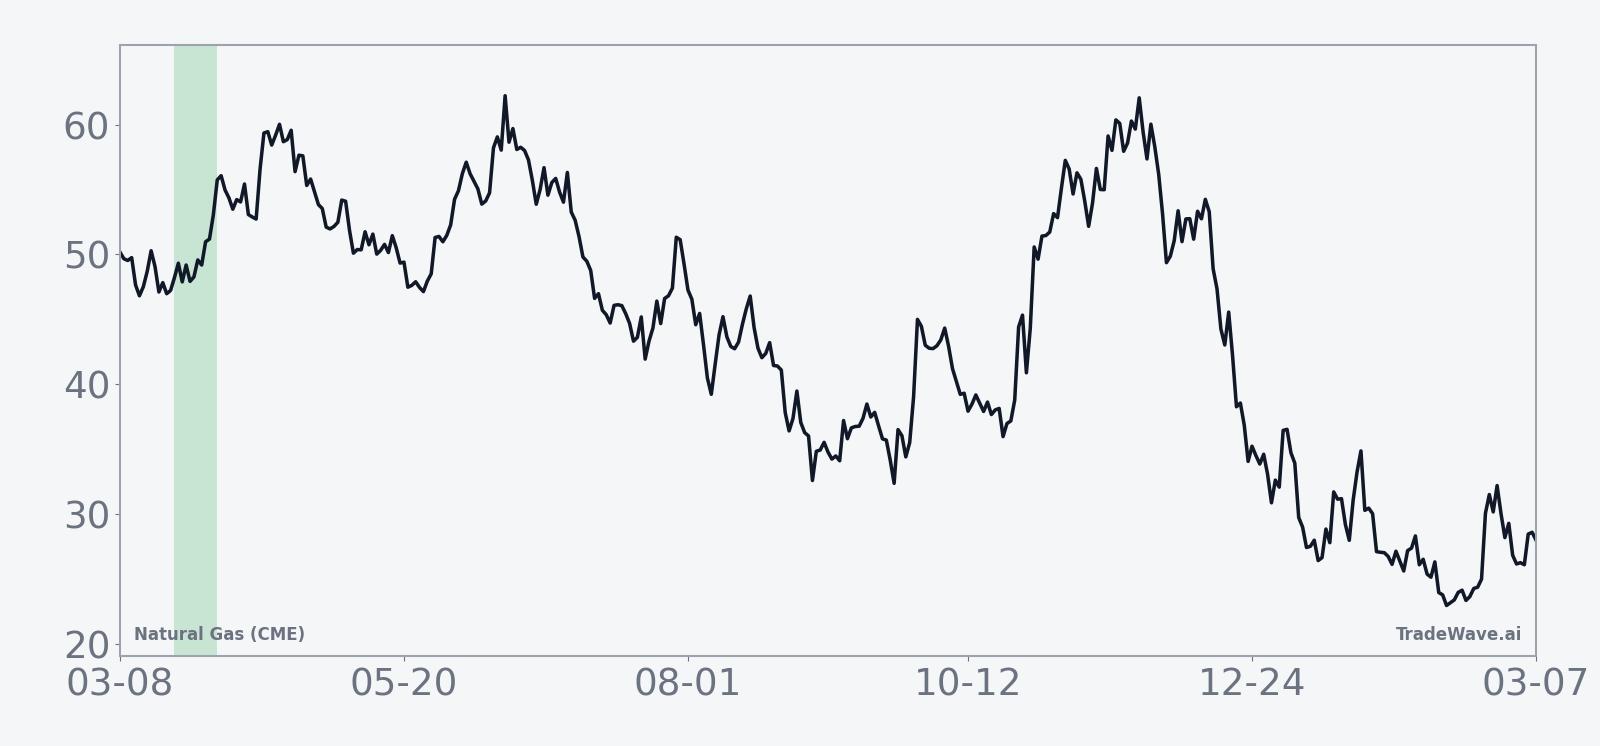
Looking at the historical seasonal trend chart for this window, the average path shows gains building steadily rather than spiking on a single day. The typical pattern has NG firming early in the window, consolidating mid-period, then adding a final leg higher into the last few sessions. That shape suggests a tendency for rallies to persist rather than mean-revert immediately.
The cumulative return profile across the eight midterm-year samples reinforces that message. Instead of a jagged line that flips between gains and losses, the cumulative curve climbs in a relatively smooth fashion, with each new cycle adding to the stack of prior gains. For a notoriously volatile contract, that kind of clustering is unusual.
Year-by-year bars with both best and worst intraperiod moves show how that upside has come with sizable swings.
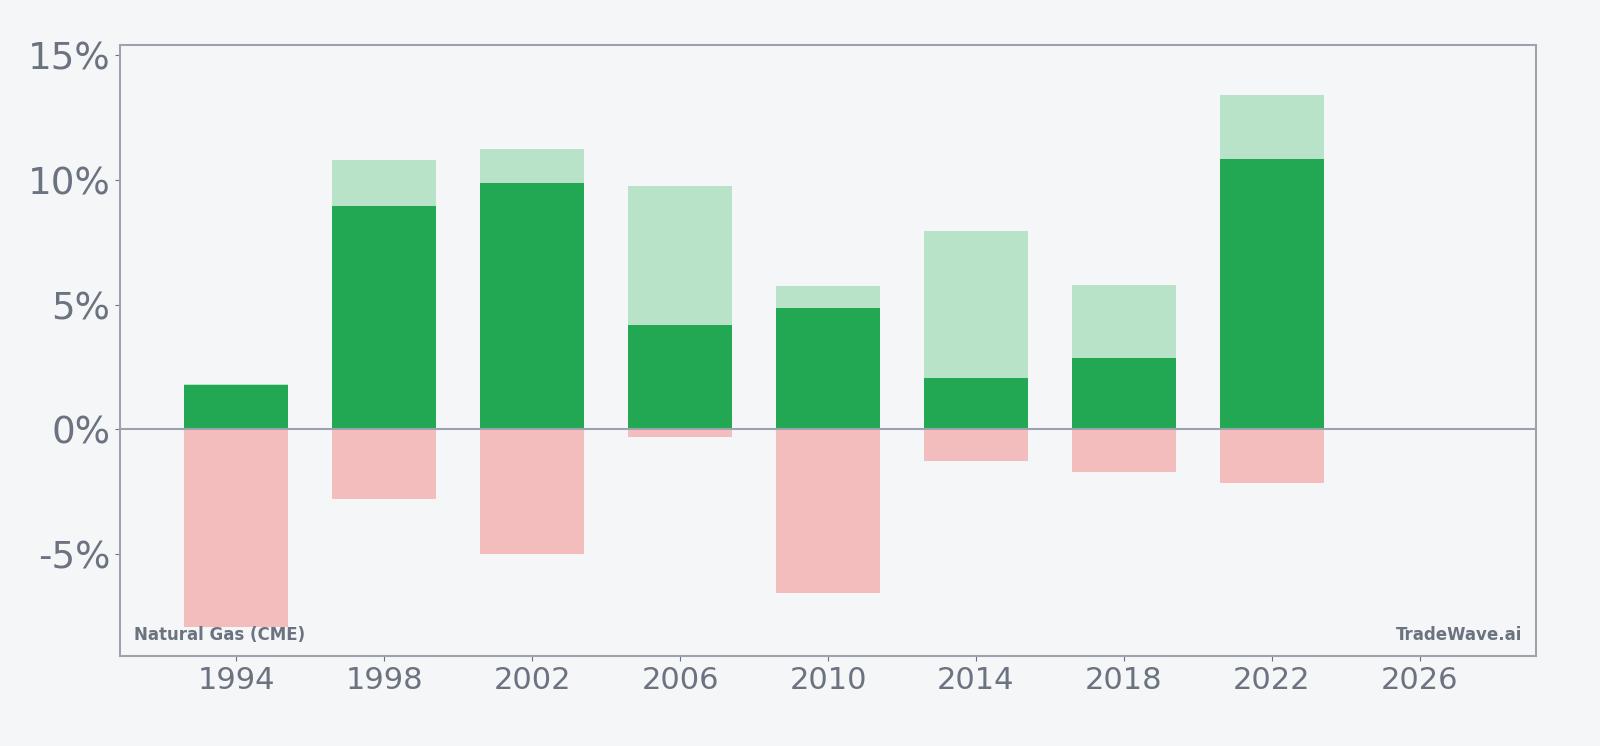
History does not guarantee future results, and even in winning years the worst intraperiod drawdowns (MAE) have been large enough to challenge risk limits.
Price and near-term drivers
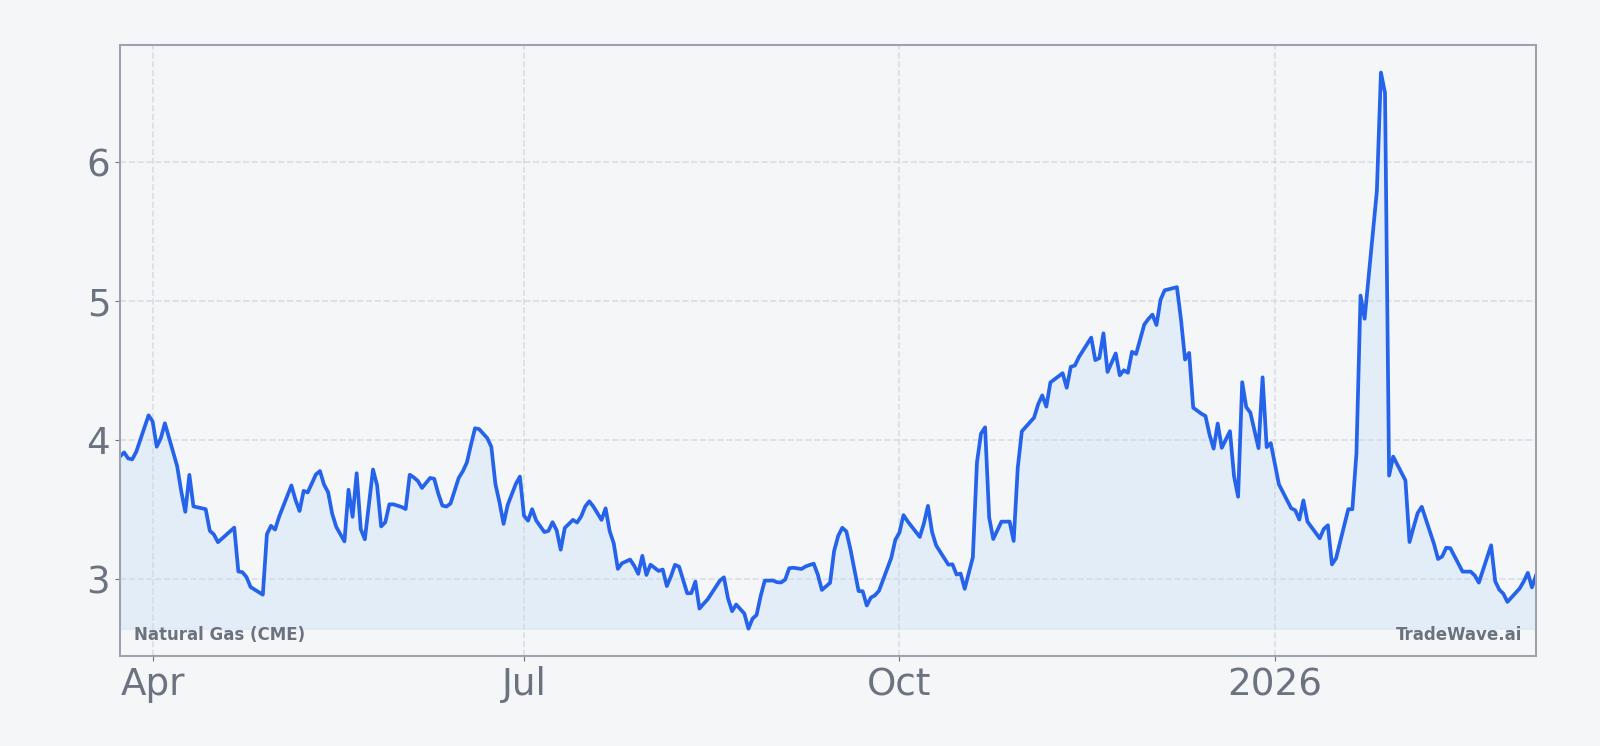
Natural gas futures last settled at 3.182, up 0.41% on the day, after a winter defined by violent weather swings and shifting demand expectations.[3][9] That leaves NG about 59.3% below its 52-week high of 7.827 and roughly 21.4% above the 52-week low of 2.622, a reminder of how far prices have fallen from last year’s extremes even after a cold-driven spike in January.[3]
On Jan 20, MarketWatch reported that natural-gas prices “soared” as bitter cold in the Northeast drove what one analyst called the toughest market test in a decade, with demand surging and traders scrambling to reassess storage paths into late winter.[3] That burst of strength followed a choppy second half of 2025, when high supply, storage surpluses and repeated warm-weather surprises kept a lid on rallies and pushed futures below key moving averages several times.[1][2][4][5][6][10]
More recently, The Wall Street Journal noted on Feb 19 that U.S. natural-gas futures slipped in choppy trade as a brief cold spell gave way to warmer forecasts, undercutting the support that had built up earlier in the month.[9] The 20-day average volume sits around 165,092 contracts, with the latest session’s 186,333 contracts showing that participation remains solid as traders weigh the end of heating season against still-uncertain storage balances.
Structurally, the macro backdrop has not changed: cold weather spikes demand and can quickly flip storage from surplus to deficit, while mild conditions and high inventories cap upside.[1][3] Reuters highlighted in Jul 2025 that even summer heat can drive sharp price moves as cooling demand jumps, reinforcing that weather remains the dominant short-term driver for NG across seasons.[8]
The chart below situates the latest move in its recent multi-month context.
Election cycle and policy backdrop
The upcoming window sits in the early part of a midterm election year, a phase that often brings noisy debates over energy policy, regulation and fiscal priorities. While natural gas is not a ballot issue in the way inflation or jobs might be, decisions around pipeline approvals, LNG export capacity and environmental standards can all influence long-term demand expectations and capital spending in the sector.
In prior midterm years, that policy noise has overlapped with the seasonal window that starts on Mar 22, creating a backdrop where weather, storage data and Washington headlines can collide. The historical pattern suggests that, despite the noise, NG has tended to grind higher across this specific 12-day stretch, even when the broader year was volatile.
What to watch into this window
For traders, the key into late March is how NG behaves as the market transitions from peak heating season toward shoulder months. Watch weekly storage reports for signs that winter withdrawals have meaningfully tightened inventories after last year’s surpluses, and track whether any lingering cold snaps extend demand longer than usual.
Price-wise, the band between roughly 2.62 and 3.76 matters. The lower end marks the 52-week low, while the 50-day moving average near 3.76 has acted as a rough ceiling in recent months. A push back toward that moving average as the seasonal window opens would signal that buyers are leaning into the historical pattern, while a failure to hold above the low-3s would show that supply and mild weather are still in control.
Macro headlines will also be in focus. Any shift in U.S. policy around LNG exports, drilling permits or environmental rules could alter the medium-term demand picture and either reinforce or blunt the usual midterm-year seasonal tailwind. At the same time, global growth signals and power-sector fuel switching will shape how much of any weather-driven demand spike actually sticks.
Finally, behavior inside the window itself will be telling. If NG starts the period with a sharp rally and manages to hold gains despite intraday pullbacks, that would rhyme with the historical pattern of steady, cumulative advances. A flat or heavy tape, especially if accompanied by soft storage draws and warm forecasts, would mark a clear break from the last eight midterm cycles and signal that fundamentals are overpowering the calendar.
Sources
- The Wall Street Journal, "Natural-Gas Futures Face Mild Temperatures," Oct 3, 2025.
- The Wall Street Journal, "U.S. Natural Gas Picks Up Ahead of Storage Data," Dec 10, 2025.
- MarketWatch, "Natural-gas prices soar as temperatures drop," Jan 20, 2026.
- The Wall Street Journal, "U.S. Natural Gas Futures Gain Ahead of Delayed Storage Data," Dec 29, 2025.
- The Wall Street Journal, "U.S. Natural Gas Extends Pullback on Shifting Weather Outlook," Dec 9, 2025.
- The Wall Street Journal, "U.S. Natural Gas Futures Extend Decline," Dec 12, 2025.
- Reuters, "US natgas prices gain over 2% on mid-July heat forecasts," Jul 2, 2025.
- The Wall Street Journal, "U.S. Natural Gas Futures Slip in Choppy Trade," Feb 19, 2026.
- The Wall Street Journal, "U.S. Natural Gas Futures Post Daily Gain, Weekly Loss," Dec 19, 2025.