Alcoa (AA) Has Rallied in 6 of 7 Midterm Spring Windows as a 28-Day Run Approaches
Alcoa is heading toward a historically strong 28-day midterm-year stretch just as the stock trades near a 52-week high and investors weigh how long the aluminum boom can last.

Key takeaways
- Alcoa’s upcoming 28-day window starting Mar 13 has been positive in 6 of the last 7 midterm election years, with a long trade direction.
- Winning years in this window have averaged gains of 7.6%, while including the lone losing year brings the all-years average to 6%.
- Today’s close at $60.38 leaves Alcoa about 11.7% below its 52-week high of $68.40, after a powerful multi-quarter run and modest pullback.
- Recent quarters delivered stronger revenue and profit on higher aluminum prices and better cost control, reinforcing the cyclical upswing in the business.[1][6]
- Intraperiod swings have been meaningful, with some years showing double-digit peak gains but also notable drawdowns before finishing higher.
- Traders watching this window should balance the bullish seasonal bias against commodity, tariff and energy-cost risks that can quickly change the narrative.
According to historical data from TradeWave.ai, this specific midterm-year stretch has behaved differently from a typical month for Alcoa, and the next iteration is about to open.
Seasonal window
Alcoa has risen in 6 of the last 7 midterm election years during this 28-day window, with winning years averaging gains of 7.6% and all years averaging 6%. The next window begins on Mar 13, with the stock finishing Friday at $60.38, about 11.7% below its 52-week high of $68.40 and still near the upper end of its one-year range. That combination of a strong historical pattern and a stock priced closer to the top of its recent band gives this midterm-year window more weight than a routine calendar quirk.
The pattern is built on the last seven midterm election years, a phase of the presidential cycle that often brings policy uncertainty, shifting fiscal priorities and choppier risk appetite. Grouping by this cycle matters for a cyclical name like Alcoa because aluminum demand and pricing are tightly linked to infrastructure spending, industrial activity and trade policy, all of which tend to move with the political calendar rather than in smooth year-to-year increments.
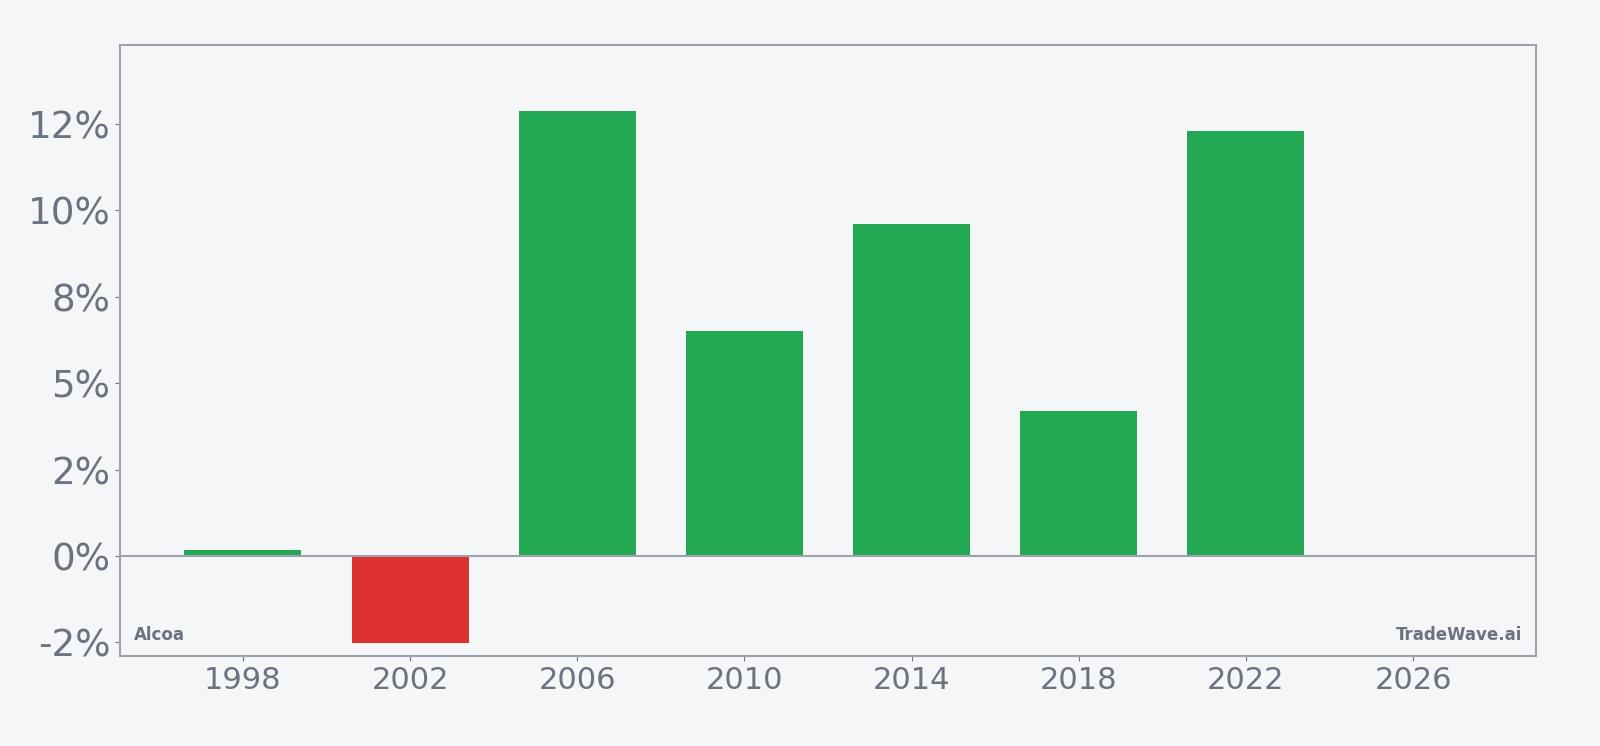
Historically, this 28-day stretch has favored long exposure. Six of seven midterm-year windows finished higher, while the lone losing year, 2002, saw a decline of 2.53%. The strongest outcome in the sample came in 2006, when Alcoa gained 12.86% from entry to exit, followed closely by 2022 with a 12.29% gain, both years that lined up with powerful commodity upswings.
The average winner gain of 7.6% compares with an all-years average of 6%, which reflects the drag from that single down year. Median profit of 6.51% sits close to those averages, suggesting the pattern is not just driven by one outlier spike. For a 28-day window, those are chunky moves, especially when they repeat across multiple cycles tied to the same point in the election calendar.
Intraperiod swings have been meaningful. Maximum favorable excursions, the best point-to-peak moves within the window, ranged from 3.0% in 2002 to 33.46% in 2022. Maximum adverse excursions, the worst drawdowns from entry, ran as deep as 10.09% in 2018, a year that still finished with a 4.18% gain. That profile shows a window where the stock has often dipped first before recovering, or at least forced traders to sit through sizable volatility on the way to a positive close.
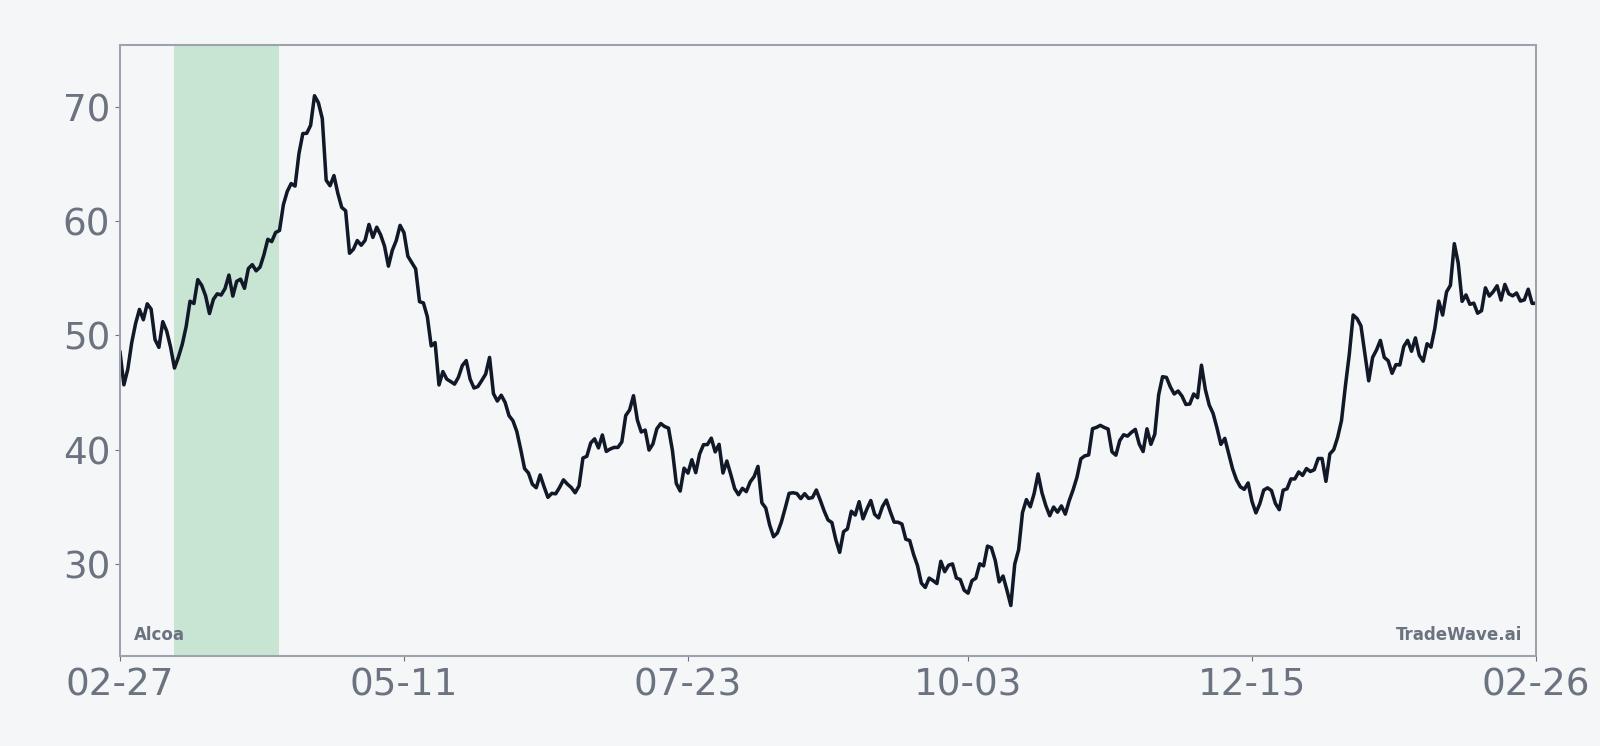
The historical seasonal trend chart for this window shows a tendency for gains to build through the middle of the period rather than in a straight line from day one. Early days can be choppy, with the average path bending higher as the window progresses, which fits the pattern of years like 2010 and 2014 where the stock’s best levels arrived later in the stretch.
Year-by-year bars that combine net results with peak run-ups and worst drawdowns show how often upside has outweighed intraperiod stress.

The stacked view of net results, maximum favorable moves and maximum adverse moves makes the trade-off clear. Years like 2006 and 2022 delivered double-digit gains with relatively contained downside, while 2018 paired a modest 4.18% net gain with a double-digit intraperiod drawdown. Add it up and the pattern is straightforward: this window has usually rewarded longs, but it has not been a smooth ride.
History does not guarantee future results, and even in winning years the worst intraperiod drawdowns (MAE) have been large enough to challenge risk limits.
Price and near-term drivers
Alcoa slipped 1.9% Friday to close at $60.38, extending a modest pullback from its 52-week high of $68.40 but leaving the stock still up sharply from last year’s lows. The shares trade with heavy volume near 7.3 million shares on a 20-day average, reflecting active positioning after a powerful multi-quarter run.
On Jan 30, Alcoa reported Q4 2025 revenue of $3.45 billion and profit of $226 million, or 85 cents per share, with adjusted earnings of $1.25 per share topping expectations and underscoring improved fundamentals.[1] The company’s recent performance has been driven by higher aluminum prices, better alumina and aluminum shipment volumes, and tighter cost control, which have combined to lift margins and cash flow.[5][6]
In Jan 2026, Forbes highlighted that Alcoa’s stock was up roughly 100% over the prior stretch, reflecting a sharp rerating as investors priced in stronger earnings power and operating leverage to aluminum prices.[5] In Nov 2025, another Forbes piece pointed to a roughly 40% surge over six months, with some profit-taking emerging after earlier earnings, a reminder that sharp rallies in cyclical names often invite fast reversals when sentiment cools.[3]
Macroeconomic and sector forces remain central to the story. Aluminum demand tied to electric vehicles, renewable energy and aerospace has been a tailwind, while tariffs and energy costs sit on the risk side of the ledger.[2][5] The Wall Street Journal reported in Jan 2026 that higher alumina and aluminum sales helped lift Alcoa’s profit, but also noted that tariff and cost pressures are an ongoing factor for the business.[6] For a stock that has already doubled off its lows, the next leg will likely depend on whether that favorable demand backdrop can offset any cooling in prices or new policy shocks.
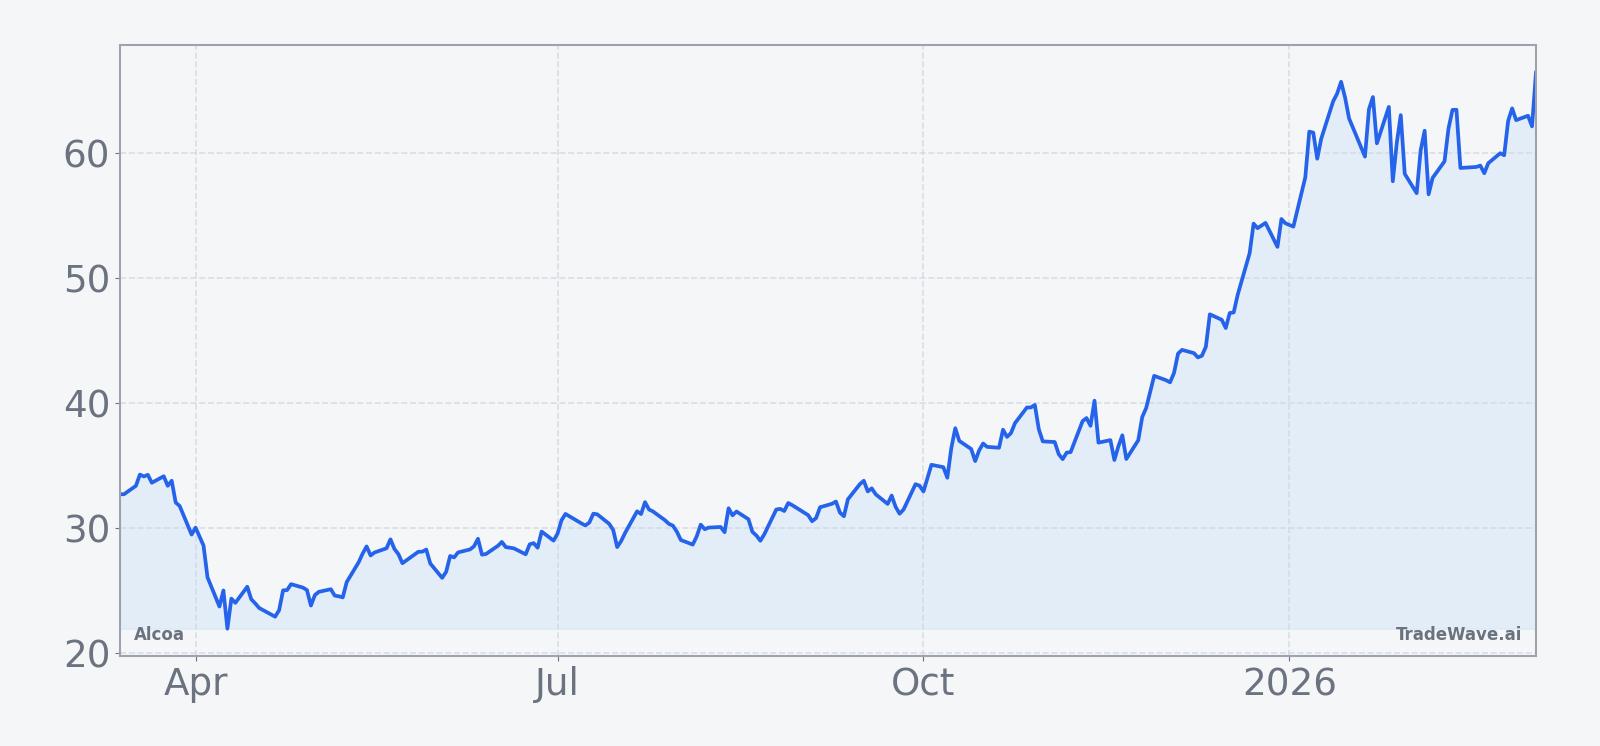
The chart below situates the latest pullback against Alcoa’s strong advance over the past year.
Macro, policy and the election cycle
The current calendar sits in the midterm election year, a phase that often brings more noise around trade, industrial policy and environmental regulation. For Alcoa, that mix matters. Aluminum pricing and demand are sensitive to infrastructure spending plans, clean-energy incentives and tariff decisions, all of which can shift as Congress and the administration jockey over priorities.
Forbes has noted that Alcoa’s path is shaped by aluminum demand, supply limitations and policy variables such as tariffs and energy costs, which can either amplify or blunt the benefit of strong end-market demand.[2][5] In the materials sector more broadly, improving cash flow and cost management have helped companies weather commodity swings, but the cycle remains exposed to macro shocks and policy surprises.[3][4]
That is why the midterm-year framing is more than a calendar curiosity. Historically, this phase has delivered a mix of volatility and opportunity for cyclical stocks. For Alcoa, the upcoming 28-day window has tended to line up with periods when policy debate is heating up but before the market fully prices the next year’s fiscal and regulatory stance. The seasonal record suggests that, in prior midterm years, that backdrop has more often coincided with upside than downside for the stock.
What to watch as the window opens
With the seasonal window set to start on Mar 13, traders will be watching how Alcoa behaves around a few key markers. First, price action relative to the recent high near $68.40 will matter. A push back toward that level early in the window would echo prior years where gains built through the middle of the period, while a break below recent support would signal that macro or policy headwinds are overpowering the historical pattern.
Second, aluminum-market headlines and macro data tied to industrial production, EV demand and renewable-energy buildout will be important context. Any signs of softening demand or renewed tariff friction could make the intraperiod drawdowns seen in past windows more likely to bite, even if the stock ultimately recovers by the end of the stretch.[2][5][6]
Third, earnings follow-through and commentary from management will remain in focus. The strong Q4 2025 report and upbeat narrative around operating leverage set a high bar.[1][6] If subsequent updates or industry data confirm that trend, the historical tendency for this window to favor longs will sit alongside a still-improving fundamental story. If not, the same volatility that has historically produced big upside swings could cut the other way.
Finally, watch how intraday ranges and volume evolve as the window progresses. Past midterm-year cycles have seen sizable maximum favorable and adverse moves inside the 28-day span, even when the final result was positive. If volatility picks up and pullbacks remain contained, that would rhyme with the pattern of choppy but ultimately constructive windows. A sharp break that fails to recover would mark a clear departure from the historical script.
Seasonality is not a trading plan on its own, but for a cyclical name like Alcoa, this midterm-year window offers a concrete historical backdrop. The next four weeks will show whether the stock can once again turn that backdrop into real gains.
Sources
- Forbes, "Inside Alcoa’s Latest Earnings," Jan 30, 2026.
- Forbes, "Analyzing Alcoa Stock Ahead of Its Earnings Report," Apr 14, 2025.
- Forbes, "What's Next After Alcoa's 40% Surge?," Nov 16, 2025.
- Forbes, "Where Is Alcoa Stock Headed?," Oct 1, 2025.
- Forbes, "Why Is Alcoa Stock Up 100%?," Jan 12, 2026.
- The Wall Street Journal, "Alcoa Posts Higher Profit On Alumina, Aluminum Sales Gains," Jan 22, 2026.