Raised 2026 Cash-Flow Target and Venezuela Ramp Collide With Chevron (CVX)’s 72-Day Win Window
Chevron is heading into a midterm-year seasonal stretch that has never been negative in this dataset, just as shares hover near recent highs and investors weigh Venezuela-driven growth against policy risk.

Key takeaways
- Chevron’s upcoming 72-day window tied to midterm election years has been positive in 13 of 13 historical cycles, with an average gain of 8.73% for long exposure.
- The pattern starts Mar 4 and runs through early summer, overlapping a period when energy policy and geopolitical headlines often intensify.
- All 13 years in the sample were winners, so there are 13 winners and 0 losers in this window.
- Average gains of 8.73% come with meaningful swings: past years have seen double-digit peak run-ups and mid-single-digit drawdowns inside the window.
- The Trade Direction is long, with a TradeWave Ratio of 2.4 and a Sharpe ratio of 1.52, pointing to historically strong, risk-adjusted upside in this slice of the calendar.
- Today’s price near $169.96 leaves Chevron about 11.2% below its 52-week high of $191.44, giving the seasonal window room to work if the pattern repeats.
According to historical data from TradeWave.ai, this midterm-year stretch has behaved very differently from an average quarter for Chevron, and the next iteration begins today.
Seasonal window
Chevron has risen in 13 of 13 midterm election years during this 72-day window, averaging 8.73% gains for long positions. Shares last traded around $169.96 on Wednesday, roughly 11.2% below the 52-week high of $191.44 and well above the 50-day moving average near $166.63, leaving the stock in an uptrend with some distance to prior peaks.
Grouping the data by the presidential election cycle matters here because midterm years often bring a different policy and liquidity mix than typical bull-market stretches. Energy names like Chevron sit at the intersection of geopolitics, regulation and inflation, so their behavior in midterm years can diverge sharply from non-election periods as Washington debates sanctions, drilling permits and tax policy.
This seasonal window begins on Mar 4 and spans 72 trading days. Historically, during this period in the last 13 midterm election years, Chevron has shown a strong upside tendency for long exposure, with every year in the sample finishing higher at the end of the window.
The Trade Direction for this pattern is long. Percent Profitable sits at 100%, with 13 winners and 0 losers across the lookback. Average profit across those winning years is 8.73%, which also matches the all-years average because there were no losing years in this sample.
Individual years show a wide range of outcomes around that average. In 2018, Chevron gained 15.24% during the window, with a best point-to-peak move of 15.85% and a worst intraperiod drawdown of 2.31% from the entry. In 1994, the stock still finished higher by 1.36%, but the worst drawdown inside the window reached 6.66% even as the best run-up topped 5.24%.
The maximum favorable move, or MFE, represents the best intraperiod rally from the starting price, while the maximum adverse move, or MAE, captures the worst drawdown from that same entry. Across the 13 midterm-year windows, MFE readings often reached high single digits to mid-teens, while MAE tended to sit in the low to mid-single digits, showing that upside bursts have historically outweighed downside dips but that pullbacks have still been meaningful.
On a trend basis, the historical seasonal average suggests gains tend to build steadily rather than in a single spike. The pattern’s Sharpe ratio of 1.52 indicates that, based on end-of-window outcomes, returns have been strong relative to the volatility of those outcomes. The TradeWave Ratio of 2.4 measures how far price typically travels in the trade direction within the window, independent of the final close, and reinforces that intraperiod rallies have often been sizable.
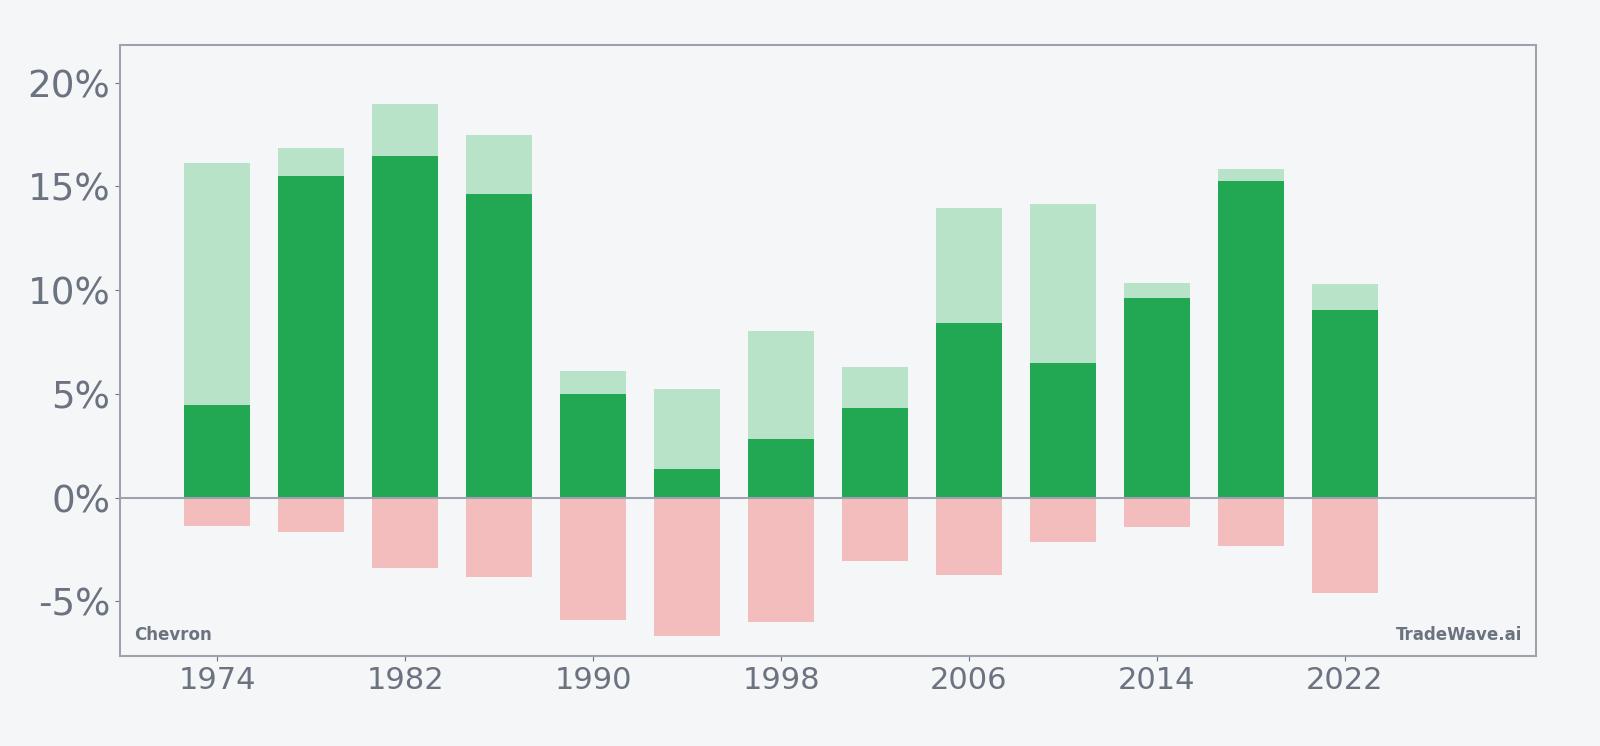
The cumulative return profile across the last 13 midterm election years shows a clear upward staircase rather than a choppy sideways line. Add it up: a 192% cumulative gain across those windows, annualized at 8.61%, with no losing years in this dataset.
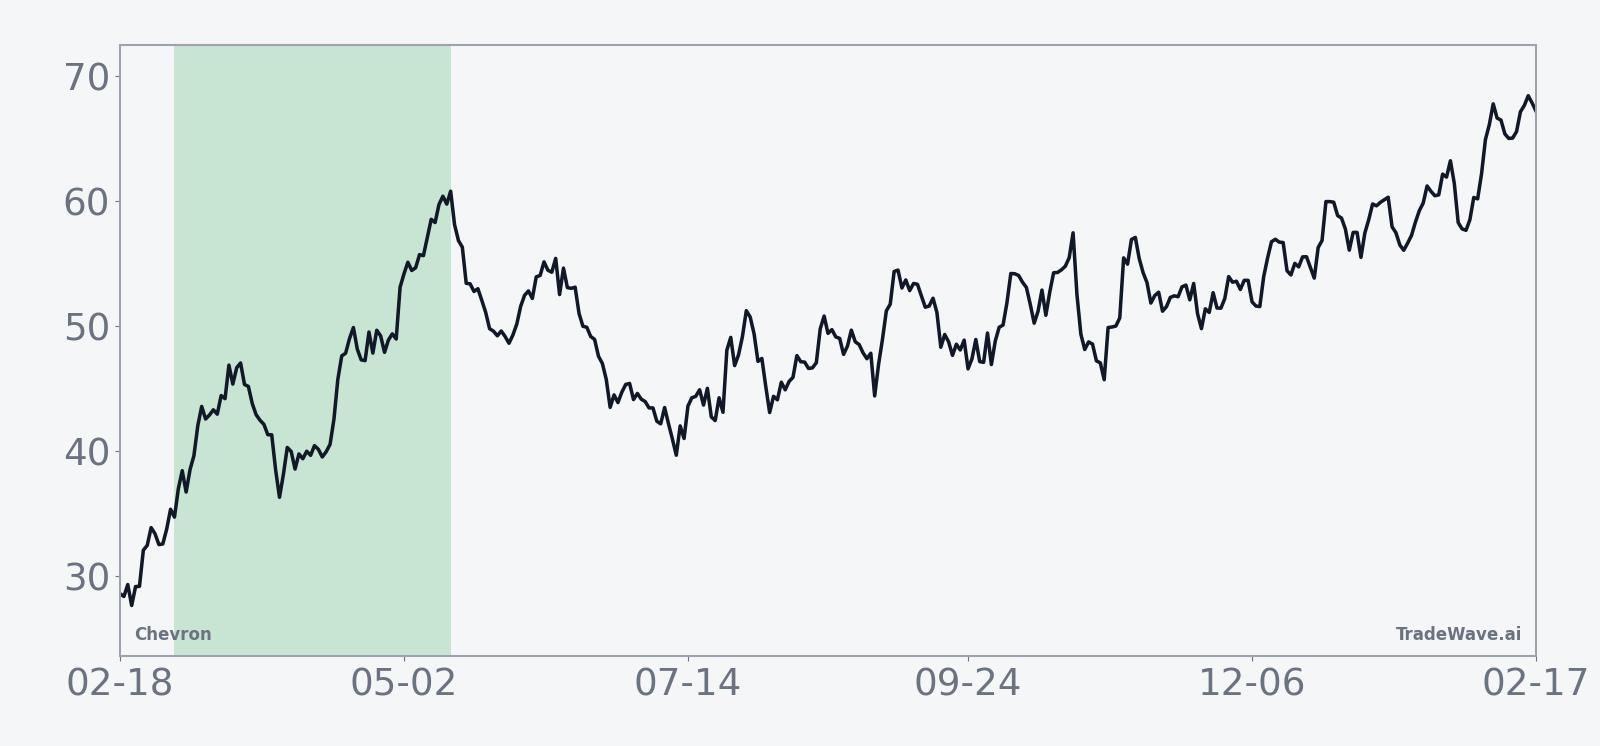
Year-by-year bars with peak rallies and worst drawdowns show how consistently the window has favored longs while still delivering tradable swings.
History does not guarantee future results, and even in a perfect win streak, adverse moves inside the window have at times been large enough to challenge tight risk management.
Price and near-term drivers
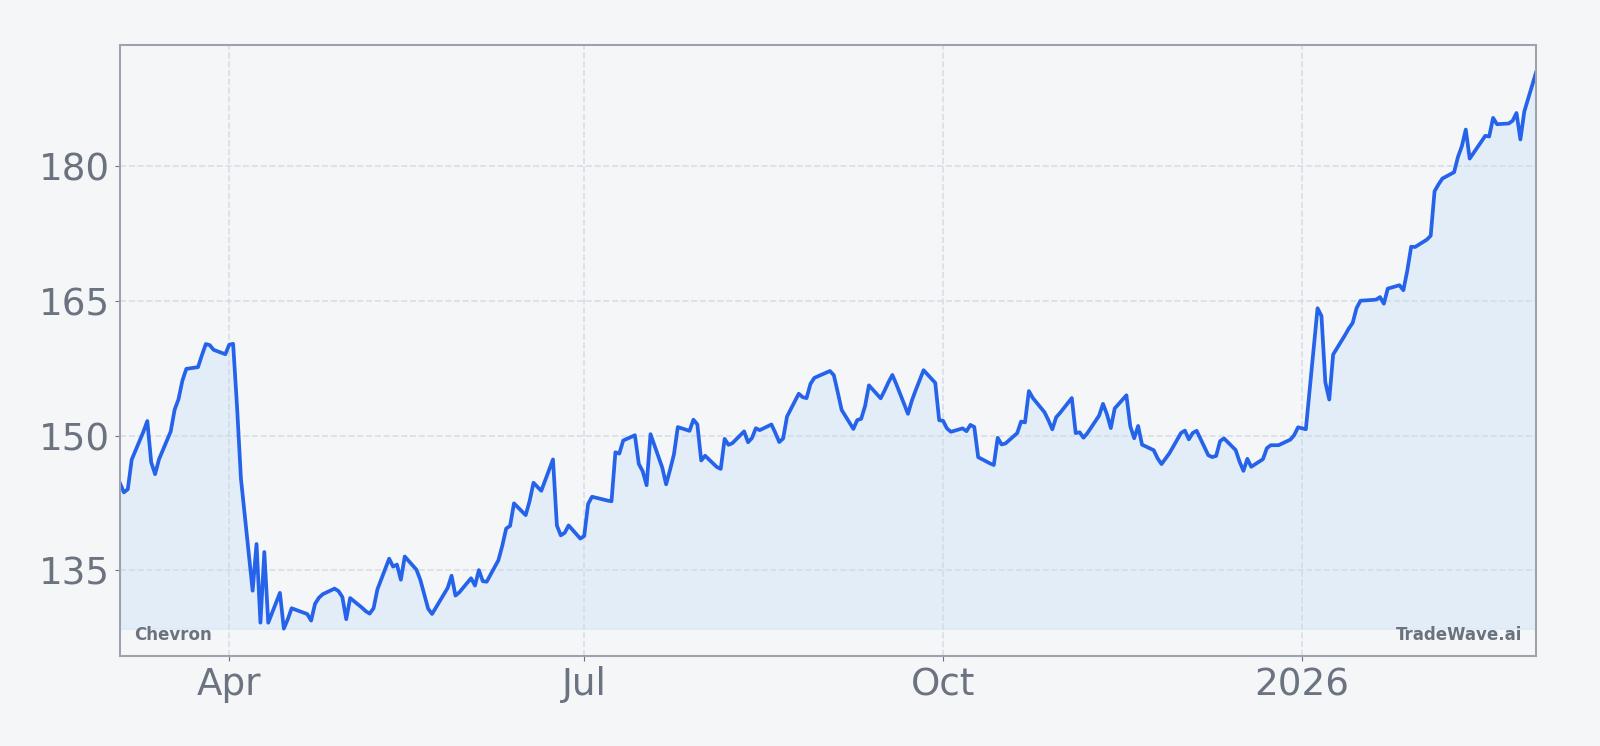
Chevron stock was little changed Wednesday around $169.96, effectively flat on the day but up 9.29% over the past month and trading above its 50-day moving average of about $166.63. That leaves the shares roughly 11.2% below their 52-week high of $191.44 and well clear of the 52-week low near $120.91, a setup that keeps the longer-term uptrend intact while giving bulls room before retesting prior peaks.
The latest leg higher has been fueled in part by a clean earnings run. On Jan 30, Chevron reported Q4 2025 adjusted earnings of $1.52 per share, topping estimates of $1.45 as global production hit a record 4.05 million barrels per day, even as lower crude prices weighed on revenue.[3] Management also raised free cash flow guidance for 2026 to $12.5 billion and highlighted plans to ramp Venezuela production by 50% over the next 18 to 24 months, reinforcing a growth story that leans heavily on geopolitically sensitive barrels.[3]
That Venezuela angle is central to the macro backdrop. U.S. intervention and sanctions policy have opened a narrow path for Chevron to expand operations there, but the arrangement remains politically exposed and subject to shifts in Washington’s stance.[3] In late January, broader coverage of Big Oil earnings framed Chevron as one of the key beneficiaries if Venezuelan output can scale without triggering a backlash or new restrictions, a dynamic that could keep policy risk elevated through the midterm election year.[3]
On the sell-side, Chevron still carries a Buy consensus rating, with a combined price target around $178 from Piper Sandler and TipRanks, modestly above where the stock trades today.[1] That target implies incremental upside rather than a moonshot, which lines up with the seasonal pattern’s mid-single to low-double-digit average gains rather than explosive one-off spikes.
The chart below situates the latest move in its recent multi-month context.
Macro and election-cycle backdrop
Calendar-wise, markets are in the midterm election year, which often brings a two-act structure for risk assets. Early in the year, policy debates around spending, regulation and foreign policy can inject volatility, especially for sectors like energy that sit at the center of inflation and national security discussions. Later in the cycle, as uncertainty clears and the market looks ahead to the pre-election year, risk appetite has historically improved.
For Chevron, that means the 72-day window starting Mar 4 sits in a phase where Washington’s stance on drilling permits, export rules and sanctions can shift quickly. The company’s raised free cash flow guidance and Venezuela growth plan lean into that policy-sensitive terrain, tying a chunk of its medium-term upside to decisions that will be debated in the run-up to the midterms.[3]
Energy-sector commentary has also highlighted Chevron’s capital efficiency and free cash flow profile as differentiators. One recent analysis pointed to upstream capital efficiency running 29% below the peer average and an AI-driven outlook for free cash flow growth of about 10% annually, factors that can cushion the impact of softer crude prices or regulatory friction.[1] In a midterm year where fiscal and monetary policy may both be in flux, that kind of balance sheet and cash-generation story can matter as much as headline oil prices.
What to watch in this window
For traders tracking this 72-day midterm-year window, the first checkpoint is whether Chevron can hold above its 50-day moving average while the pattern is active. Historically, stronger years in this window have seen the stock build gains steadily rather than lurching higher in a single burst, so a grind higher toward the low $180s would be more in character with the seasonal profile than a sharp spike followed by a deep retrace.
Policy and geopolitics will be the other key axis. Any fresh headlines around U.S. sanctions, Venezuelan production quotas or tax proposals targeting Big Oil profits could either reinforce or disrupt the historical pattern. A supportive policy tone that keeps Chevron’s Venezuela ramp on track would align with the long-biased seasonal window, while a surprise clampdown or renewed sanctions fight could test the pattern’s perfect win streak.
On the fundamental side, watch for updates tied to the company’s raised 2026 free cash flow guidance and progress toward that 50% Venezuela production increase.[3] Evidence that Chevron is hitting those milestones without a material deterioration in crude prices would strengthen the case for the stock to behave more like the stronger historical years in this window.
Finally, behavior inside the window itself will be telling. A move that quickly pushes Chevron toward or through the prior 52-week high near $191.44, with intraperiod drawdowns contained to the low single digits, would rhyme with the best historical episodes. A choppy tape that repeatedly undercuts recent support or delivers unusually deep mid-window drawdowns would be an early sign that this midterm-year iteration is diverging from the 13-for-13 record.
Sources
- [1] Reuters – Chevron meets Wall Street profit estimates as refining recovers (May 2, 2025).
- [2] Reuters – Chevron beats Wall Street profit estimates with record output (Aug 1, 2025).
- [3] CNBC – Chevron earnings beat as production hits record with upside expected in Venezuela (Jan 30, 2026).
- [4] Seeking Alpha – Chevron paid hundreds of millions to Venezuela in secret deal with Biden (Mar 23, 2025).