Cost Cuts, Layoffs and Asset Sales Drive ConocoPhillips (COP) Into Its Strongest Midterm Window
ConocoPhillips is nearing a historically strong 24-day midterm-year window just as shares trade close to their 52-week high and management leans on cost cuts and asset sales against softer crude prices.
Key takeaways
- ConocoPhillips has posted gains in all 10 midterm election years during this 24-day spring window, with an average profit of 4.16% for long exposure.
- The upcoming window runs from Mar 9 through early April and is based on behavior in the last 10 midterm election years, not consecutive calendar years.
- The pattern is long-biased, with 100% Percent Profitable, 10 winners and 0 losers, and a Sharpe ratio of 1.91 across the sample.
- Average winners have seen a TradeWave Ratio of 2.31, meaning price has typically traveled meaningfully in the trade direction within the window even beyond the final close.
- Intraperiod drawdowns have still appeared in prior cycles, with adverse moves of roughly 3% to 4% in some years before the trade finished higher.
- The setup arrives as COP trades about 4.1% below its 52-week high and management pursues cost cuts and asset sales into a weaker crude tape.
According to historical data from TradeWave.ai, this specific midterm-year stretch has behaved very differently from an average month on the calendar for ConocoPhillips. The next section walks through what that pattern has looked like in prior cycles and how it frames the coming weeks.
Seasonal window
ConocoPhillips has risen in 10 of 10 midterm election years during this 24-day March window, averaging 4.16% gains for long positions. The next iteration begins on Mar 9 with the stock changing hands at $117.48, about 4.1% below its 52-week high of $122.50.[6] That combination of a clean win streak and a price already near the top of its one-year range gives this slice of the calendar more weight than usual.
Grouping the data by the presidential election cycle matters here because energy spending, regulation and capital discipline often move with Washington’s timetable. Midterm years tend to be when policy debates around drilling, emissions and fiscal priorities heat up, which can change how investors reward or punish upstream producers compared with the quieter years after an election.
This seasonal window begins on Mar 9 and spans 24 trading days. Historically, during this period in the last 10 midterm election years, ConocoPhillips has shown a strong upside tendency for long exposure. The trade direction in the pattern is explicitly long, and every single year in the sample finished the window with a positive net return.
Percent Profitable sits at 100%, with 10 winners and 0 losers across those midterm-year samples. Average profit across all years is 4.16%, which by definition is also the average winner because there were no losing years in this window. That is a solid gain for a roughly one-month holding period in a large-cap energy stock.
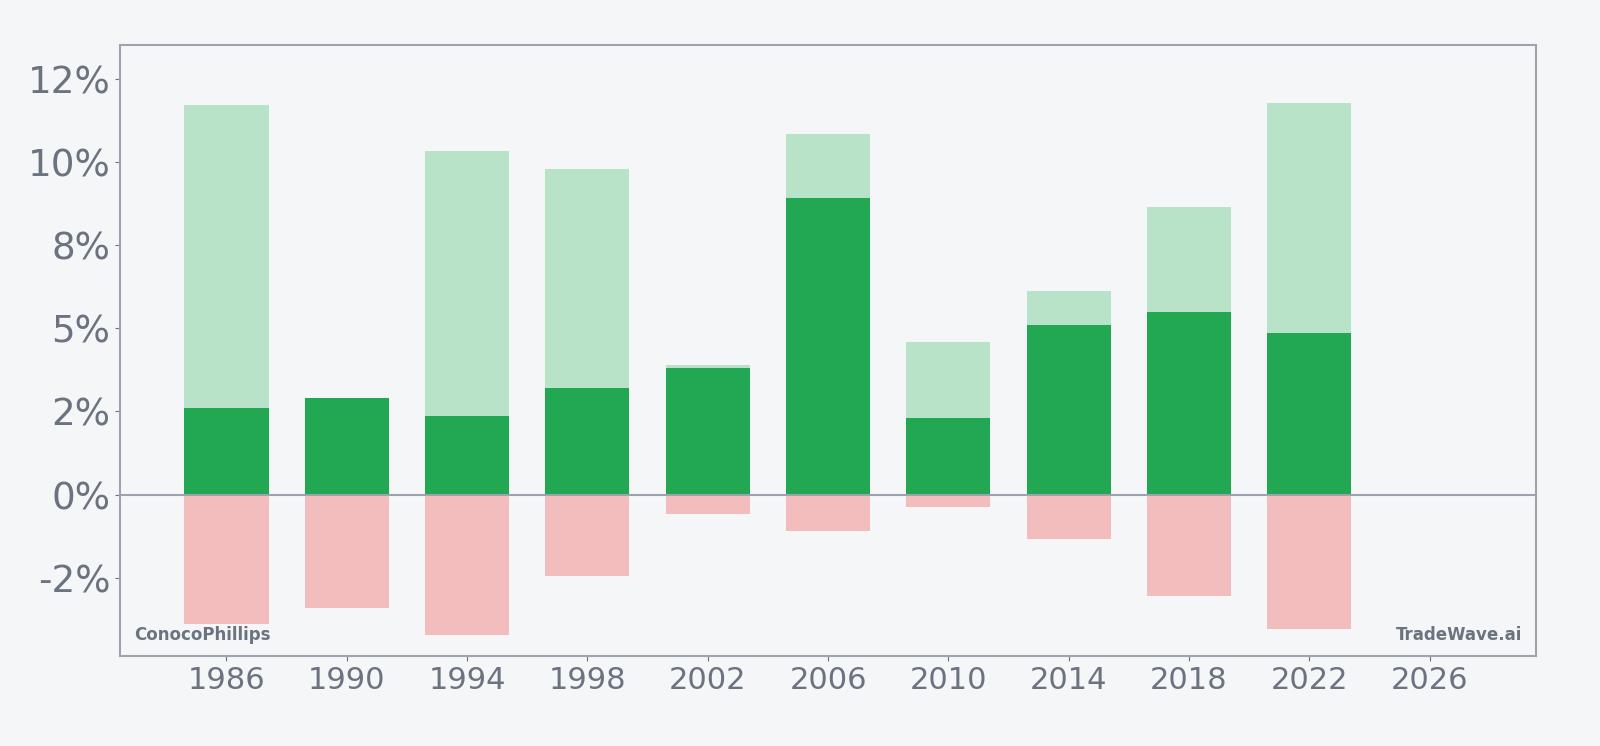
The per-year table shows how that upside has played out. The weakest year in the sample was 1986, when COP still gained 2.6% in the window, while the strongest was 2006 with an 8.91% net return. More recent cycles have been steady rather than spectacular, with 2018 and 2022 delivering 5.5% and 4.85% respectively over the same stretch.
TradeWave Ratio (TWR) for this pattern is 2.31, which measures how far price typically travels in the trade direction within the window, independent of the final close. That suggests that intraperiod rallies have often extended well beyond the simple entry-to-exit gain, giving traders room to manage risk or take partial profits even when the final print looks modest.
The Sharpe ratio of 1.91 indicates that, based on end-of-window outcomes, the risk-adjusted return has been unusually strong for this specific setup. Returns have not only been positive but have also clustered tightly enough that the average gain stands well above the volatility of those outcomes.
Looking at intraperiod swings, the best point-to-peak move, or maximum favorable excursion, has often been sizable. In 1986, for example, COP’s maximum favorable move inside the window reached 11.7%, while 2022 saw a peak run-up of 11.76% before settling back to a 4.85% net gain. That pattern of double-digit upside spikes inside a mid-single-digit finish shows how much noise can sit inside a seemingly smooth seasonal edge.
On the downside, the worst intraperiod drawdown, or maximum adverse excursion, has typically been contained but not trivial. Several years, including 1986, 1994 and 2022, saw adverse moves of roughly 3% to 4% from the entry level before the trade recovered and finished higher. Traders using this window historically have had to tolerate that kind of giveback to stay in the trade.
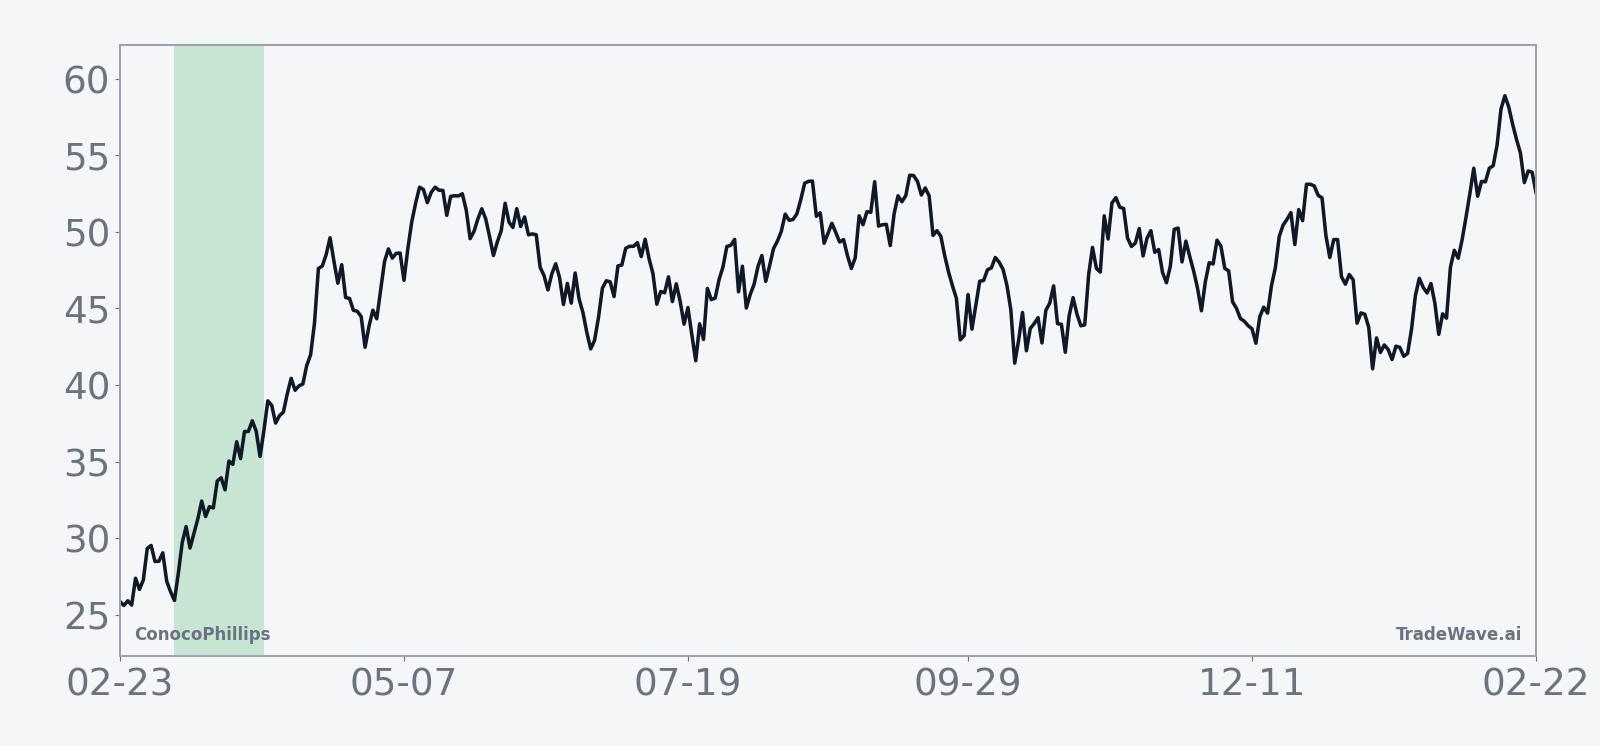
The historical seasonal trend chart for this window slopes higher through most of the 24 days, with gains tending to build rather than arrive in a single burst. The average path shows a modest early lift, a brief mid-window pause and then a stronger push into the final third of the period, which lines up with the larger winners in years like 2006 and 2018.
The cumulative return profile across the last 10 midterm election years reinforces that story. Gains have stacked steadily rather than relying on one or two outlier years, which is why the cumulative return across the sample reaches 50% for this window. Add it up: ten for ten, with a consistent upward bias and manageable, though real, drawdowns along the way.
Year-by-year bars show how those average gains have combined with intraperiod rallies and drawdowns.
History does not guarantee future results, and even in a perfect win streak, adverse excursions inside the window can be large enough to challenge risk limits.
Price and near-term drivers
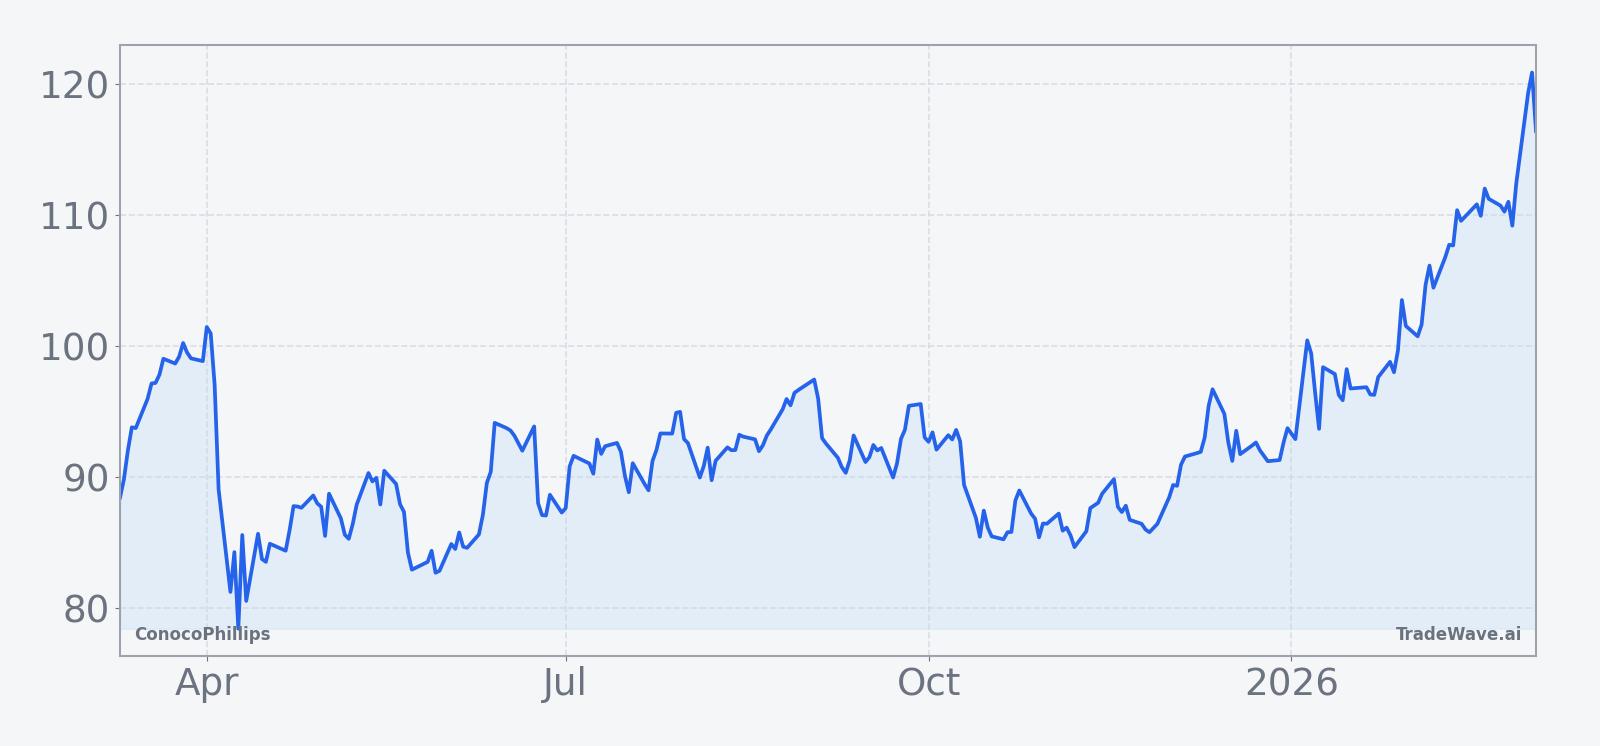
ConocoPhillips shares closed at $117.48 on Thursday, up 1.6% on the day and roughly 11.96% higher over the past month as the stock grinds toward its 52-week high of $122.50 on relatively light volume versus its 20-day average.[6] That rally has come despite a tougher macro tape for crude, with oil prices down around 12% this year as OPEC+ output and economic uncertainty weigh on benchmarks, pressuring earnings power for producers like COP.[5]
Management has leaned into cost discipline and portfolio pruning to offset that softer commodity backdrop. ConocoPhillips has already cut about $900 million in adjusted operating costs since 2024 and is targeting another $400 million in reductions in 2026, part of a broader push to deliver $1 billion in cost reductions and margin enhancements and $7 billion in incremental free cash flow by 2029.[2][3] Those efforts are paired with plans to sell roughly $5 billion of assets by 2026, including about $2 billion of Permian holdings that the company has been considering offloading as it streamlines its footprint.[6]
In November 2025, ConocoPhillips reported an adjusted third-quarter profit of $1.61 per share, topping estimates of $1.43 as higher U.S. onshore output lifted production to 2.4 million barrels of oil equivalent per day and helped fund a dividend increase and higher output guidance.[4] That performance, combined with the cost and asset-sale program, has underpinned an “Outperform” consensus rating and a price target around $123.82 from GuruFocus and brokerage firms, a level that sits only slightly above where the stock trades today and reflects expectations formed in an earlier price regime.[1][2][3]
The policy backdrop of a midterm election year adds another layer. Debates over drilling permits, emissions rules and fiscal priorities can influence capital budgets and investor appetite for upstream names, even when company-specific execution is strong. For a stock like COP that is already near its highs, that mix of macro headwinds, self-help levers and political noise makes the upcoming seasonal window a cleaner lens on how traders choose to position into the second quarter.
The chart below situates the latest move in its recent multi-month context.
What to watch in this window
The first marker is simple: does COP respect its historical tendency to grind higher through this 24-day midterm-year window, or does it break the 10-for-10 streak. A firm hold above the 50-day moving average, currently near $101.48, would keep the longer uptrend intact even if the stock pauses near the 52-week high.[6]
Second, watch how the stock trades around any headlines on asset sales or capital discipline. Follow-through on the planned $2 billion Permian divestiture and broader $5 billion sale target by 2026 would reinforce the free cash flow story that has supported the stock through weaker crude, and strong tape action during the window would echo the historical pattern.[6][3]
Third, monitor how COP reacts to swings in oil prices during the window. If crude remains under pressure and the stock still manages to track its typical seasonal path, that would signal investors are giving more weight to company-specific execution and midterm-year positioning than to the commodity tape. A sharp break below recent lows during the window, by contrast, would be a clear departure from the historical profile and a sign that macro stress is overwhelming the calendar effect.
Finally, keep an eye on policy headlines as the midterm election year unfolds. Any shift in expectations around regulation, taxes or federal leasing could change how investors treat upstream cash flows, and the way COP trades through this historically strong stretch will offer an early read on whether this cycle is following the usual midterm playbook or writing a new one.
Sources
- [1] GuruFocus, "ConocoPhillips (COP) Plans Workforce Reductions Post-Merger," Apr 23, 2025.
- [2] GuruFocus, analysis of ConocoPhillips cost reductions and efficiency plans, Apr 23, 2025.
- [3] GuruFocus, commentary on ConocoPhillips free cash flow targets through 2029, Apr 23, 2025.
- [4] Reuters, "ConocoPhillips lifts dividend, raises output forecast after profit beat," Nov 6, 2025.
- [5] Reuters, "ConocoPhillips' deep layoffs highlight need for capital discipline, analysts say," Sep 8, 2025.
- [6] Reuters, "ConocoPhillips considers selling Permian assets worth $2 billion," Feb 20, 2026.