AES Corporation (AES) Buyout Spread Faces a 6-of-7 Midterm Winning Spring Window
AES Corporation is approaching a late-March midterm-year window that has usually delivered quick gains, even as shares trade below the pending buyout price.

Key takeaways
- AES Corporation’s late-March midterm-year window has been positive in 6 of the last 7 cycles, a historically strong short-term pattern for a long setup.
- The upcoming window begins on Mar 26, 2026 and runs for 9 trading days, grouping only midterm election years rather than consecutive calendar years.
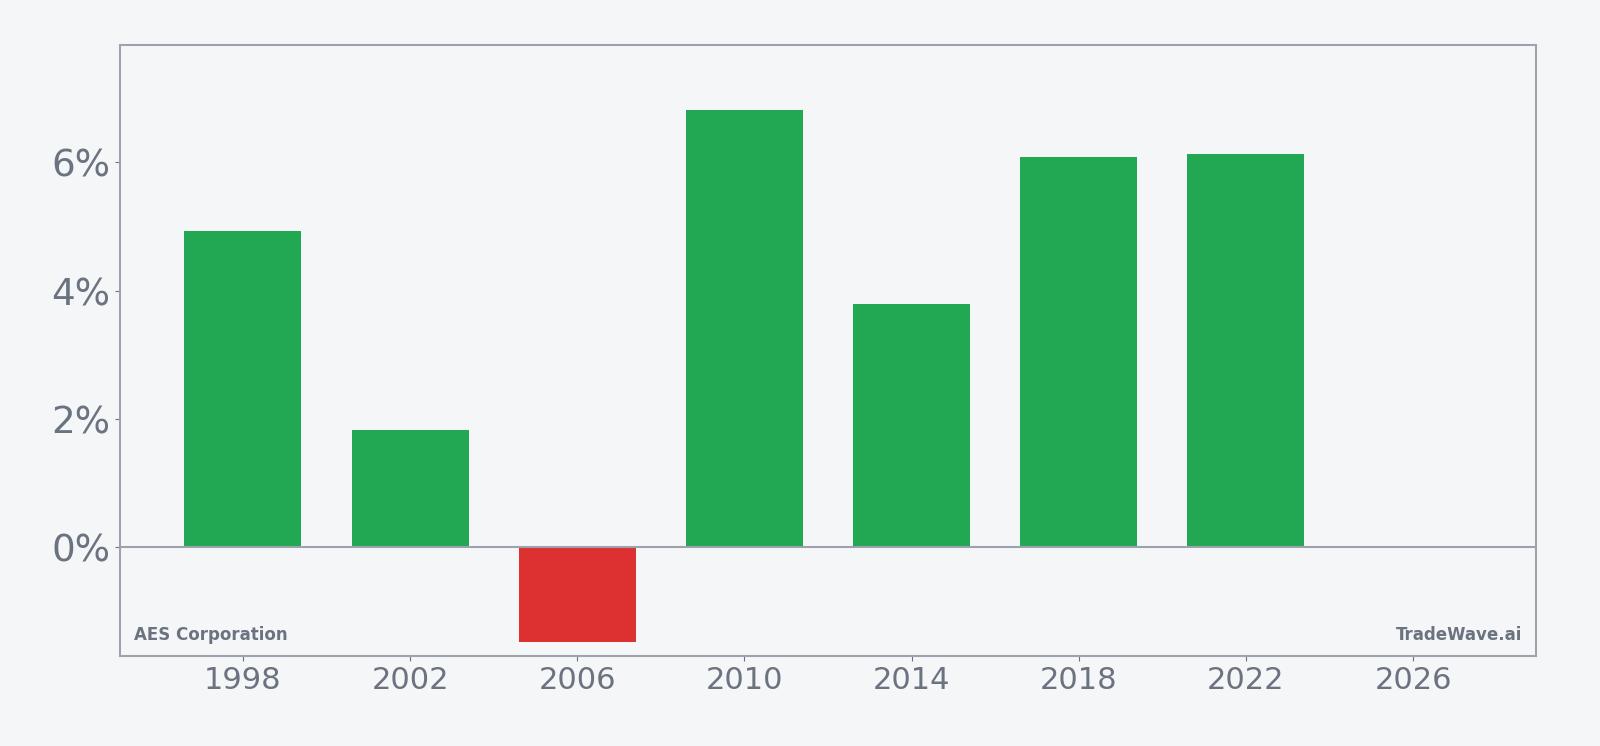
- Winning years in this stretch have averaged a 4.93% gain, while including the lone losing year brings the all-years average to 4%.
- The pattern’s Percent Profitable is 86%, with 6 winners and 1 loser, and a Sharpe ratio of 1.33 over the sample.
- Intraperiod swings have been meaningful, with strong maximum favorable moves but also adverse excursions that traders would have had to sit through.
- This seasonality arrives as AES trades around $14.29, below the agreed $15 per-share take-private price, keeping merger spread dynamics in play.
According to historical data from TradeWave.ai, this specific late-March stretch in midterm election years has behaved very differently from an average month for AES, and the next iteration is now on the calendar.
Seasonal window
AES Corporation has risen in 6 of 7 midterm-year windows that start around Mar 26 and last 9 trading days, averaging 4.93% gains in the winning years. Shares finished Thursday at $14.29, roughly 19.2% below their 52-week high of $17.65 and well above the 52-week low near $8.56, leaving room on both sides of the pending $15 cash offer.
The presidential election cycle matters here because the pattern only looks at midterm election years, which often feature shifting policy expectations, regulatory noise and tighter financial conditions before the pre-election year typically turns more supportive for risk assets. For a regulated utility and energy infrastructure name like AES, that mix of rate policy and climate-related regulation can change how investors treat short tactical windows around corporate events.
This seasonal window begins on Mar 26, 2026 and spans 9 days. Historically, during this period, AES Corporation has shown a strong bullish tendency for long positions, with 86% of the sampled midterm years finishing higher over the window. The trade direction is explicitly long, so the six positive outcomes are the “good” years for the pattern, while the single down year in 2006 represents the unfavorable case.
Average winner gains of 4.93% line up closely with the median profit of 4.93%, which tells you the typical positive year has been a mid-single-digit pop rather than a one-off outlier. When you fold in the 1.48% loss from 2006, the Avg Profit - All metric drops to 4%, still solid for a nine-session stretch. Add it up: across the seven midterm-year samples since 1998, the cumulative return for this window is 31% on a long basis.
The per-year breakdown shows how that plays out. In 2010, AES gained 6.81% in the window, with a maximum favorable move of 7.09% and only a 0.28% worst drawdown from entry. In 2022, the stock added 6.13%, with a 6.49% best intraperiod run-up and a small 0.53% adverse move. The outlier on the downside is 2006, when the trade finished down 1.48% and never rallied more than 1.48% from entry, while the worst drawdown reached 1.95%.
The historical seasonal trend chart suggests that, in winning years, much of the move has tended to accrue steadily across the nine days rather than in a single gap. The line slopes higher with relatively few sharp reversals, which fits a pattern where intraperiod maximum favorable moves have often been in the 5% to 7% range while adverse swings stayed smaller.
The combined net, best-case and worst-case bars show how much room AES has historically had to run or slip inside this short window.

The stacked net, maximum favorable and maximum adverse bars underline that this has been a high-conviction but not low-risk window. In most years, the maximum favorable excursion has been meaningfully larger than the final net gain, which means traders saw more upside intraperiod than the closing result captured. At the same time, the maximum adverse excursions, while smaller than the upside in the strong years, show that even winning windows often involved 1% to 4% drawdowns before the trade worked.
History does not guarantee future results; adverse excursions can be large even in winning windows, and past midterm-year behavior may not repeat in 2026.
Price and near-term drivers
AES closed Thursday at $14.29, essentially flat on the day and down 11.19% over the past month, as the stock digests a pending $33 billion take-private deal that values the shares at $15 each.[1] That leaves AES about 4.7% below the agreed cash price and about 19.2% under its 52-week high, while still trading well above its 52-week low near $8.56, a setup that keeps merger-arbitrage dynamics front and center.
The announced acquisition by a consortium including EQT Group and BlackRock-owned Global Infrastructure Partners has turned AES into a spread trade for many investors rather than a pure fundamental or macro bet.[1] Barron’s reported on Mar 2, 2026 that the stock slumped on the news as the market weighed deal risk, regulatory review and the time value of money against the headline premium, making AES one of the weakest names in the S&P 500 that day.[1]
For traders looking at the late-March seasonal window, that backdrop matters. A stock pinned near a cash offer can behave differently from its historical pattern if new information about the deal emerges, but it can also snap back quickly toward the offer price if perceived risk eases. The seasonal record shows that in prior midterm years, this same calendar stretch has often delivered a short, sharp move; in 2018 and 2022, for example, AES logged gains of just over 6% in the window, with intraperiod rallies slightly larger than the final closes.
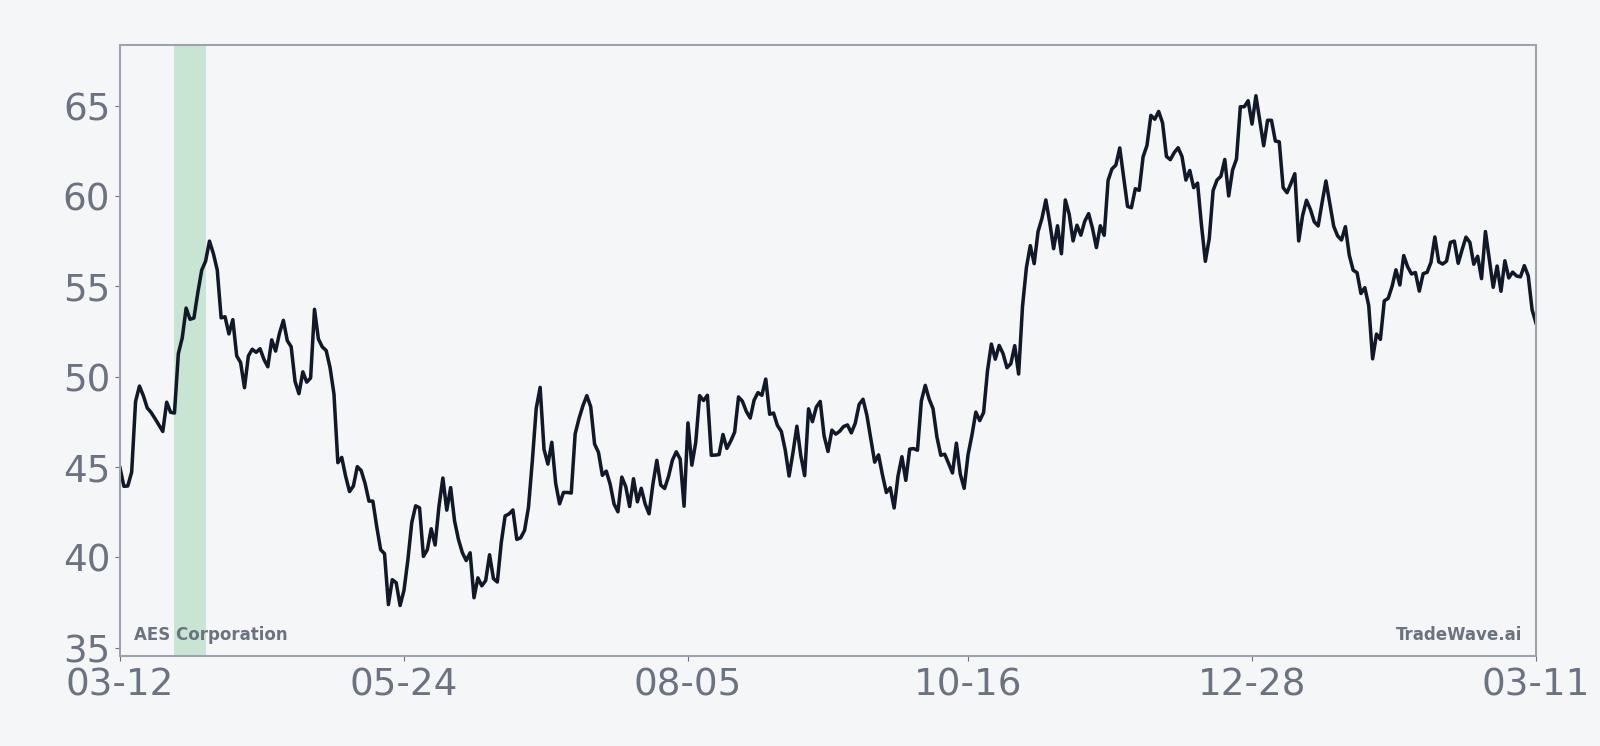
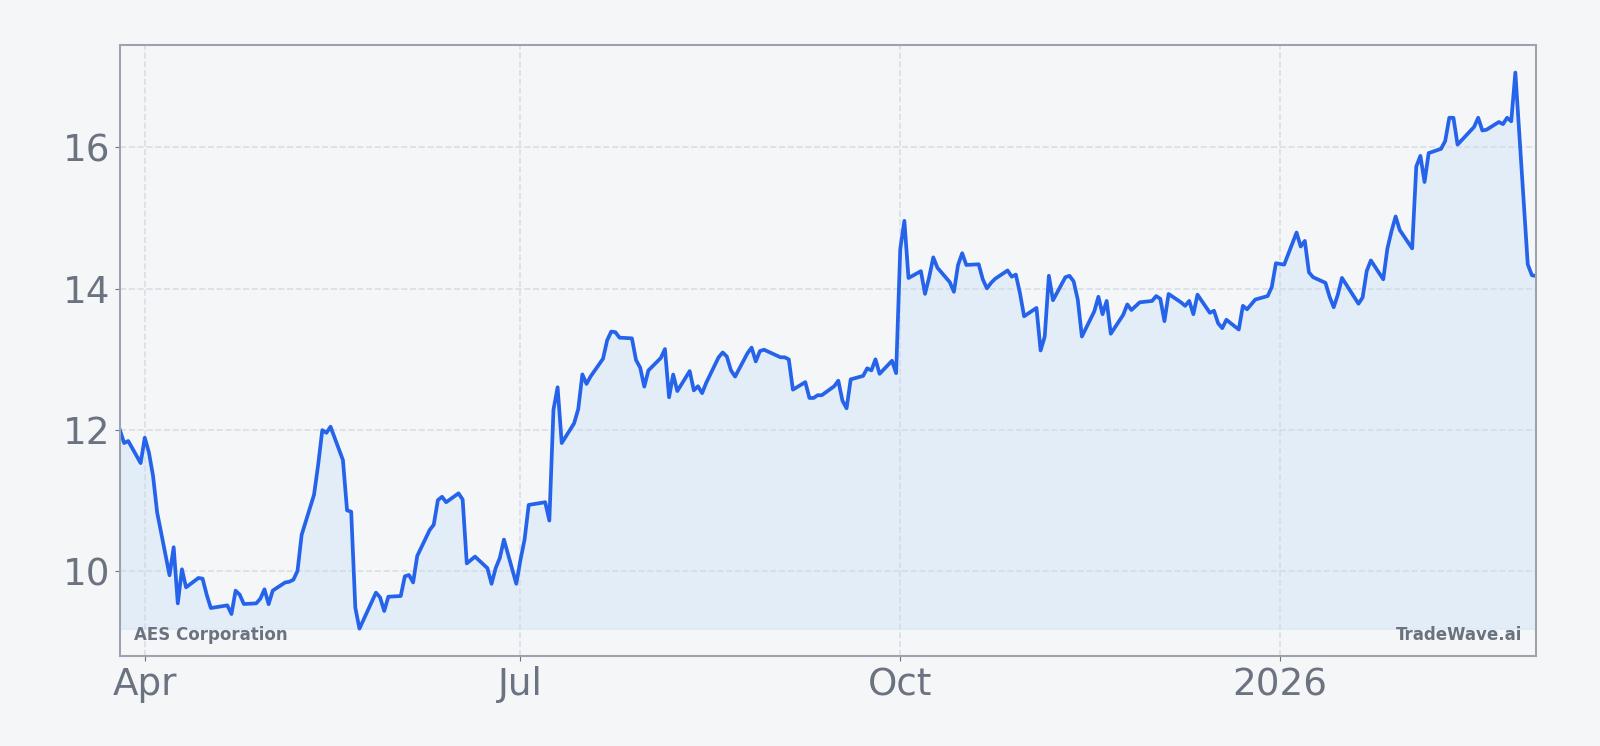
The chart below situates the latest move in its recent multi-month context.
Liquidity remains deep, with 20-day average volume around 15.4 million shares, and the stock’s 50-day moving average near $14.86 sits modestly above the latest close. That leaves AES trading slightly below its short-term trend line, a position that can amplify any quick move if the seasonal window again lines up with a shift in deal sentiment or broader risk appetite.
What to watch as the window opens
The late-March midterm-year window for AES starts on Mar 26 and runs into early April, giving traders a defined nine-session band to monitor. Historically, the pattern has favored longs, with 6 winners and 1 loser, average winner gains of 4.93% and an all-years average of 4% for the period. The key tell this time will be whether price action respects the $15 offer as a ceiling, or whether the stock trades more like its pre-deal history and allows a larger intraperiod swing.
On the policy side, midterm election years often bring more noise around regulation, energy transition policy and rate expectations, all of which can influence how investors value a leveraged, capital-intensive utility platform like AES. Any headlines that change the perceived probability or timing of the buyout, or that alter the regulatory risk profile for large infrastructure deals, could inject volatility into a window that has already shown a tendency for quick moves.
Levels to watch are straightforward. On the upside, the $15 offer price is the obvious magnet; a decisive push toward that level during the window would be consistent with prior years where maximum favorable excursions ran ahead of the final net gain. On the downside, traders will be watching how the stock behaves if it drifts further below the 50-day moving average and whether any dip toward the low-$14s or high-$13s attracts buying interest consistent with a historically bullish seasonal stretch.
Finally, behavior inside the window will either confirm or contradict the historical pattern. A steady grind higher with modest drawdowns would rhyme with the 2010, 2018 and 2022 playbook. A choppy or negative outcome, more like 2006, would signal that the merger overhang and macro backdrop are overpowering the usual midterm-year seasonality. Either way, the calendar is about to flip into a nine-day stretch where AES has rarely been quiet.
Sources
- [1] Barron's, "AES to Be Taken Private in $33 Billion Deal. Why It’s the S&P 500’s Worst Stock Today." (Mar 2, 2026).