Fifth Third Bancorp (FITB) Has Rallied in 10 of 10 Midterm-Year March Windows
Fifth Third Bancorp is heading into a historically strong 15-day midterm-election-year window just as the stock trades well below its 52-week high after a sharp pullback.
Key takeaways
- A 15-day seasonal window for Fifth Third Bancorp starting Mar 2 has been profitable in all 10 midterm election years in the sample, with a long trade direction.
- Across those cycles, the stock averaged a 3.74% gain, with individual years ranging from 1.6% to 6.24% higher by the end of the window.
- Intraperiod swings have been meaningful: the best point-to-peak moves reached up to 7.03%, while the worst drawdowns inside the window ran as deep as 9.81%.
- FITB closed Friday at $49.47, about 10.8% below its 52-week high of $55.44, after sliding 4.8% on the day.
- Fourth-quarter 2025 profit rose on higher interest income and loan growth, keeping the fundamental backdrop constructive heading into this seasonal stretch.[1]
- History shows this window has tended to favor patient longs but with enough downside volatility that risk management has mattered as much as direction.
According to historical data from TradeWave.ai, this upcoming stretch has behaved very differently from an average month on the calendar for Fifth Third Bancorp, and the next iteration begins on Monday.
Seasonal window
Fifth Third Bancorp has risen in all 10 midterm-election-year March windows in this study, averaging 3.74% gains over 15 trading days. The next window begins on Mar 2 with shares at $49.47, about 10.8% below the 52-week high of $55.44 and coming off a 4.8% drop on Friday. That combination of a clean 10-for-10 record and a pullback from recent highs gives this slice of the calendar more weight than a typical short-term bounce setup.
The pattern groups the last 10 midterm election years, a phase of the presidential cycle that often brings tighter regulation debates, credit standards scrutiny and shifting expectations for future rate policy. For a regional lender like Fifth Third, that mix can change how investors price loan growth, deposit costs and capital returns in a short window, which is why a consistent seasonal bias in this phase stands out.
In this specific 15-day span, the trade direction is long. Every year in the sample finished higher, with 10 winners and 0 losers, so the Percent Profitable metric sits at 100%. Average profit of 3.74% means that, across those 10 midterm years, a simple buy-and-hold through the window produced mid-single-digit gains on average, even though the path inside the window was rarely smooth.
Average winner gains of 3.74% mask a fair amount of variation. The strongest year in the sample was 2010, when FITB climbed 6.24% from entry to exit, while 1994 delivered the softest outcome at 1.6%. In between, years like 1990, 1998 and 2014 posted gains above 4%, contributing to a cumulative return of 44% across the 10 midterm-election-year windows.
Intraperiod swings have been meaningful. The maximum favorable move, or best point-to-peak excursion during the window, reached 7.03% in 2010, while several other years saw peak gains above 5%. On the downside, the maximum adverse move, or worst drawdown from entry, hit 9.81% in 2022, showing that even a window that ultimately finished higher could subject longs to a near-10% dip before recovering.
The TradeWave Ratio (TWR) for this pattern is 2.96. TradeWave Ratio (TWR) reflects how far price typically travels in the trade direction within the window regardless of the final close. A Sharpe ratio of 2.37, based on end-of-window outcomes, points to historically strong risk-adjusted returns for this specific slice of the calendar compared with the volatility of those outcomes.
Looking year by year, the 2022 midterm window is a good example of the risk profile. FITB finished that stretch up 3.1%, but the stock first sank as much as 9.81% below the entry level before recovering, while the best intraperiod rally from entry reached 3.52%. In contrast, 2014 saw a smoother ride, with a 5.02% net gain, a 6.09% peak run-up and only a 0.65% worst drawdown.
The historical seasonal trend chart for this window shows a tendency for gains to build gradually rather than in a single burst. On average, returns start modestly positive in the first few days, then accelerate in the back half of the 15-day span, with relatively few years showing persistent weakness across the entire window.
The cumulative return profile across the 10 midterm-election-year samples reinforces that picture. Gains stack steadily rather than in a lumpy, boom-or-bust pattern, which is unusual for a single-stock window of this length. Add it up: 44% cumulative gains across ten spring windows, all in the same phase of the presidential cycle.
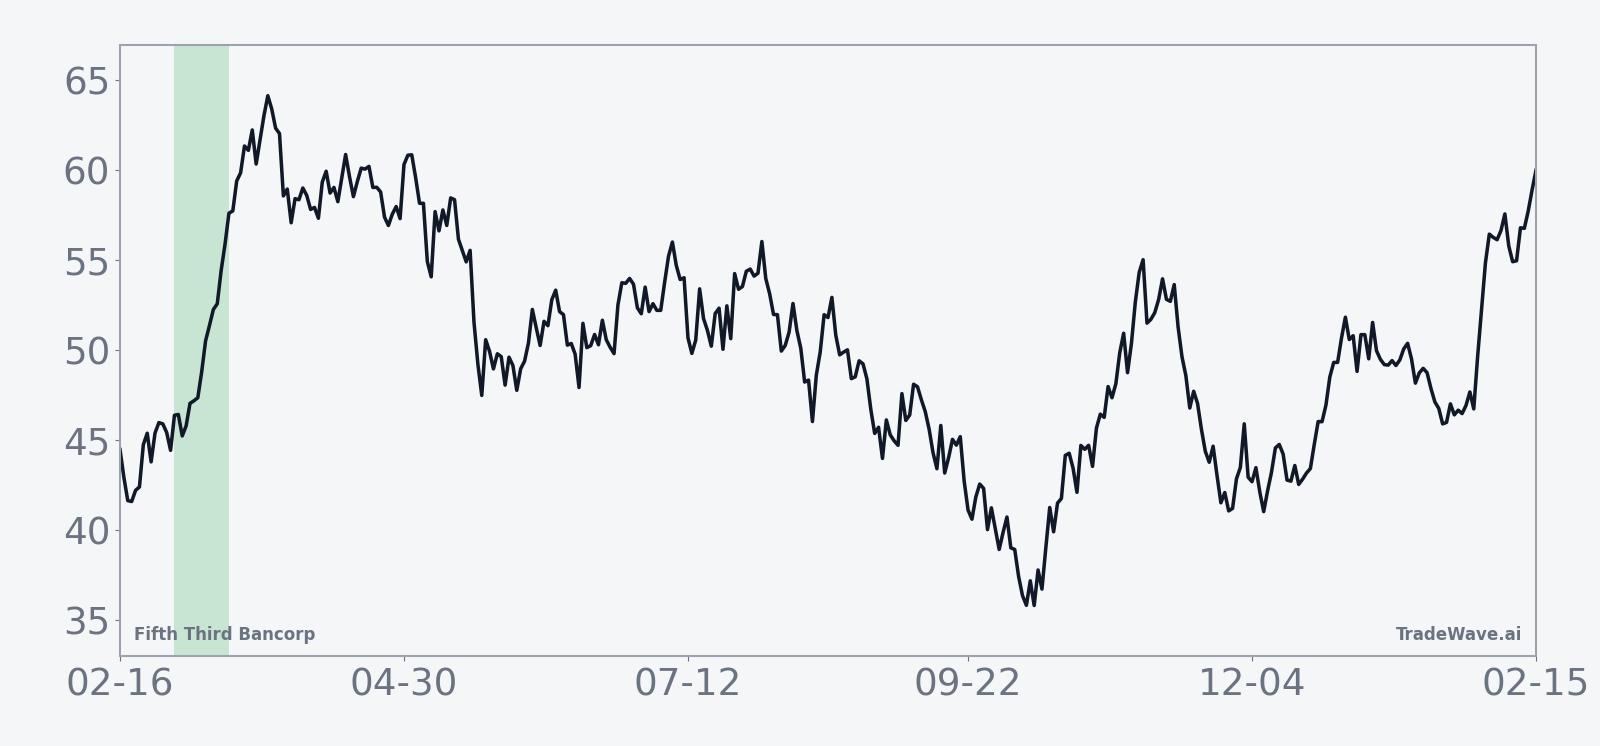
Yearly net and intraperiod swings show how upside and drawdowns have coexisted in this window.

History does not guarantee future results; adverse excursions (MAE) can be large even in winning windows.
Price and near-term drivers
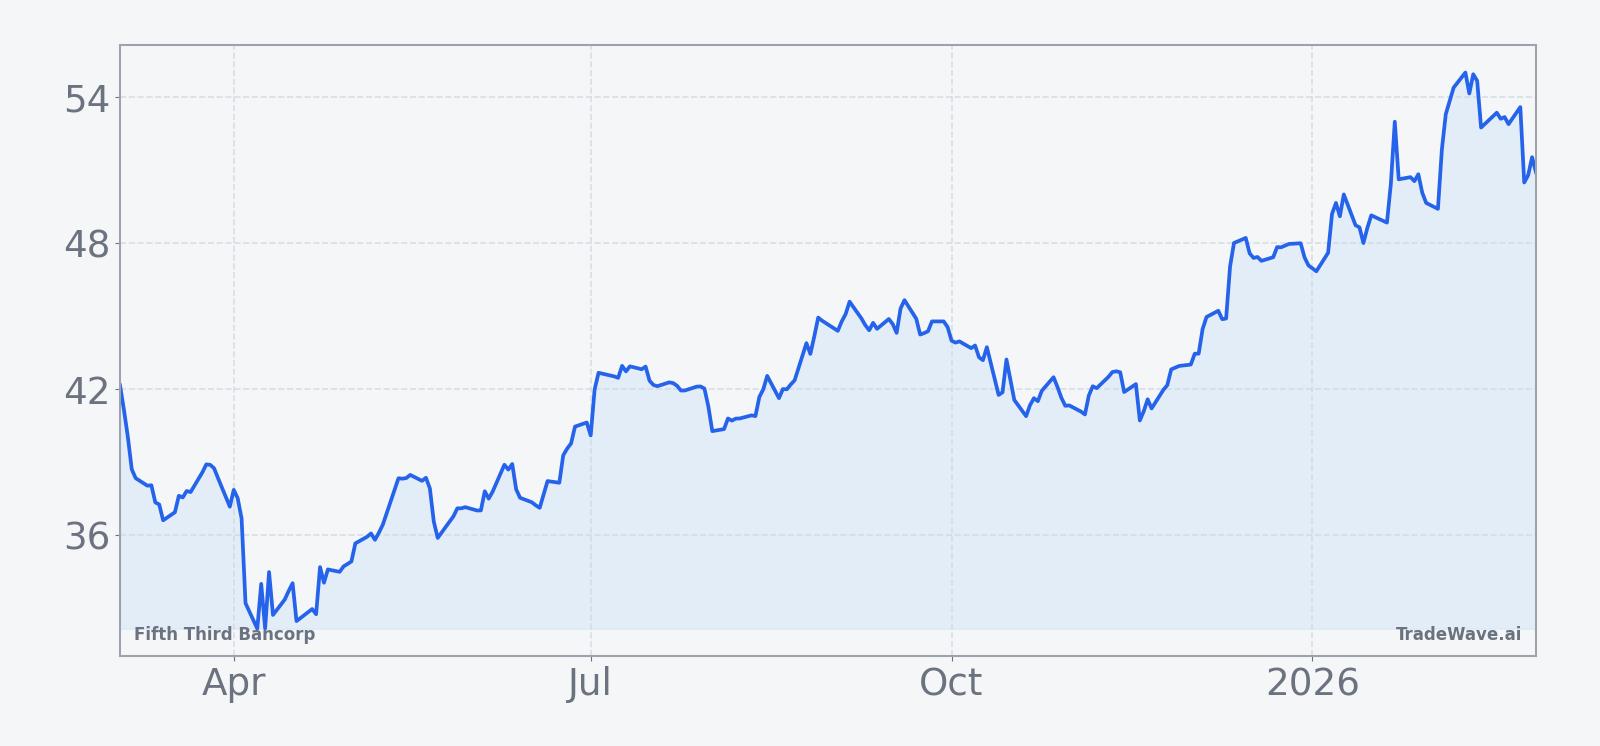
Fifth Third Bancorp closed Friday at $49.47, down 4.8% on the day, with roughly 16.7 million shares changing hands against a 20-day average volume of about 17.0 million. The stock sits about 10.8% below its 52-week high of $55.44 and modestly under its 50-day moving average near $50.31, after a choppy month that left it down 0.64% over the past 30 days.
The chart below situates the latest move in its recent multi-month context.
The fundamental backdrop coming into this window is solid. On Jan 20, Fifth Third reported that fourth-quarter 2025 net income available to common shareholders rose to $699 million, or $1.04 per share, from $582 million, or 85 cents, a year earlier, helped by a 6% increase in net interest income to $1.53 billion and 16% growth in assets under management.[1] Loan growth and higher interest income have offset pressure from funding costs, keeping profitability on an upward track.
Earlier in 2025, the bank had already shown it could grow earnings in a higher-rate environment. In July 2025, second-quarter profit increased as lower deposit costs boosted interest income, even though provisions for credit losses climbed to $173 million.[3] By October 2025, third-quarter profit was up 14% on robust fee income, even as the bank absorbed a $178 million loss tied to the Tricolor bankruptcy, and net interest income rose 7%.[2] That sequence left investors with a picture of a lender that has been able to navigate credit bumps while still expanding its core revenue base.
Against that backdrop, the upcoming midterm-election-year window is less about a turnaround story and more about how a profitable regional bank trades when policy and rate expectations are in flux. The historical pattern suggests that, in this phase of the presidential cycle, investors have repeatedly used this early-March stretch to lean into FITB rather than fade it, even when intraperiod volatility has been uncomfortable.
What to watch as the window opens
The 15-day window starting Mar 2 will test whether Fifth Third’s 10-for-10 midterm-election-year streak can extend into an eleventh cycle. The first thing to watch is how the stock behaves around the 50-day moving average near $50.31. A quick reclaim and hold above that level during the window would rhyme with the historical pattern of gains building in the back half of the stretch.
Second, monitor how FITB trades relative to the $55.44 52-week high. In prior midterm-election-year windows, the strongest years saw the stock push toward or through nearby resistance as the days progressed. A failure to make headway toward that band, or a break toward the lower 40s with little sign of dip-buying, would mark a clear departure from the historical script.
Third, keep an eye on volume and news flow around credit quality and loan growth. Past midterm-election-year windows have included years like 2022, where the stock ultimately finished higher but only after a near-10% drawdown inside the window. A similar pattern this time would likely show up as heavy-volume down days tied to macro or credit headlines, followed by stabilization and a grind higher.
Finally, the policy calendar matters. As investors parse incoming data on growth and inflation and handicap the Federal Reserve’s next moves, regional banks sit at the intersection of rate expectations and credit risk. If the market leans toward a friendlier rate path for lenders during this window, it would align with the historical tendency for FITB to finish the period higher. If instead the conversation shifts toward tighter regulation or rising credit stress, traders will be watching to see whether this is the cycle that finally breaks the 10-for-10 streak.
Sources
- [1] Reuters, “Fifth Third reports rise in fourth-quarter profit on higher interest income,” Jan 20, 2026.
- [2] Reuters, “Fifth Third profit jumps on fee income, records $178 million loss from Tricolor bankruptcy,” Oct 17, 2025.
- [3] Reuters, “Fifth Third Bancorp's quarterly profit rises on higher interest income,” Jul 17, 2025.