Automatic Data Processing (ADP) Trades Near Range Highs as Markets Gauge Hiring and Wage Trends
Automatic Data Processing is approaching a 10-day midterm-year window that has been consistently positive in past cycles, as shares trade near recent highs and investors weigh the policy and rate backdrop.

Key takeaways
- Automatic Data Processing is set to enter a 10-day seasonal window starting Mar 1 that has historically been strong during midterm election years.
- The pattern, drawn from the last 10 midterm election years, shows a long trade direction with 100% of years finishing profitable, with 10 winners and 0 losers.
- Average profit across those winning years is 3.94%, with a Sharpe ratio of 2.38 and a TradeWave Ratio of 2.12, indicating a favorable risk‑adjusted profile.
- Intraperiod swings have still mattered, with some years showing notable adverse moves before recovering, underscoring the importance of managing drawdowns.
- The window sits in the early part of the midterm election year, a phase that often features shifting expectations around policy, regulation and interest rates.
According to historical data from TradeWave.ai, this upcoming stretch for Automatic Data Processing has shown a distinct seasonal tendency in prior midterm election years. The next section looks at how that pattern has behaved and what it implies for the backdrop as this window approaches.
Seasonal window
This seasonal window begins on Mar 1, 2026 and spans 10 trading days. Historically, during this period, Automatic Data Processing has shown a strong upward tendency in midterm election years, with the pattern phase defined as the last 10 such cycles. Today the stock closed at 214.36, leaving it near the upper end of its recent 12‑month range even as broader markets continue to digest the interest‑rate and policy outlook.
Grouping the data by the presidential election cycle means this pattern reflects how ADP has behaved specifically in the early part of midterm election years, rather than across all calendar years. That matters because corporate spending, regulation and labor-market expectations often evolve differently in midterm years as Washington debates policy but is still two years away from the next presidential vote.
The trade direction for this pattern is long, meaning the historical tendency has been for ADP to rise over this 10‑day span rather than fall. Across the last 10 midterm election years in this window, the stock finished higher every time, producing a Percent Profitable reading of 100% with 10 winners and 0 losers. Average profit in those winning years was 3.94%, which is also the all‑years average because there were no losing outcomes in the sample.
Risk‑adjusted metrics also point to a favorable backdrop in prior cycles. The Sharpe ratio, which measures risk‑adjusted average return based on end‑of‑window outcomes, stands at 2.38 for this pattern, while the TradeWave Ratio is 2.12. TradeWave Ratio (TWR) reflects how far price typically travels in the trade direction within the window regardless of the final close, so a value above 2 suggests that intraperiod rallies have often been meaningfully larger than a modest drift higher.
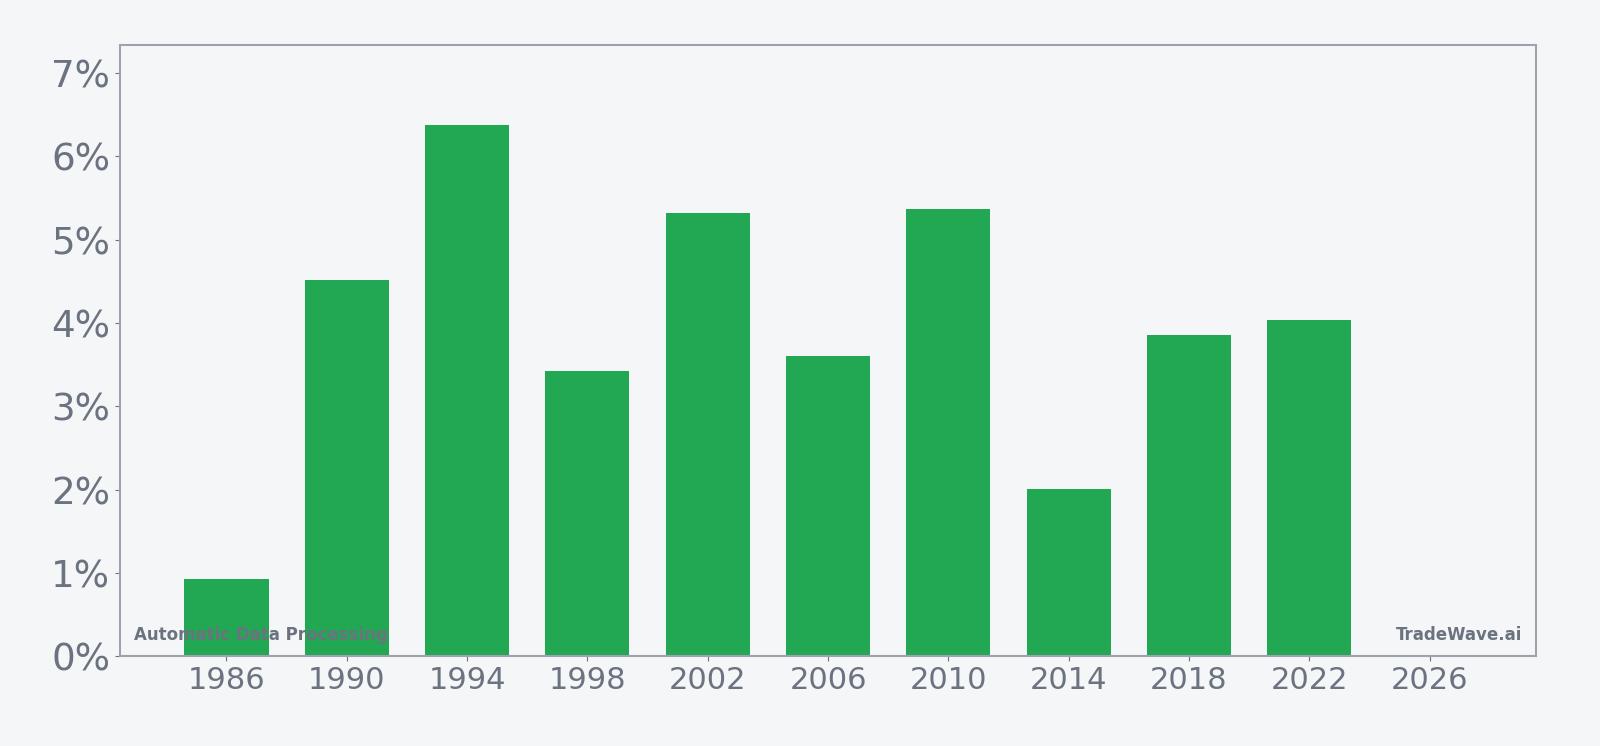
Looking at individual years helps illustrate the range of outcomes. In 1994, ADP gained 6.38% over the window, with a best point‑to‑peak move, or maximum favorable excursion, of 9.08% and a worst drawdown, or maximum adverse excursion, of 0.49% from the entry level. In 1986, by contrast, the net gain was just 0.93%, and the stock experienced a deeper intraperiod setback, with a worst drawdown of 3.37% before recovering into the close of the window.
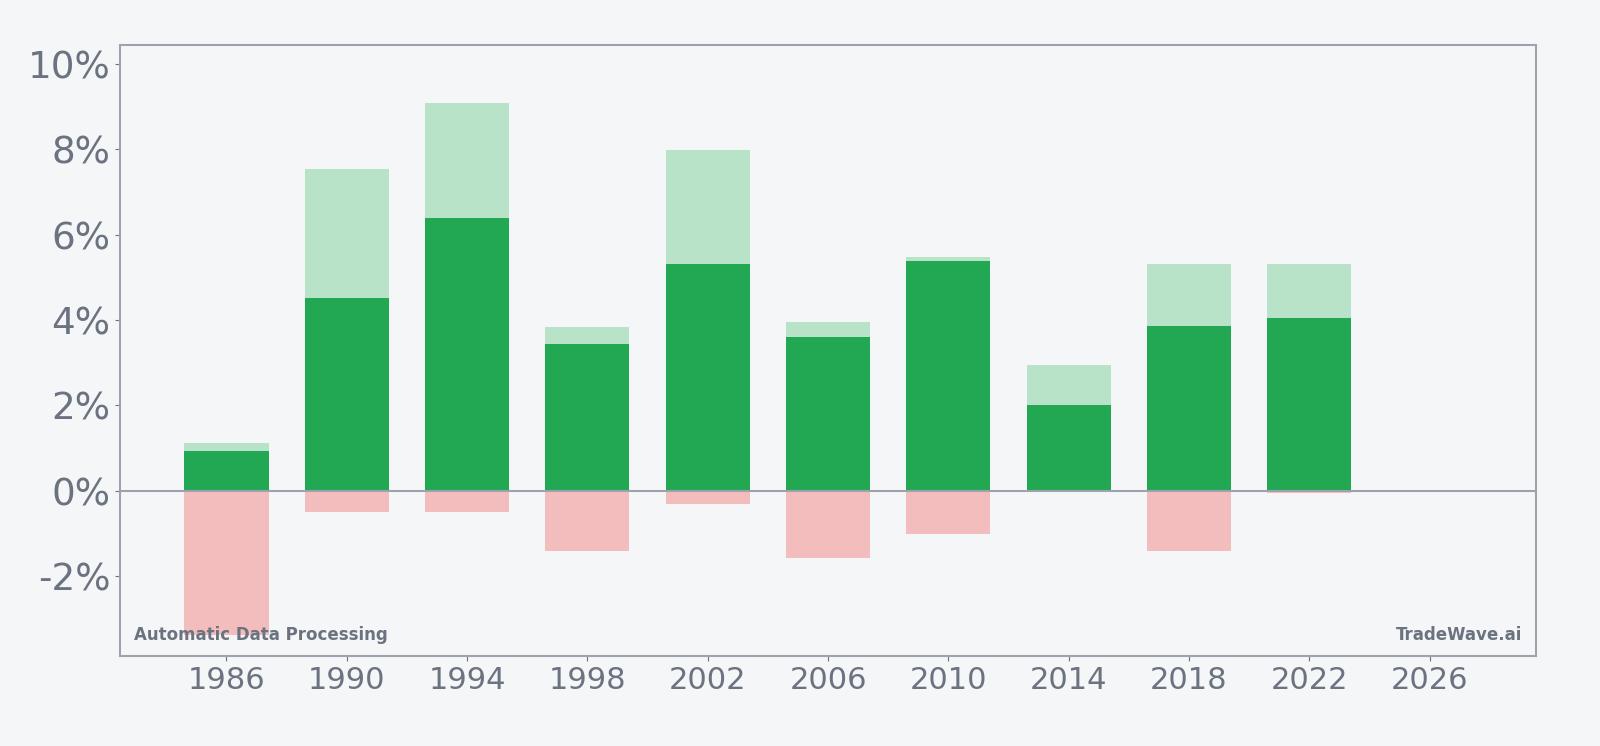
The average profile across all 10 years shows that while the final results have been consistently positive, the path has not always been smooth. Maximum favorable excursions have at times reached between roughly 5% and 9% in stronger years, while maximum adverse excursions have occasionally pushed a few percentage points against the trade before the pattern resolved higher. That combination points to a window where upside has historically dominated, but where short‑term volatility and pullbacks have still been part of the story.
A combined view of net results, peak rallies and worst drawdowns by year highlights how upside and downside have interacted within this window.
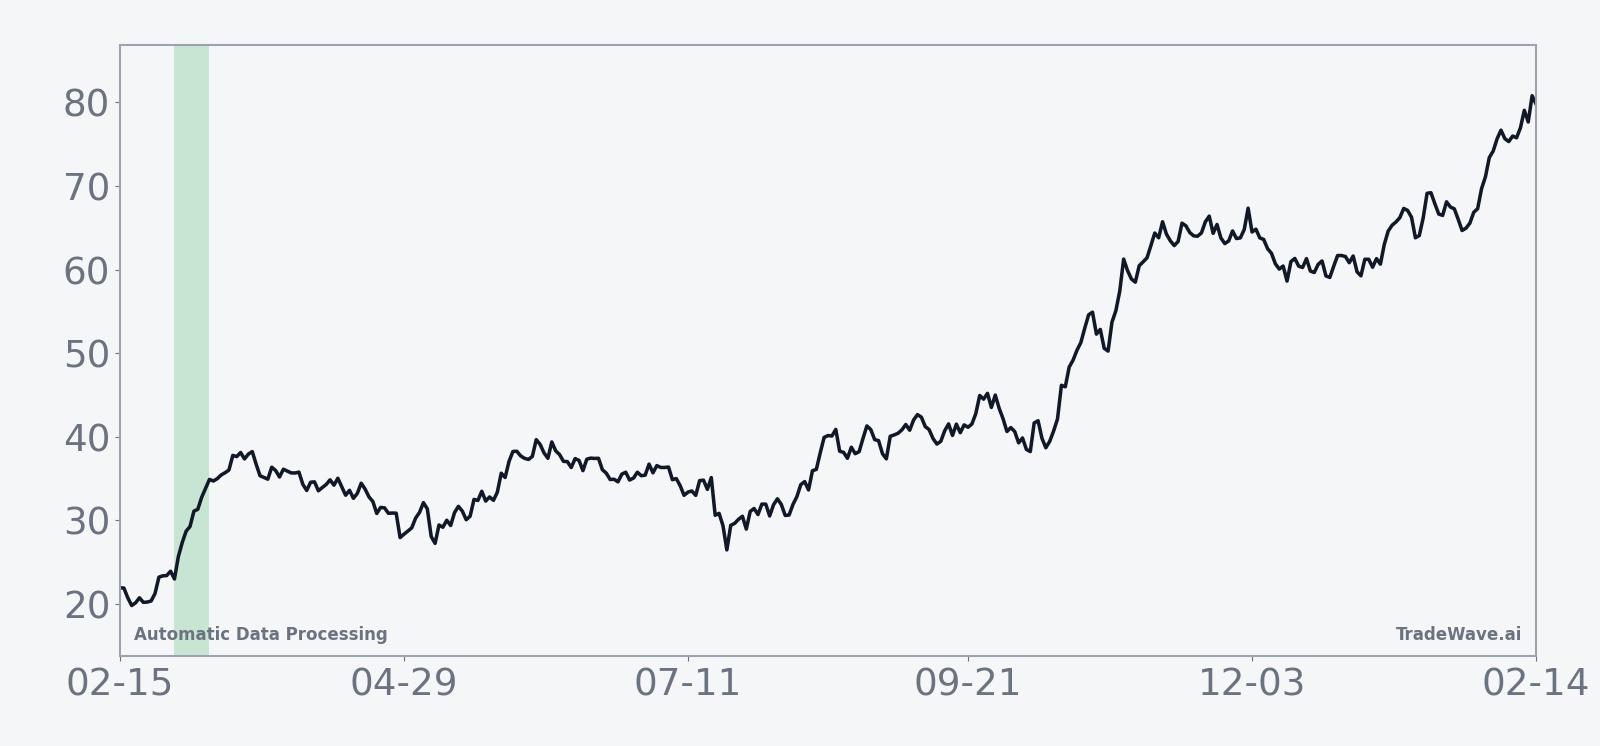
The cumulative return chart for this pattern, which aggregates outcomes across all 10 midterm election years, reinforces the impression of a steady bias higher rather than a few outlier wins. Gains have tended to accrue over the course of the window instead of arriving in a single spike, although the exact timing of stronger days has varied from cycle to cycle. Taken together, the historical pattern defines the quantitative seasonal backdrop for the current period.
History does not guarantee future results, and adverse excursions can still be meaningful even in windows where all past years finished higher.
Price and near-term drivers
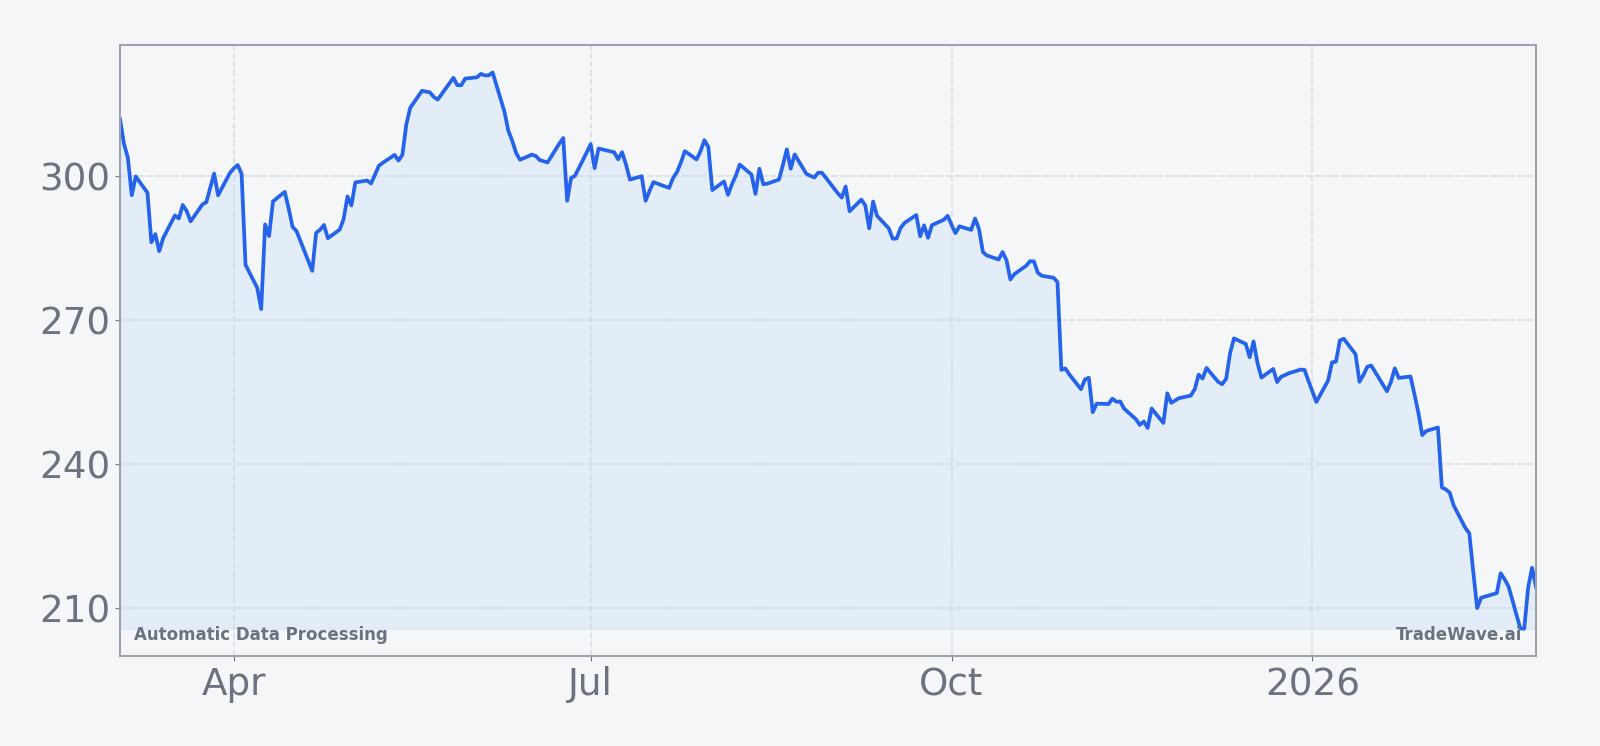
Automatic Data Processing ended the latest session at 214.36, down 1.83% on the day, after trading between 208.92 and 215.80 on volume of about 4.9 million shares. That leaves the stock near the upper end of its past‑year range, with investors balancing its role as a steady payroll and HR services provider against shifting expectations for economic growth and interest rates.
As a large, established component of the S&P 500, ADP often trades as a proxy for the health of the labor market and corporate hiring budgets. The company’s recurring revenue base and exposure to employment trends can make it sensitive to changes in rate expectations and macro data, particularly in a midterm election year when fiscal and regulatory debates can influence business confidence. For investors watching the upcoming seasonal window, the current price level and volatility backdrop provide important context for how any historical tendency might interact with real‑time news flow.
The chart below situates the latest move in its recent multi-month context.
Macro and election-cycle backdrop
The calendar places this pattern in the early part of the midterm election year, a phase that often brings renewed focus on fiscal policy, regulation and the trajectory of interest rates. For a company like ADP, which processes payrolls and provides HR services across industries, shifts in hiring plans and wage dynamics can be closely tied to how businesses perceive the policy environment and the broader economic outlook.
Midterm years have historically been a “two‑playbook” period for markets, with choppier behavior early in the year as policy debates intensify, followed by a clearer trend as investors gain visibility on the path toward the next presidential election. The fact that ADP’s upcoming 10‑day window has historically been positive within this early‑year context suggests that, in prior cycles, the stock has often managed to grind higher even as macro headlines remained noisy.
What to watch as the window approaches
As the Mar 1 start date nears, traders and longer‑term investors alike will be watching how ADP behaves relative to its historical pattern. One focus will be whether the stock can hold above recent support levels if macro data or policy headlines introduce volatility, given that past years have sometimes featured meaningful intraperiod drawdowns before the window ultimately resolved higher.
Another key item will be the interaction between ADP’s price action and the broader policy calendar. Labor‑market releases, inflation data and any signals on the future path of interest rates could all influence how closely this year tracks the historical seasonal tendency. A firm tone with contained downside during the window would be more consistent with the past pattern, while a sharp break lower or unusually muted trading would represent a departure from prior midterm election years.
Finally, investors may monitor whether sector flows into defensive, cash‑generative names like ADP persist as the midterm year unfolds. If the stock continues to attract demand during bouts of macro uncertainty, that could reinforce the historical tendency for this early‑March window to skew positive. If, instead, flows rotate decisively toward higher‑beta areas of the market, the seasonal backdrop may take a back seat to broader risk‑on or risk‑off dynamics.
Sources
- [1] Forbes, “NVIDIA Bailed — Should You Buy The Dip In APLD Stock?”, Feb 18, 2026. Link
- [2] The Motley Fool, “Applied Digital Shares Surge on Bright Outlook. Is It Too Late to Buy the Stock?”, Jan 11, 2026. Link
- [3] CNBC, “Applied Digital stock climbs 16% as AI demand fuels data center growth”, Oct 10, 2025. Link