RBC Buy Rating Meets a Perfect 8-for-8 Midterm Spring Record for EOG Resources (EOG)
EOG Resources is stepping into a 43-day midterm-year window that has never produced a loss in the past eight cycles, just as shares hover near a 52-week high.

Key takeaways
- EOG Resources is entering a 43-trading-day midterm election year window starting Mar 5 that has produced gains in all 8 prior cycles.
- The pattern is long-biased, with 100% Percent Profitable, 8 winners and 0 losers, and an average profit of 7.95% across those years.
- Historically, the strongest individual year in this window delivered a 10.69% gain, while the weakest still finished up 4.15%.
- Intraperiod swings have been meaningful, with some years seeing double-digit peak run-ups and adverse moves approaching 10% before finishing higher.
- Today’s close at 130.25 leaves EOG about 0.8% below its 52-week high of 131.32, after a 15.75% gain over the past month.
- History points to a bullish seasonal bias, but the size of past drawdowns inside the window means risk management still matters.
According to historical data from TradeWave.ai, this specific slice of the midterm election year has behaved very differently from an average spring for EOG Resources, and the next iteration begins today.
Seasonal window
EOG Resources has risen in all 8 midterm election years captured in this 43-day window, averaging 7.95% gains. The new window begins Mar 5 with the stock at 130.25, about 0.8% below its 52-week high of 131.32 after a 15.75% one-month rally.
Grouping the data by the presidential election cycle matters here because midterm years often bring a different policy and liquidity mix than election or pre-election years. For energy producers like EOG, that mix can show up in drilling plans, capital spending and how investors price commodity swings into equities.
This seasonal window begins on Mar 5 and spans 43 trading days, covering the early part of the midterm election year across the last eight cycles. The trade direction is long, and every one of those eight midterm-year windows finished positive, with 8 winners and 0 losers and a 100% Percent Profitable record. Average profit of 7.95% means that, across all years in the sample, EOG ended the window almost 8% higher than where it started.
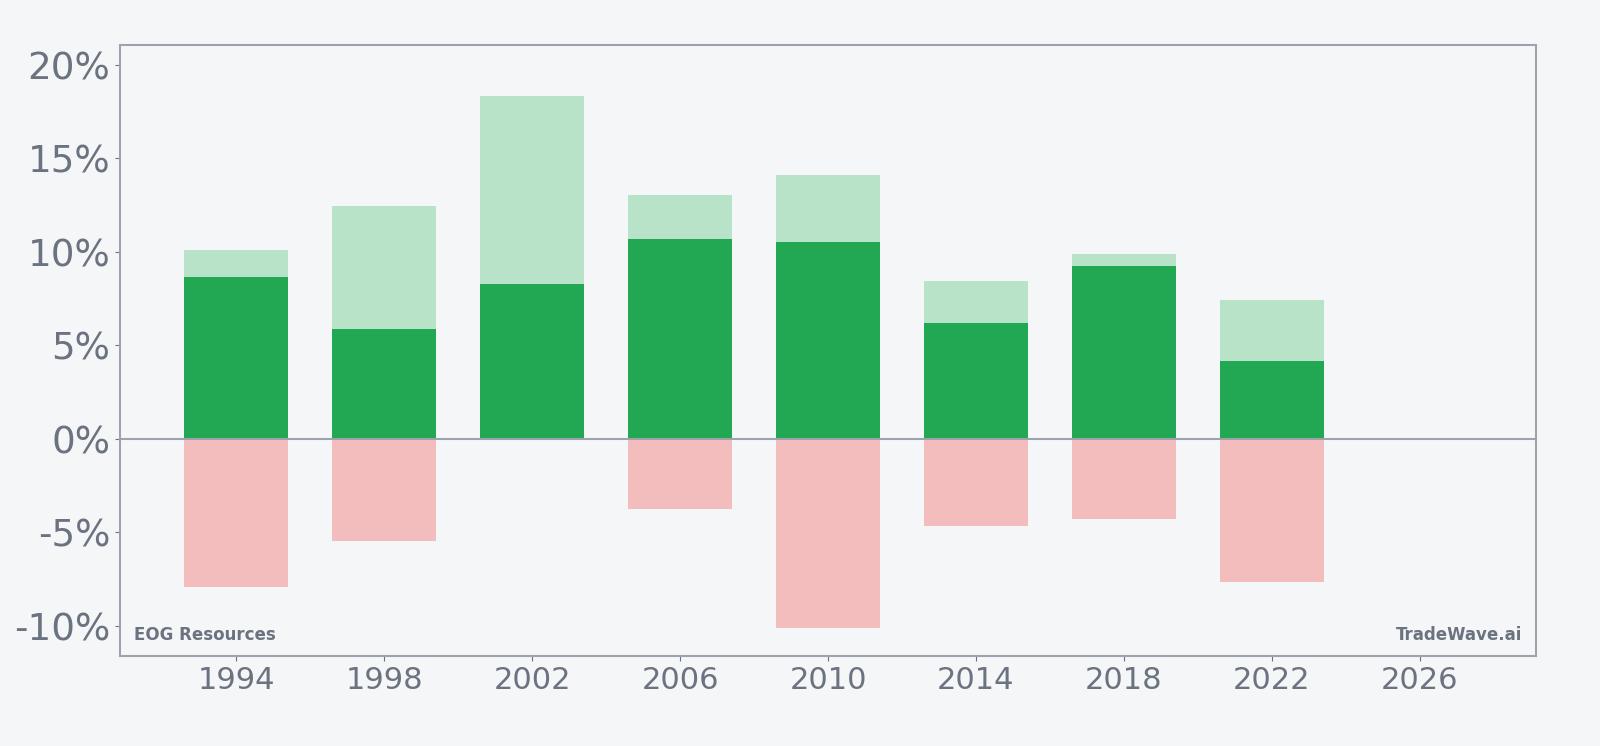
The distribution of outcomes has been tight for a pattern with this kind of win rate. The median profit of 8.46% sits close to the average, and the weakest year in the sample, 2022, still delivered a 4.15% gain from entry to exit. On the high side, 2006 and 2010 stand out with net returns of 10.69% and 10.52% respectively, showing that double-digit moves have not been rare in this stretch.
Intraperiod swings have been real, even in winning years. In 2010, for example, EOG’s best point-to-peak move inside the window, known as the maximum favorable excursion, reached 14.1%, while the worst drawdown from entry, or maximum adverse excursion, hit -10.12% before the stock recovered to finish higher. Other years show a similar pattern of sizable upside runs paired with mid-window pullbacks.
The TradeWave Ratio (TWR) for this pattern is 3.2. TradeWave Ratio (TWR) reflects how far price typically travels in the trade direction within the window regardless of the final close. A Sharpe ratio of 3.21, based on end-of-window outcomes, points to historically strong risk-adjusted returns for this specific seasonal slice compared with the volatility of those outcomes.
Looking at individual years, 2002 is a good example of a smooth ride, with an 8.3% net gain, a 18.32% peak run-up and only a 0.61% worst drawdown from entry. By contrast, 1994 and 2010 both saw adverse moves near or above -8% at some point in the window, reminding traders that even a pattern with no historical losers can involve uncomfortable swings before the final tally.
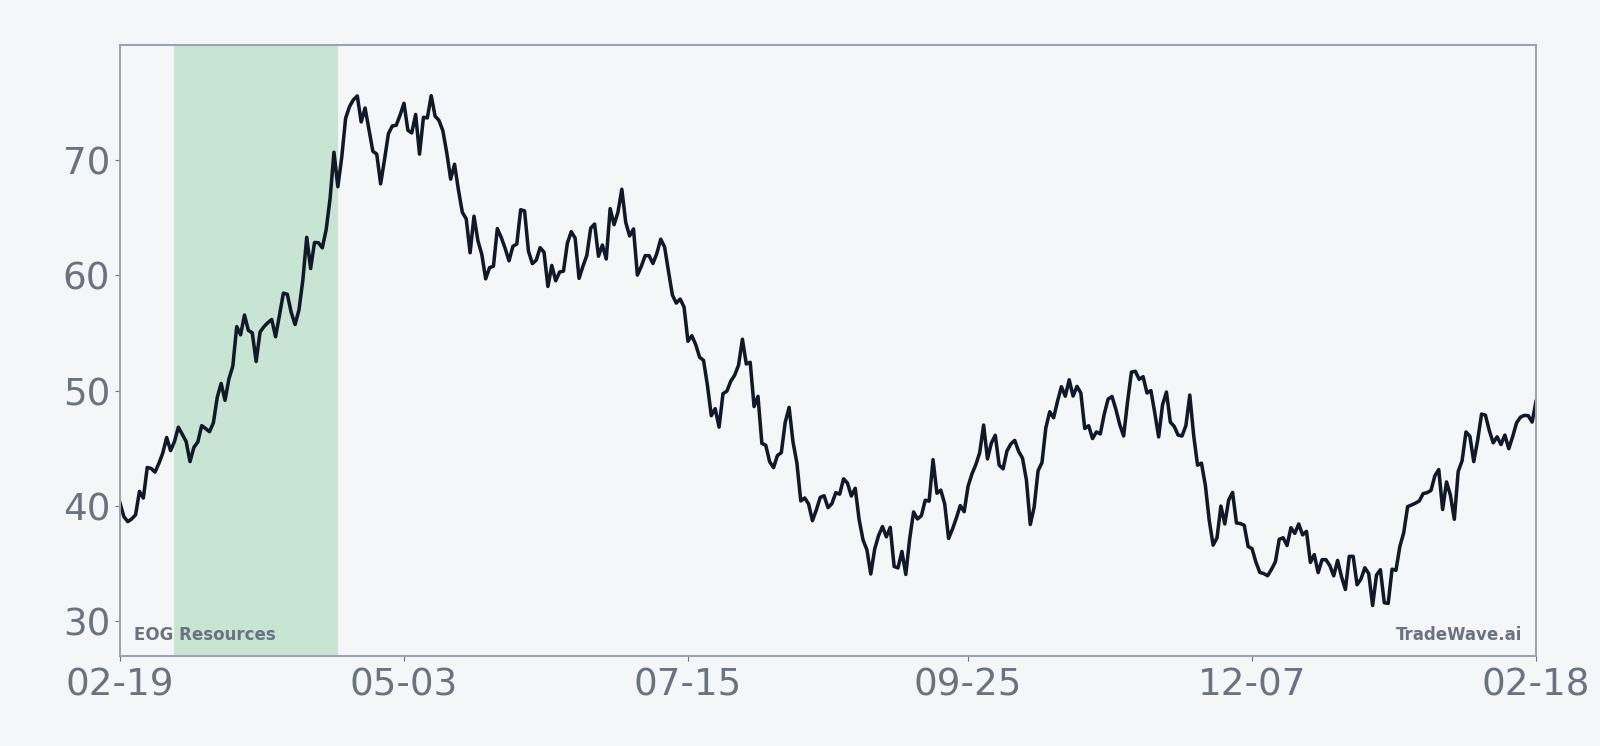
The historical seasonal trend chart for this window shows a tendency for gains to build steadily rather than in a single burst. On average, EOG has tended to grind higher through the middle of the window, with the cumulative line rising more consistently after the first couple of weeks and finishing the period near that 8% mark.
The cumulative return profile across the eight midterm-year samples reinforces that picture. Add it up and the pattern delivers an 84% cumulative gain across those windows, with few stretches where the average path gives back much of the progress. The standard deviation of 2.34% suggests that, historically, outcomes have clustered reasonably tightly around that mid-single to low-double-digit gain zone.
Put together, the message from the seasonal data is straightforward: in the last eight midterm election years, this 43-day window has been a consistently favorable stretch for long exposure to EOG Resources, albeit with intraperiod drawdowns that can test conviction.
Year-by-year bars with peak run-ups and worst drawdowns show how consistently the window has favored longs while still delivering sizable swings.
History does not guarantee future results, and even in a window with no past losers, adverse excursions inside the period have at times approached double digits.
Price and near-term drivers
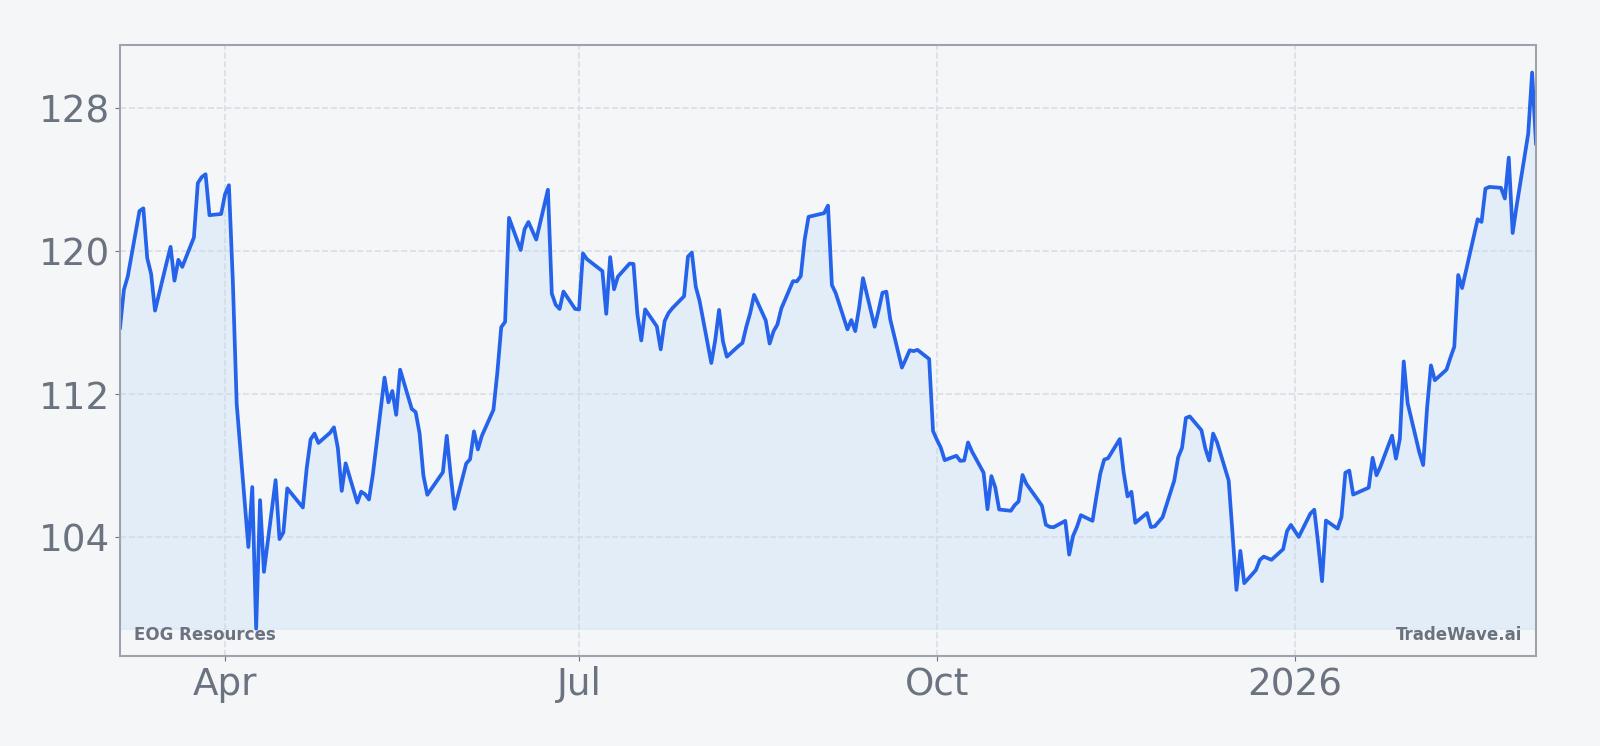
EOG Resources closed Thursday at 130.25, up 1.9% on the day, extending a 15.75% gain over the past month and leaving the stock just under its 52-week high of 131.32. Trading volume of about 640,000 shares was light compared with the 20-day average of roughly 5.66 million, suggesting the latest push higher has come without a surge in activity.
The stock’s climb into this seasonal window follows a year in which EOG has leaned on production growth and capital discipline to support shareholder returns. In August 2025, the company agreed to acquire Encino for $5.6 billion and raised its annual production forecast, saying the deal would be accretive to free cash flow and help fund dividends and buybacks.[1] Around the same time, EOG reported adjusted second-quarter income of $2.32 per share, topping estimates of $2.21 as output reached 1.13 million barrels of oil equivalent per day.[1]
Management also lifted the quarterly dividend by 5% to $1.02 per share in October 2025, implying an annualized yield of 3.8% at the time and underscoring its pitch as a cash-return story within the energy production space.[1] Analysts tracked by RBC Capital via TipRanks have maintained a Buy consensus rating, reflecting confidence that higher production and disciplined spending can support earnings and distributions even through commodity swings.[1]
Sector-wise, EOG’s focus on oil and gas production, combined with its acquisition-driven scale, positions it to benefit when crude prices are firm and investors favor cash-generative producers over more speculative plays.[1] That backdrop helps explain why the stock is pressing against its highs as the midterm-year seasonal window opens, with the market already rewarding balance-sheet strength and visible free cash flow.
The chart below situates the latest move in its recent multi-month context.
What to watch in this window
For the next 43 trading days, the key question is whether EOG behaves anything like its prior midterm-year playbook. Traders will be watching how the stock handles the 131 to 132 area around the 52-week high, and whether any early pullbacks stay contained relative to the kind of mid-window drawdowns that have appeared in past cycles.
On the fundamental side, updates on drilling activity, integration of the Encino assets and any tweaks to production or capital-spending plans could influence how much of the historical upside the stock can realistically chase in this stretch.[1] Any shift in management’s stance on dividends or buybacks would also matter, given how central cash returns have been to the EOG story.
From a seasonal perspective, behavior inside the window will be telling. A pattern of higher lows and steady grind higher would rhyme with the historical average path. A sharp break below recent support, especially if accompanied by heavier volume, would mark a clear departure from the last eight midterm-year windows and signal that macro or company-specific forces are overpowering the usual calendar effect.
For now, the setup is simple: EOG Resources is entering a midterm-year window that has been 8-for-8 for longs, with an average gain near 8%, just as the stock trades near its highs. Whether this cycle keeps that streak alive will depend on how the company executes and how energy markets evolve as the political and policy calendar for the midterm year unfolds.