Dow Jones Industrial Average (DJI) Has Rallied in 10 of 10 Long Spring Windows
Dow Jones Industrial Average has just slipped from record territory as it moves into a 271-day stretch that has delivered double-digit average gains over the past decade, raising the stakes for how this year’s pullback plays out.

Key takeaways
- Dow Jones Industrial Average is entering a 271-day seasonal window that has produced gains in all 10 of the past years, with an average profit of 10.25% for long exposure.
- The window starts around early March and runs through late in the following year’s winter, capturing a long stretch where industrials and cyclicals have often led the tape.
- Percent Profitable stands at 100%, with 10 winners and 0 losers across the lookback, and a Sharpe ratio of 1.63 that signals unusually strong risk-adjusted returns for this regime.
- The TradeWave Ratio of 2.7 points to meaningful intraperiod travel in the trade direction, while past years have still seen sizable drawdowns inside the window before finishing higher.
- DJI just closed at 47,501.55, about 6.0% below its 52-week high of 50,512.79, after a 0.9% daily drop that clipped its latest record run.
- History shows this window has tended to reward patience on the long side, but the worst intraperiod drawdowns have topped 20% in shock years, so risk management still matters.
According to historical data from TradeWave.ai, this is not just another calendar stretch for the Dow. The next section looks at how this specific 271-day window has behaved across the past decade and what that backdrop means for today’s pullback.
Seasonal window
Dow Jones Industrial Average has finished higher in this 271-day window in 10 of 10 years since 2016, with long exposure averaging a 10.25% gain. The latest iteration began on Mar 6 and finds the index at 47,501.55, about 6.0% below its 52-week high of 50,512.79 after Friday’s 0.9% slide.
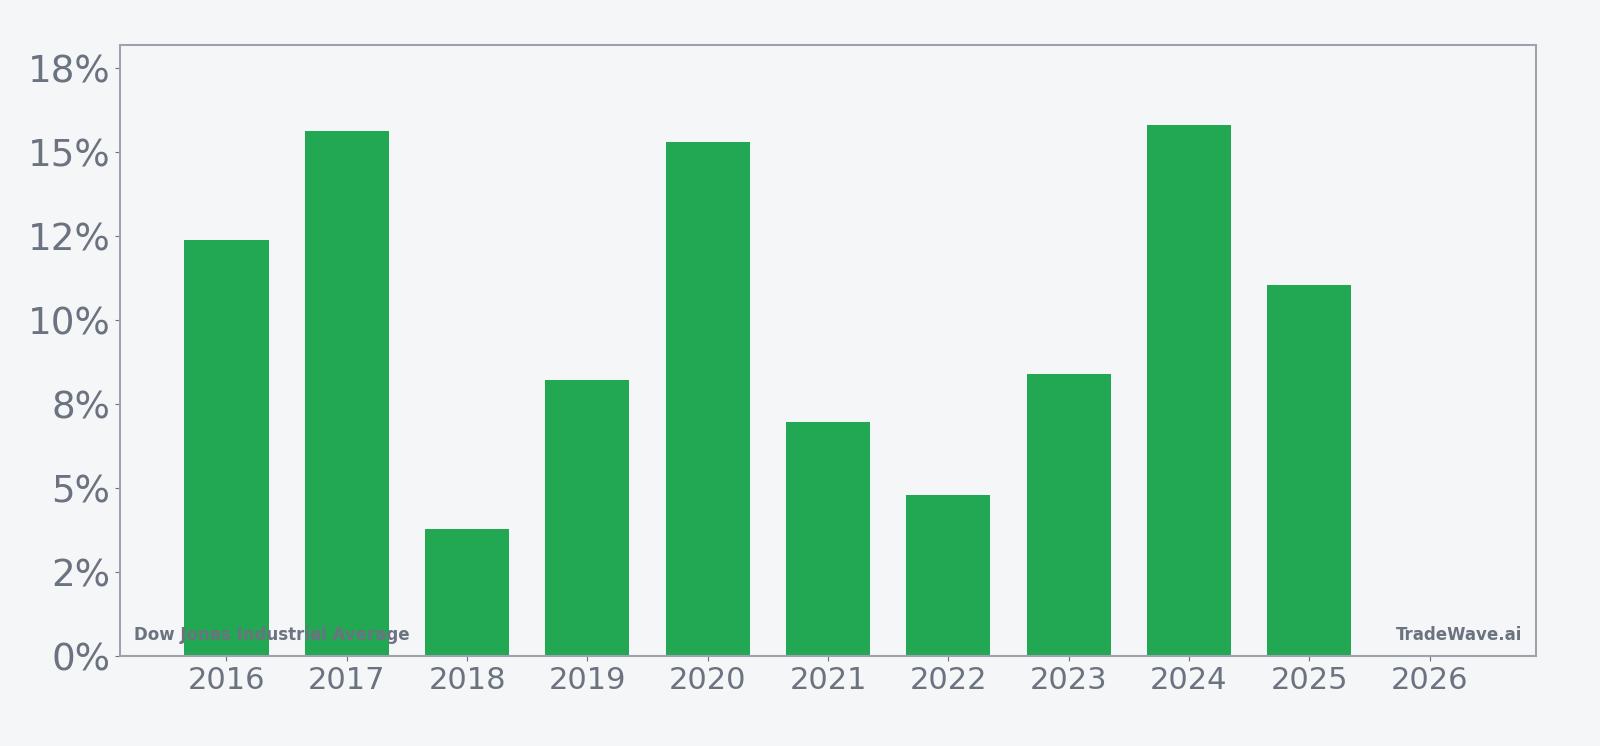
Across the decade, the pattern has been consistently friendly to long positions. The weakest year in the sample, 2018, still finished up 3.79%, while the strongest, 2024, delivered a 15.83% gain from entry to exit. Several years, including 2017, 2020 and 2024, posted mid-teens returns, which helps push the cumulative gain for this window to 163% and the annualized return to 10.16%.
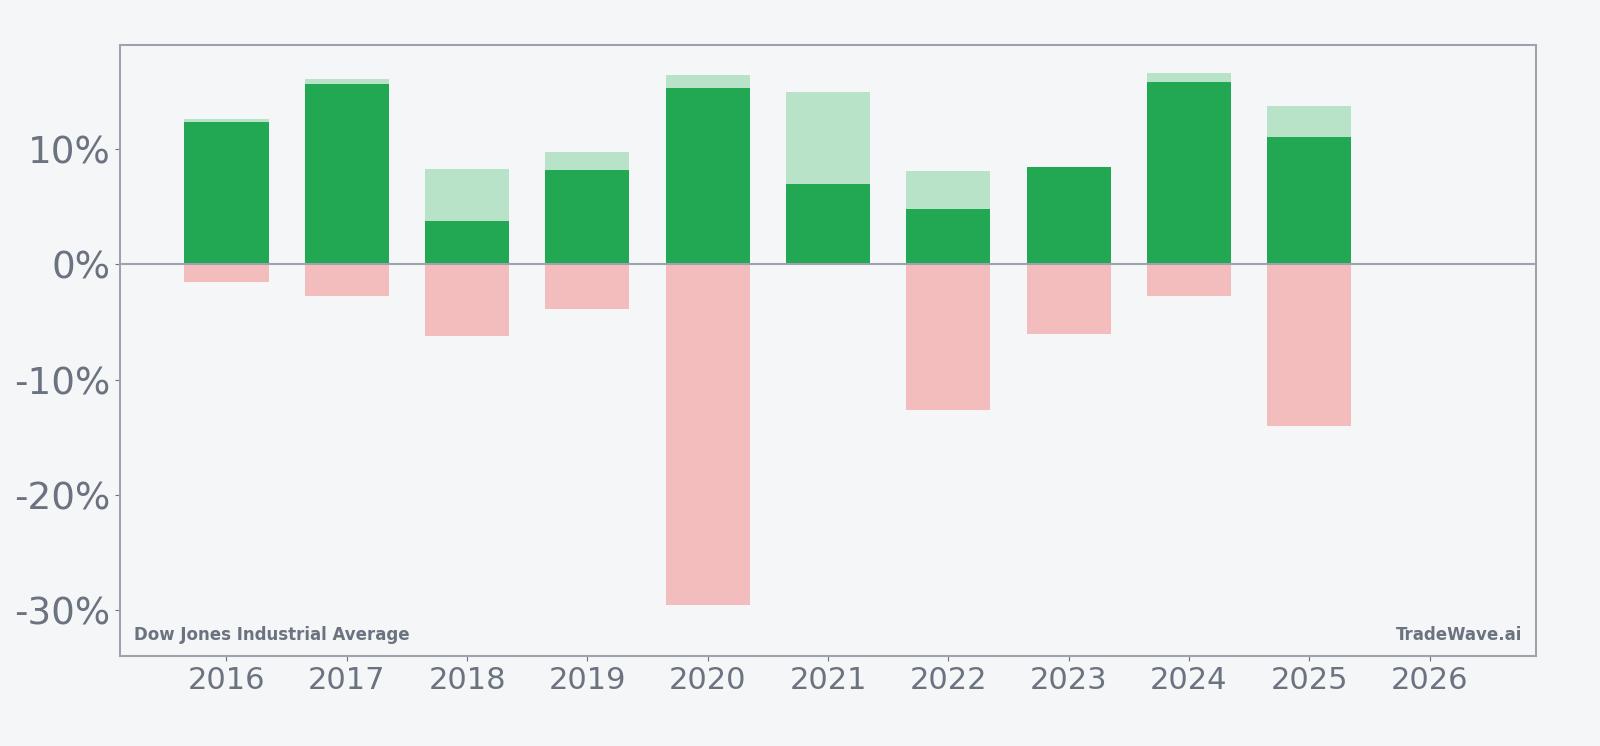
The intraperiod path has not been smooth. In 2020, the index suffered a worst drawdown of 29.58% from the entry point before recovering to finish the window up 15.31%. In 2022, the worst adverse move reached 12.67% even though the final result was a 4.81% gain. That mix of strong finishes and deep interim dips is exactly what the maximum favorable and maximum adverse excursions are flagging.
On the upside, the best intraperiod rallies have often stretched beyond the final net result. In 2024, the best point-to-peak move inside the window reached 16.58% versus a 15.83% close-to-close gain. In 2017, the best run-up hit 16.1% with a final profit of 15.64%. That pattern of strong rallies with only modest giveback is one reason the Sharpe ratio for this regime sits at 1.63, unusually high for a broad equity index.
The 10-year seasonal trend line for this window slopes steadily higher rather than relying on one or two outlier years. Early portions of the window have tended to be choppier, with several episodes where the index dipped meaningfully before the longer grind higher took over. Later in the window, the average path shows gains consolidating rather than reversing sharply, which has historically rewarded investors who stayed with the move.
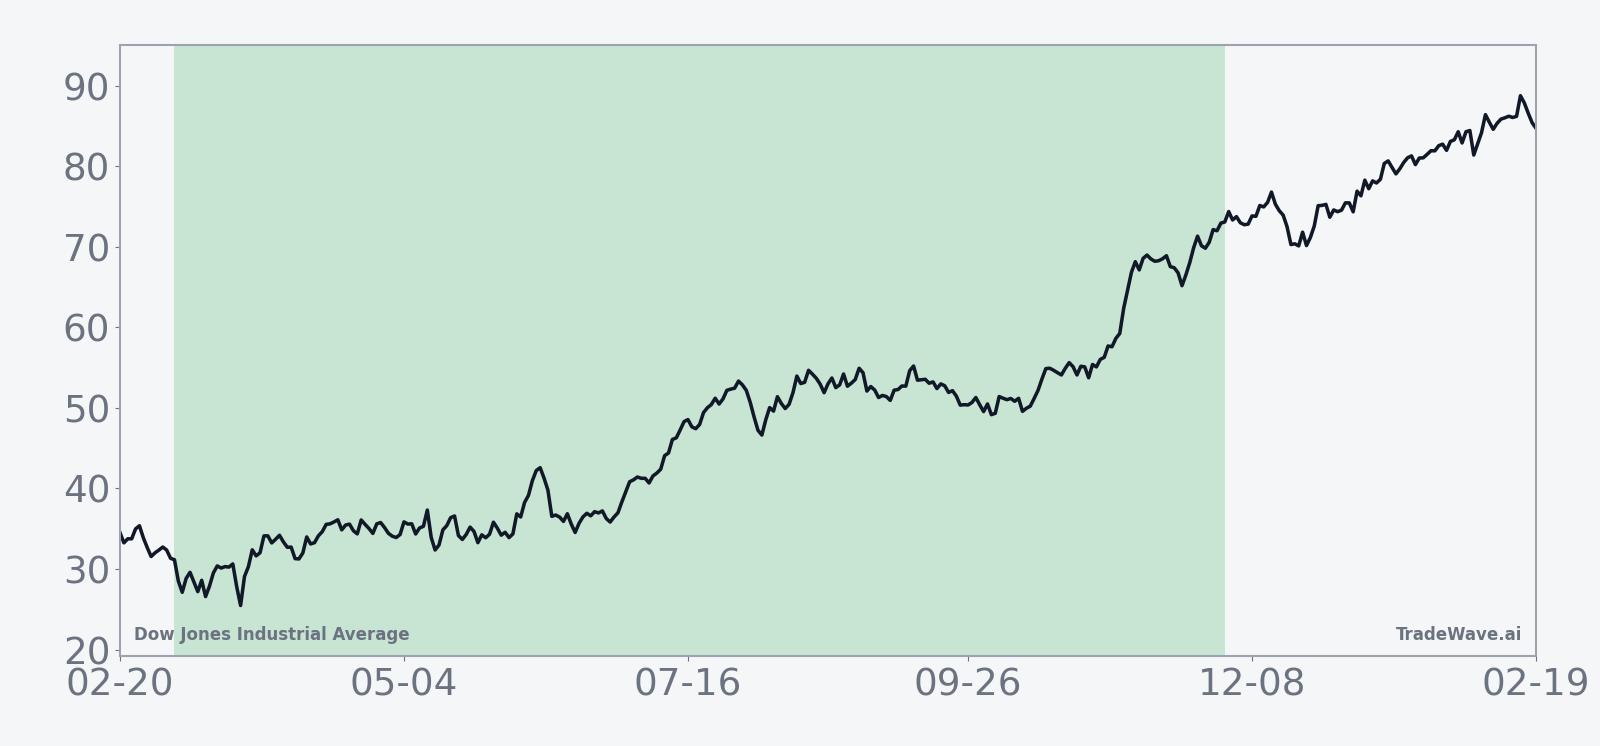
Year-by-year net returns and intraperiod swings show how often the Dow has finished higher even after sizable drawdowns.
History does not guarantee future results; adverse excursions can be large even in winning windows, so the path can be far rougher than the final return suggests.
Price and near-term drivers
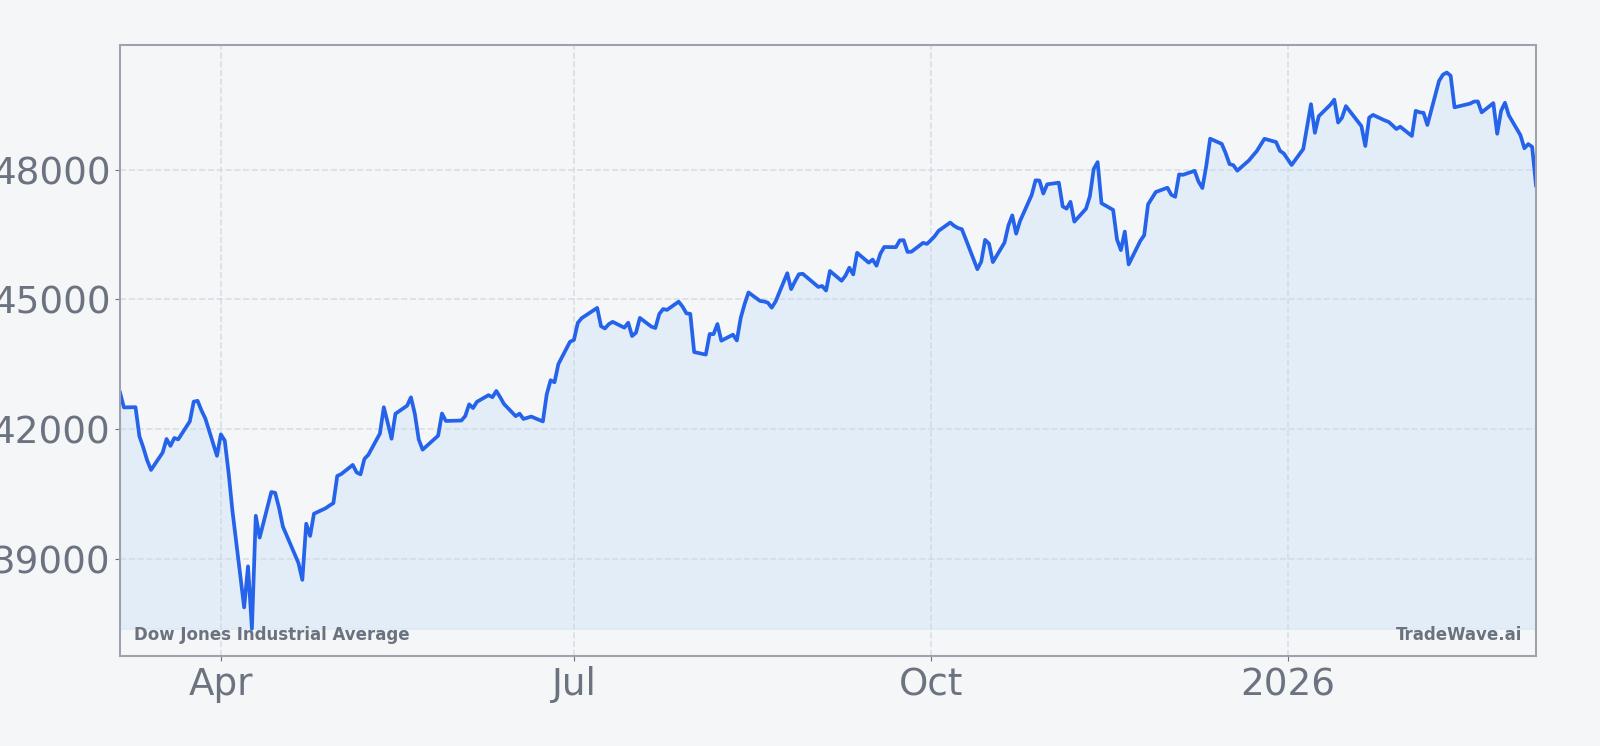
Dow Jones Industrial Average closed Friday at 47,501.55, down 453 points or 0.9% on the day, leaving it about 6.0% below its 52-week high of 50,512.79 and roughly 3.0% above its 52-week low of 36,611.78. The index has slipped 2.88% over the past month, even as 20-day average volume sits near 595 million shares and price holds above the 50-day moving average around 49,117, a sign that the latest pullback is still modest relative to the past year’s uptrend.
That uptrend has been punctuated by sharp rotations. In Nov 2025, the Dow hit a record high as investors shifted out of mega-cap AI winners and into more traditional sectors such as healthcare and energy, giving the price-weighted index an edge over the broader S&P 500 for a stretch.[2] In Dec 2025, a slide in JPMorgan weighed on the Dow ahead of a Federal Reserve decision, underscoring how single heavyweight components can tug the benchmark even when the broader market is steadier.[3]
By early Jan 2026, the index was back at record levels despite geopolitical tensions, with industrial names showing resilience as investors looked through headlines and focused on earnings power.[3] That resilience has been helped by a macro backdrop where traders still expect the Fed to adjust rates in ways that support growth-sensitive sectors, even if the exact timing of cuts remains in flux.[1] The latest dip from the highs comes against that backdrop of strong absolute levels and ongoing debate about how much good news is already priced in.
The chart below situates the latest move in its recent multi-month context.
What to watch in this window
The combination of a fresh pullback from records and a long seasonal window that has never finished lower in the past decade puts the Dow in a delicate spot. Bulls will argue that a 6% gap to the 52-week high is modest in the context of a regime that has historically delivered double-digit gains from early March entries. Bears will point to prior years like 2020 and 2022, where the worst intraperiod drawdowns were far deeper than anything seen so far in 2026.
First, watch how breadth behaves inside the index. In prior strong years, gains in the Dow have often coincided with leadership from industrials, energy and other economically sensitive groups rather than a narrow set of components.[2] If the current window is going to rhyme with that history, rallies from those sectors will likely need to reassert themselves after the latest bout of profit-taking.
Second, keep an eye on the relationship between the Dow and the broader large-cap complex. When investors rotated away from the S&P 500’s top winners in late 2025, the Dow’s more balanced sector mix helped it outperform.[2] A repeat of that pattern during this window would fit the historical script of the index grinding higher even as leadership shifts under the surface.
Third, the macro calendar matters. Episodes like the Dec 2025 JPMorgan-driven wobble around Fed meetings show how quickly rate expectations and bank moves can spill into the Dow.[3] If upcoming policy decisions or geopolitical headlines trigger volatility, the historical record suggests the index can absorb sizable drawdowns inside this window and still finish higher, but the ride can be rough.
Finally, price levels themselves are a simple but powerful tell. A sustained break below the 50-day moving average near 49,117, especially if accompanied by heavier volume than the recent 20-day norm, would signal that this year’s path through the window may lean more toward the choppier years in the sample. Holding above that band and rebuilding toward the 52-week high would be more in line with the smoother, mid-teens gain years that have defined the top of the historical range.
Put together, the message from the past decade is clear but not absolute. The Dow has a strong track record of rewarding long exposure from early March through the following winter, yet some of the best final outcomes have come only after investors sat through sharp interim swings. How the index trades around key levels and sector rotations in the coming weeks will show whether 2026 is shaping up to be another textbook run through this powerful seasonal window or a tougher outlier.
Sources
- [1] Seeking Alpha, "Wall Street moves lower as investors digest retail earnings and Fed minutes," Aug 20, 2025.
- [2] MarketWatch, "Dow’s banner day points to investor pivot beyond S&P 500’s top winners," Nov 11, 2025.
- [3] The Wall Street Journal, "JPMorgan’s Stock Slide Weighs on Dow Industrials," Dec 9, 2025.