Santander’s $12.3B Webster Bank (WBS) Deal Collides With a Perfect 10-for-10 Short Run
Webster Bank is trading just below its 52-week high as it approaches a 29-day seasonal stretch that has historically favored short sellers, only weeks after Santander’s $12.3 billion takeover deal jolted the stock.

Key takeaways
- A 29-day seasonal window for Webster Bank starting Mar 13 has produced 10 winners and 0 losers for a short trade over the past decade.
- Average profit for those short setups is 7.39%, with a cumulative 102% gain across the 10-year sample.
- The pattern’s Trade Direction is short, with a TradeWave Ratio of 1.26 and a Sharpe ratio of 1.43, pointing to a historically efficient downside window.
- Intraperiod swings have been sharp, with some years showing double-digit peak gains for shorts but also sizeable adverse moves before the trade paid off.
- Today WBS trades at $68.50, about 7.4% below its 52-week high of $74.00, after spiking 9% on Santander’s takeover announcement in early February.[1]
- With Webster set to become a Santander unit, deal progress and regulatory headlines could collide with this historically weak stretch for the stock price.
According to historical data from TradeWave.ai, this upcoming period has behaved very differently from an average month on Webster Bank’s calendar. The next section looks at how that pattern has played out across the past decade and what it means for traders watching the stock into spring.
Seasonal window
Webster Bank has delivered a profitable short trade in all 10 of the past years during this 29-day window, with average gains of 7.39% for the short side. The next iteration begins on Mar 13, with the stock currently at $68.50 and sitting about 7.4% below its 52-week high of $74.00.[1] That combination of a strong historical downside bias and a price still near the top of its one-year range gives this window unusual weight for anyone trying to handicap how the Santander deal premium might trade off in the weeks ahead.
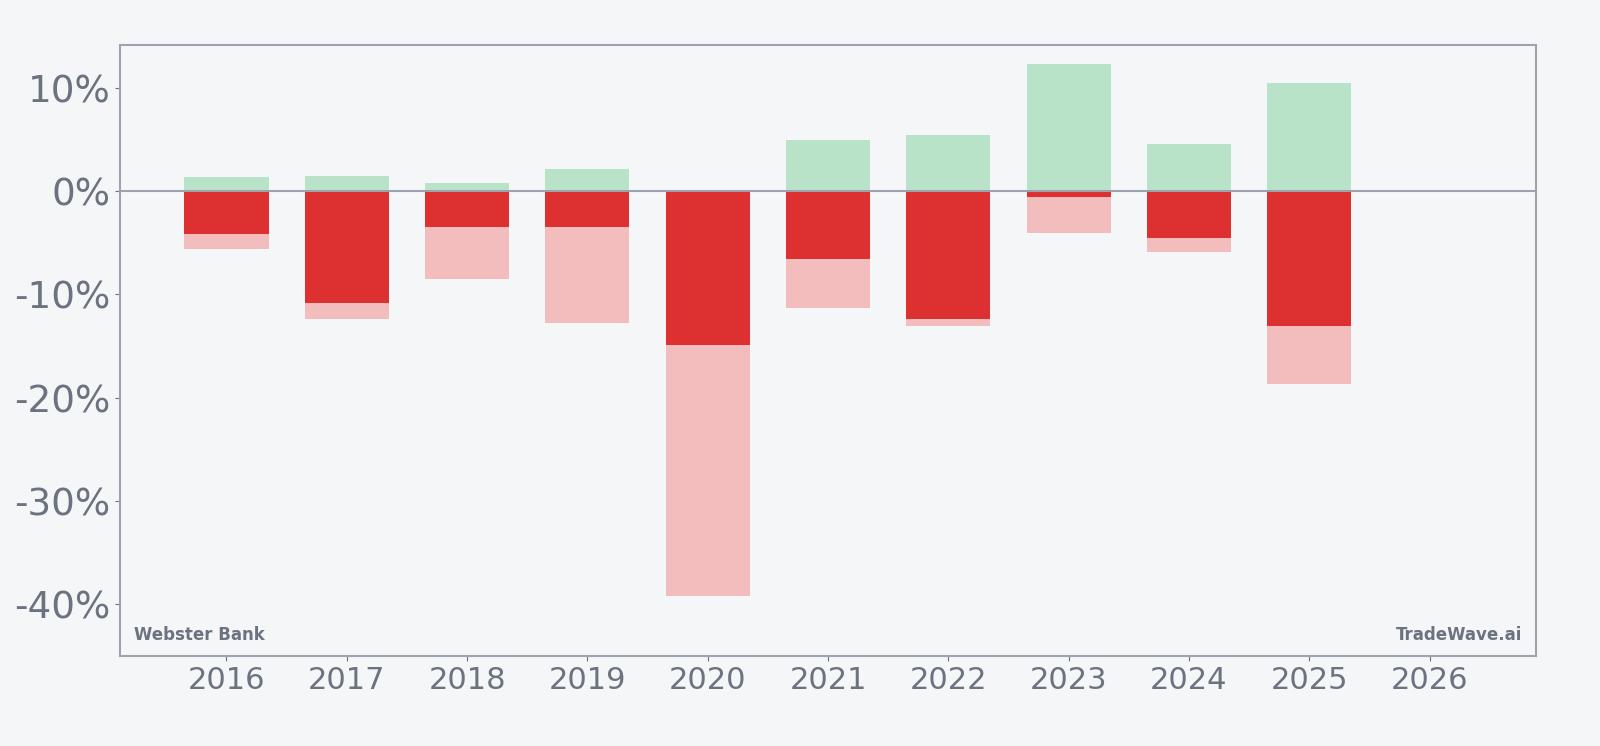
A stacked view of net results alongside best and worst intraperiod swings shows how often shorts had to sit through turbulence before getting paid.
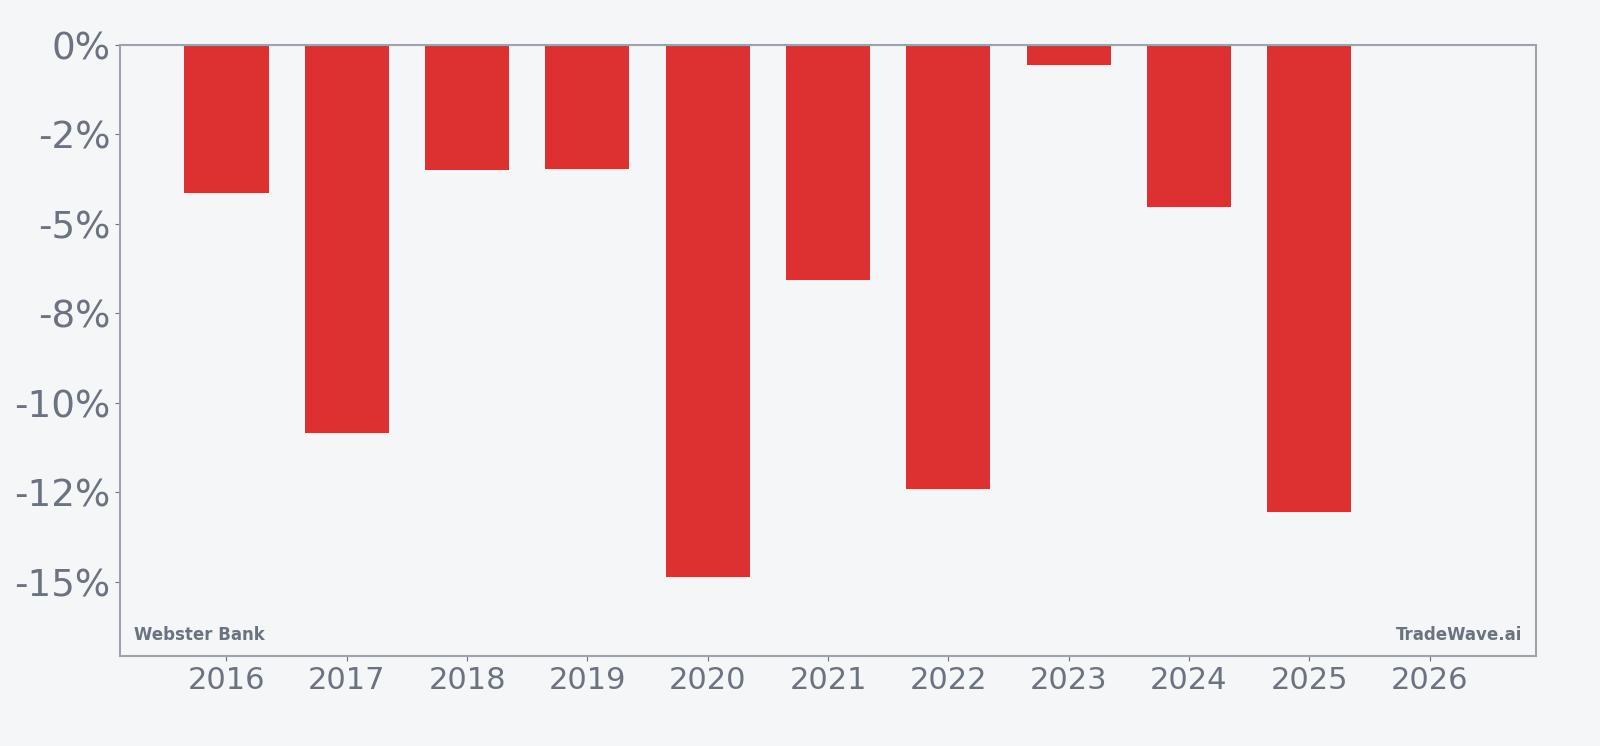
Historically this has been a cleanly directional short window. Percent Profitable sits at 100%, with 10 winners and 0 losers, and the average profit of 7.39% for the short side lines up with a 102% cumulative gain across the decade. In plain terms, every year in the sample saw Webster finish the 29-day stretch lower than where it started, which is exactly what a short seller wants.
The distribution of outcomes is not gentle. The strongest year for the pattern was 2020, when a short entered around $24.31 and exited near $20.70, a net move of about 14.86% in favor of the trade, but that same window saw a worst intraperiod drawdown of roughly 39.2% from entry, underscoring how violent the path was. At the other end of the spectrum, 2023 barely moved on a net basis with a 0.56% gain for shorts, yet the best intraperiod move reached 12.33% and the worst drawdown was about 4.05%, a reminder that even “flat” years have offered both squeezes and air pockets.
The maximum favorable excursion, or MFE, captures the best point-to-peak move for the short during each year’s window, while the maximum adverse excursion, or MAE, tracks the worst drawdown from the entry. In several years, such as 2017 and 2022, MAE readings in the low to mid-teens show that shorts often had to tolerate double-digit rallies against them before the trade ultimately worked. The TradeWave Ratio of 1.26 indicates that, on average, price has tended to travel meaningfully in the trade direction within the window, not just drift to a small net change.
The ten-year average trend line suggests that profits for shorts have typically built gradually rather than arriving in a single crash. The curve slopes in favor of the short side across most of the 29 days, with a tendency for deeper gains to show up in the back half of the window. That pattern fits with the per-year bars, where several of the larger net wins cluster in years when the stock was already under pressure from broader macro or bank-specific stress.
Add it up: this is a rare case where every historical iteration of the window has rewarded the same directional bet, but the path has often been rough. History does not guarantee future results; adverse excursions can be large even in winning windows.
Price and near-term drivers
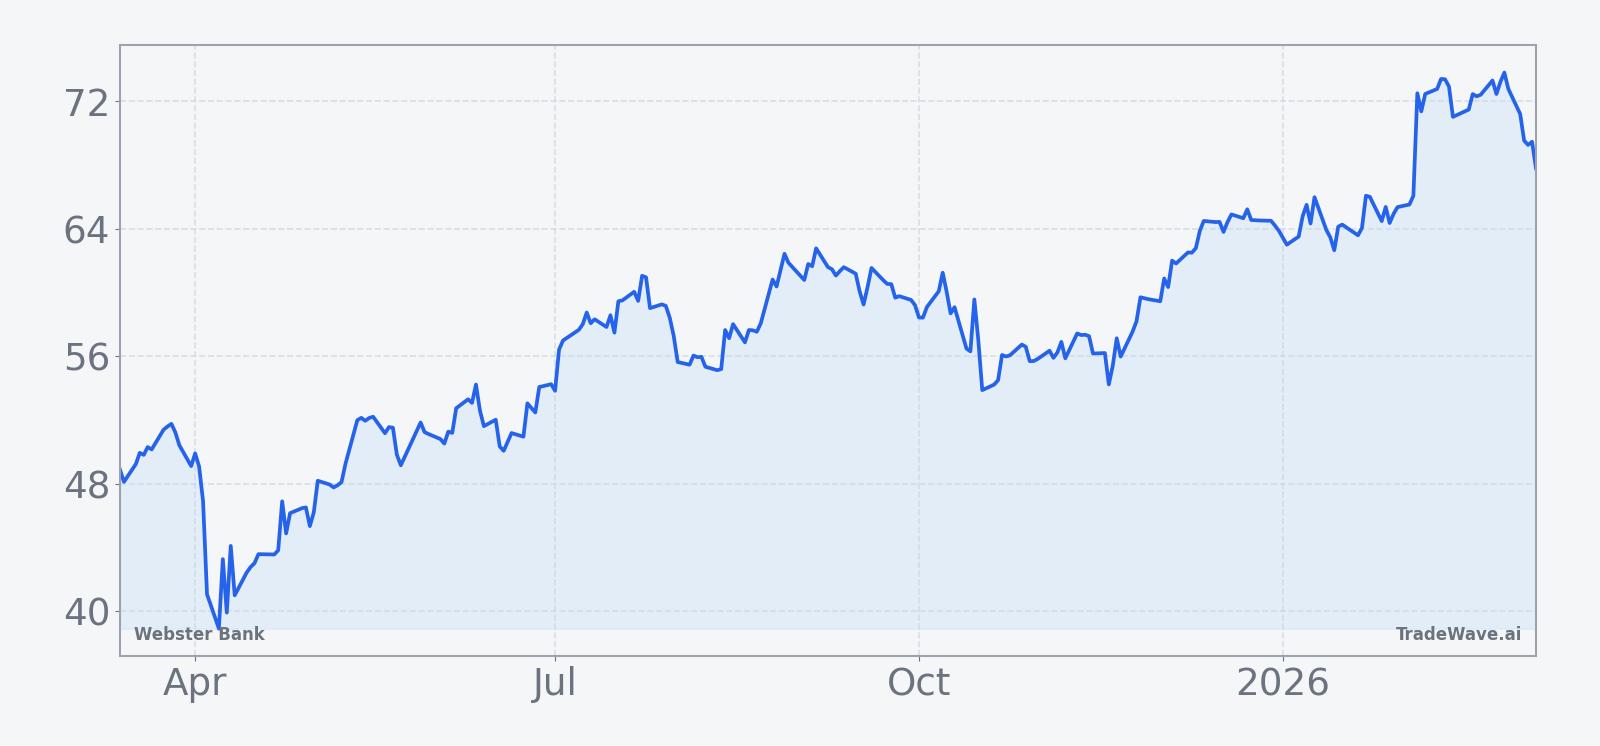
Webster Bank closed Friday at $68.50, down 0.84% on the day, with roughly 6.8 million shares changing hands against a 20-day average volume of about 6.1 million. The stock is about 7.4% below its 52-week high of $74.00 and well above its 52-week low near $37.72, reflecting a powerful rerating since last year’s regional-bank stress.[1]
The main driver of that rerating arrived in early February, when Banco Santander agreed to buy Webster Financial in a $12.3 billion cash-and-stock deal that would fold the regional lender into the Spanish group’s U.S. operations.[1][2][3][4] The announcement sent Webster shares up roughly 9% in a single session as investors priced in the takeover premium and the prospect of a stronger parent balance sheet.[1] For Santander, the transaction is a strategic push to bulk up in the Northeast and compete more directly with entrenched U.S. regionals, using Webster’s branch network and deposit base as a platform.[2][3][4]
Deal terms envision Webster becoming a wholly owned unit of Santander, with existing shareholders receiving a mix of cash and Santander stock once regulators sign off.[2][4] That structure effectively caps Webster’s standalone upside around the agreed valuation, but it also introduces a new set of variables for the share price in the interim, including merger-arbitrage positioning, spread volatility and any shifts in perceived regulatory risk. The 9% volume-backed spike on announcement day shows that event-driven money is already active in the name.[1]
At the sector level, the transaction fits into a broader consolidation wave in U.S. regional banking as larger players look to add scale and diversify funding bases.[1][2] For Webster, the tie-up promises a stronger competitive position in financial services, but it also means that near-term trading will be driven less by quarterly earnings and more by deal milestones, commentary from Santander and any changes in the macro backdrop for banks.[2][3]
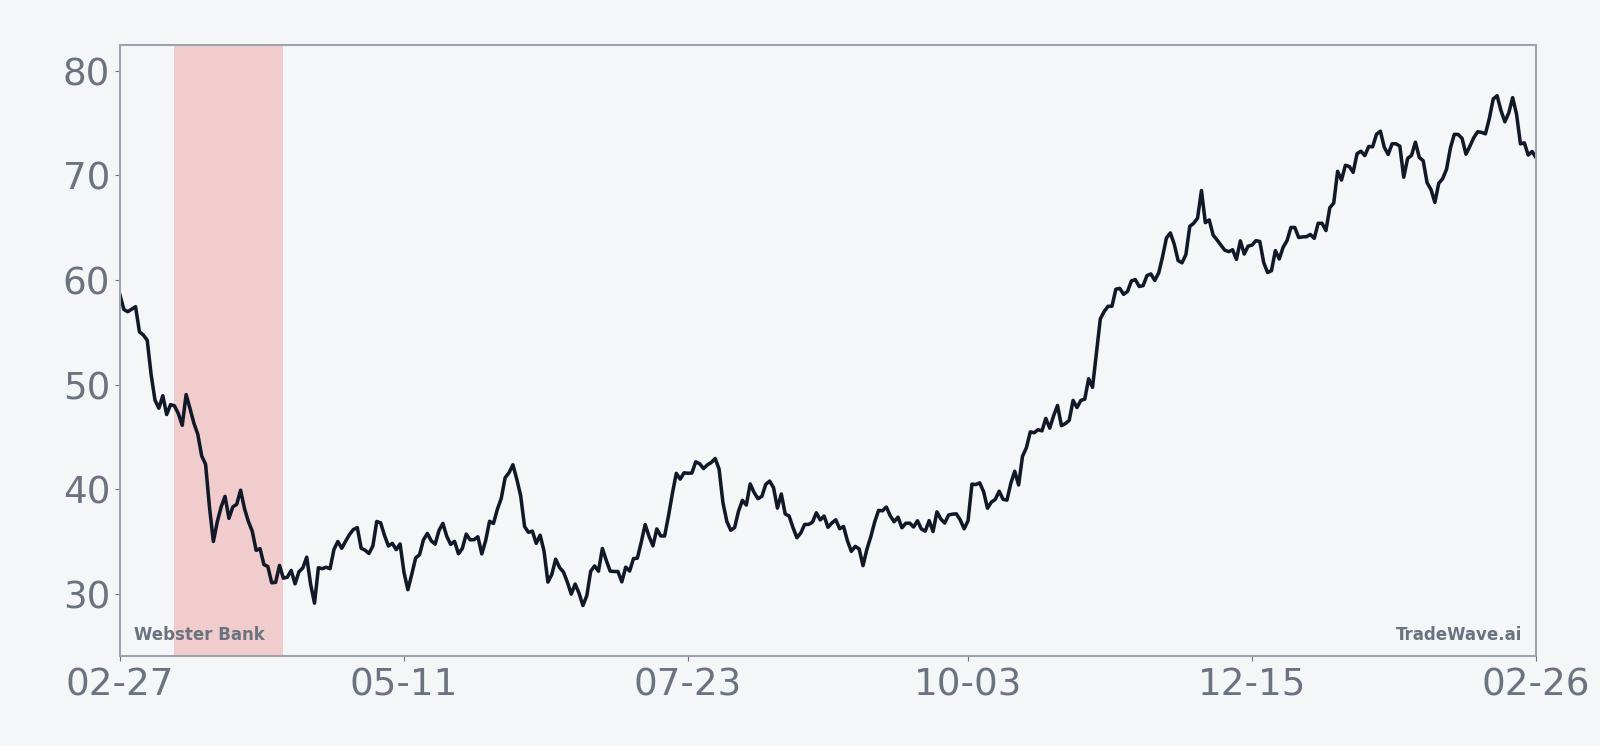
The chart below situates the latest move in its recent multi-month context.
What to watch as the window opens
The next 29-day window starting Mar 13 will unfold against a backdrop that looks very different from most of the past decade, with Webster trading as a takeover target rather than a standalone regional bank. Traders will be watching how tightly the stock tracks the implied deal value and whether the spread to Santander’s offer widens or narrows as regulatory reviews progress.[1][2][3][4]
On the tape, two levels matter most. On the upside, the 52-week high around $74.00 marks the top of the current deal-driven range and a rough proxy for how much additional optimism investors are willing to price in.[1] On the downside, any sustained break back toward the mid-$60s would suggest that arbitrageurs are demanding a wider spread, either because of macro jitters or perceived execution risk.
Volume will be another key tell. The 9% surge on the announcement, accompanied by heavy trading, signaled that fast money piled into the story quickly.[1] If volumes stay elevated as the seasonal window opens, it would suggest that event-driven funds are still actively adjusting positions, which could amplify any historical tendency toward downside in this stretch. If activity fades, the pattern may play out more quietly, with the stock grinding rather than lurching.
Finally, behavior inside the window will offer a real-time test of the decade-long seasonal record. A move that leans lower, with rallies being sold and closes skewing toward the bottom of daily ranges, would line up with the historical short bias. A firm tape that shrugs off intraday dips and pushes back toward the 52-week high would mark a clear break from the past pattern and signal that the takeover dynamics are overpowering the usual spring weakness. Either way, the calendar says this is the slice of the year when Webster’s chart has rarely been quiet.
Sources
- [1] Reuters, “Santander shares fall on proposed $12.2 billion Webster deal,” Feb 4, 2026.
- [2] The Wall Street Journal, “Banco Santander to Buy Webster Financial in $12.3 Billion Deal,” Feb 3, 2026.
- [3] The Wall Street Journal, “Banco Santander Strikes $12.3 Billion Deal for Webster Financial in U.S. Expansion,” Feb 3, 2026.
- [4] The Wall Street Journal, “Banco Santander Strikes $12.3 Billion Deal for Webster Financial in U.S. Expansion,” Feb 3, 2026.