Webster Bank (WBS) Has Delivered 10 of 10 Profitable Short Runs in This 29-Day Window
Webster Bank is trading just below recent highs as it heads toward a 29-day stretch that has quietly rewarded short sellers for a decade, only weeks after Santander’s $12.3 billion takeover deal jolted the stock.

Seasonal window
Webster Bank has produced profitable short-side returns in this 29-day window in 10 of the past 10 years, with average gains of 7.39% for traders positioned short. Shares last closed at 68.50, down 0.8% on the day and about 7.4% below their 52-week high of 74.00.[1] The pattern matters this year because it collides with a takeover-driven repricing that has already pushed volume and volatility sharply higher around the stock.[1][2]
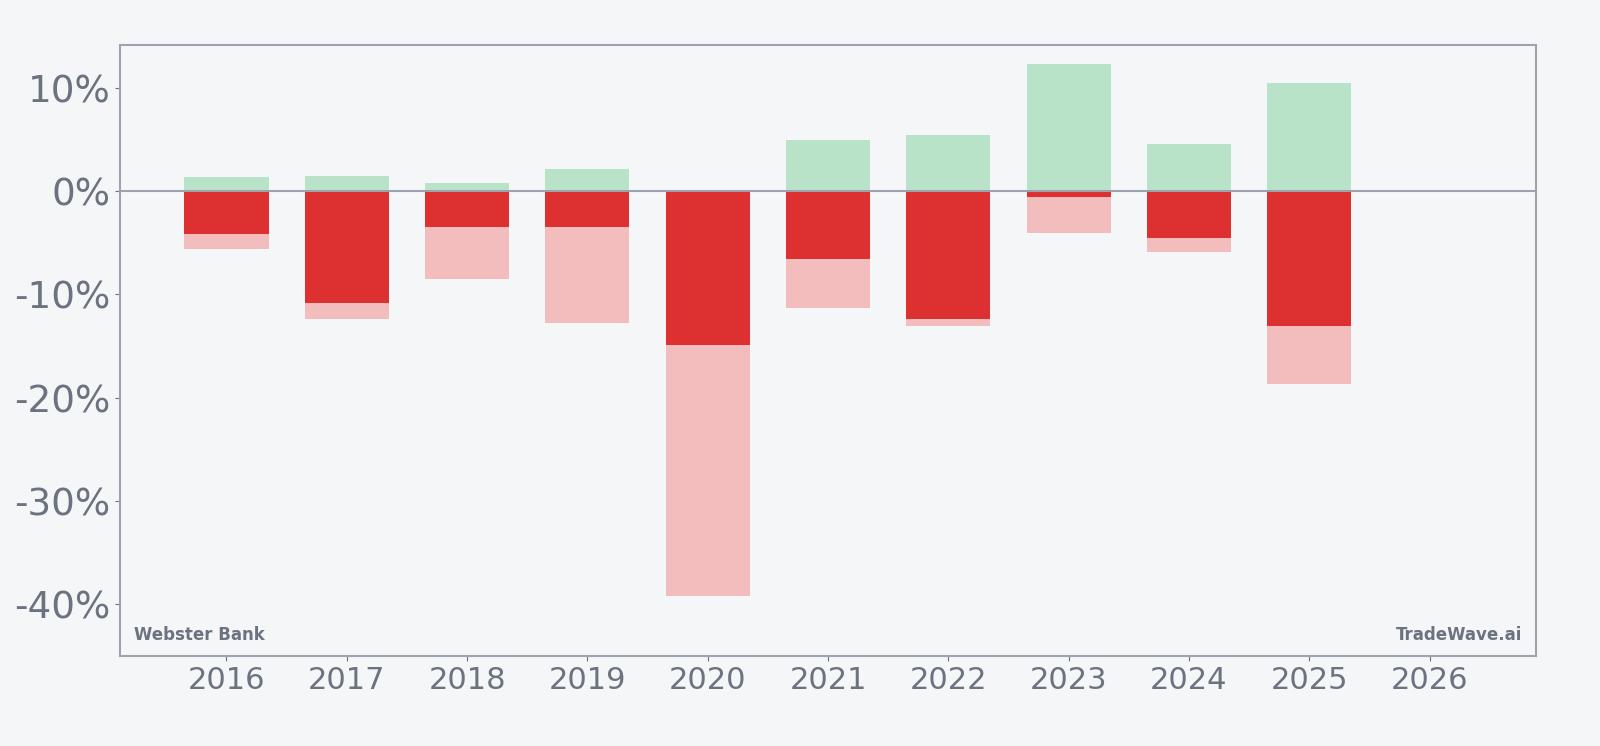
Stacked bars of net returns with peak run-ups and worst drawdowns show how far the stock has typically moved inside this window.
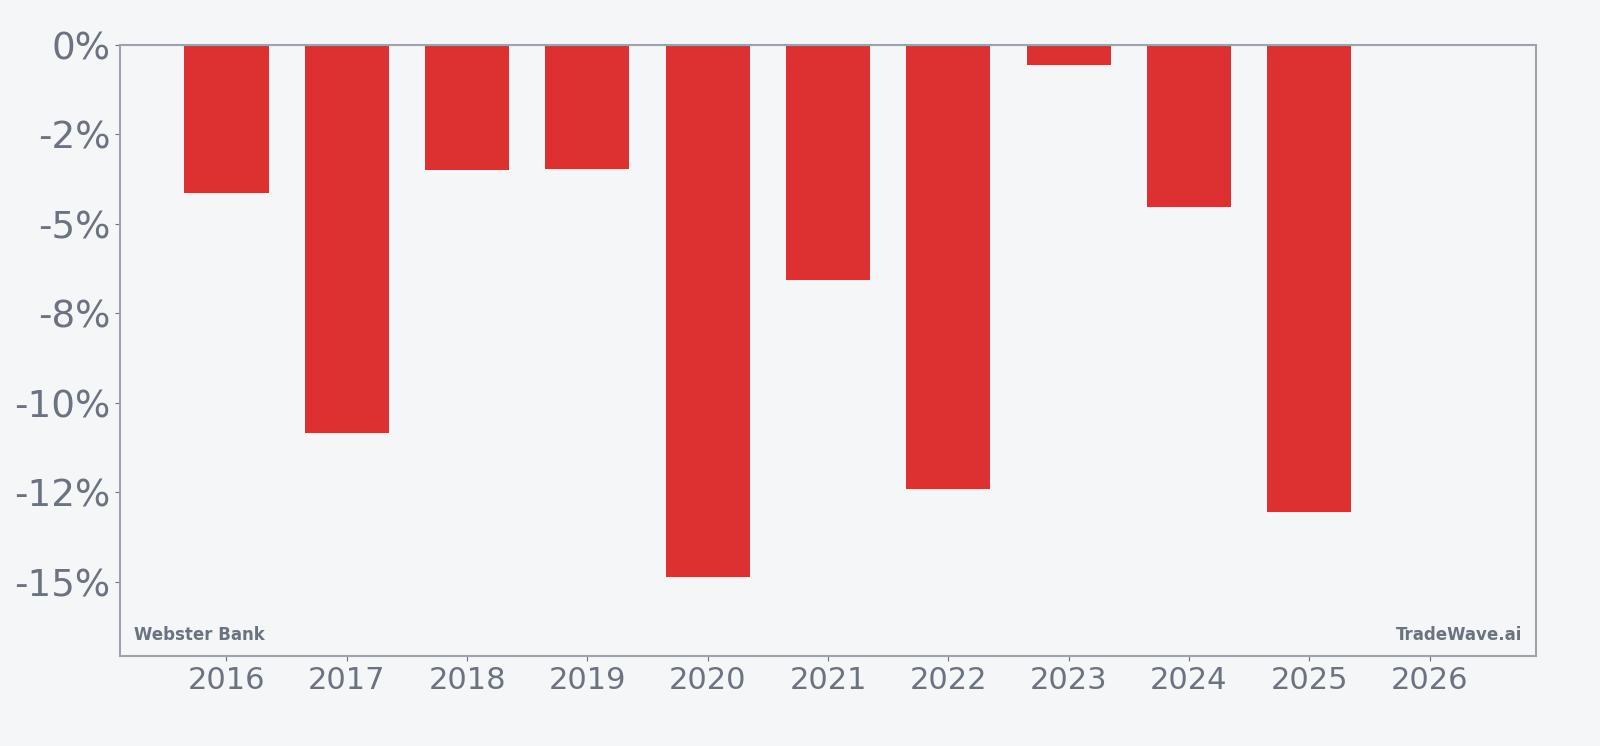
Historically this has been a clean short pattern. The trade direction is short, and every one of the past 10 iterations delivered a negative net return for the stock over the 29-day span, which translated into profitable outcomes for traders positioned with the trend. Percent Profitable sits at 100%, with 10 winners and 0 losers, and average profit across those years is 7.39%, while the median outcome is a 5.54% drop in the share price.
The average annualized return for the pattern is 7.29% and the cumulative return across the decade is 102%, which means repeated use of this window would have more than doubled a dedicated short book over that period. The Sharpe ratio of 1.43 points to a relatively strong risk-adjusted profile based on end-of-window results, even though individual years have seen very different paths inside the window.
The maximum favorable move, or best intraperiod excursion in the trade direction, has often been sizable. In 2023, for example, the stock’s best point-to-trough move inside the window reached 12.33%, even though the final net decline was just 0.56%. In 2025, the window delivered a 13.05% net drop with a 10.46% best intraperiod move, showing that short positions had multiple chances to lock in double-digit downside.
The maximum adverse move, or worst drawdown from entry, has also been meaningful in several years. The 2020 window stands out, with the stock moving against the short by as much as 39.20% at one point before finishing the period down 14.86%. Other years, such as 2017 and 2022, saw adverse swings of 12.34% and 13.04% respectively, even though the final results still favored shorts.
The 10-year average seasonal trend line slopes lower fairly steadily across the window, with more of the cumulative decline clustering in the middle third of the period. That suggests the typical pattern has been a grind lower rather than a single air pocket, although individual years like 2020 show that sharp shocks can occur inside that average path.
The stacked bar view of net returns with maximum favorable and adverse excursions reinforces the message. In most years, the best move in the trade direction has been comfortably larger than the worst move against it, which aligns with the 1.26 TradeWave Ratio that measures how far price typically travels in the trade direction within the window regardless of the final close. Even so, several bars show deep adverse spikes, reminding traders that the path to those profitable closes has not been smooth.
History does not guarantee future results, and even in a window with a perfect win record, adverse excursions inside the period can be large and fast.
Key takeaways
- Webster Bank’s 29-day window starting Mar 13 has produced profitable short-side outcomes in 10 of 10 years, with average gains of 7.39% for shorts.
- The pattern is explicitly short, with 100% Percent Profitable, 10 winners and 0 losers across the decade-long lookback.
- Intraperiod swings have been large: in 2020 the worst drawdown against the short reached 39.20% before the stock still finished the window lower.
- The 10-year average path shows a steady grind lower, with more of the decline clustering in the middle of the window rather than at the start.
- TradeWave Ratio of 1.26 and a Sharpe ratio of 1.43 point to a historically efficient but volatile short window.
- This year’s iteration will unfold against the backdrop of Santander’s $12.3 billion takeover of Webster, which has already driven a 9% deal-day spike in the stock.
Price and near-term drivers
Webster Bank closed Friday at 68.50, down 0.58 on the day, with intraday trading confined to a 67.06 to 68.82 range on volume of about 6.8 million shares, modestly above its 20-day average of roughly 6.1 million.[1] The stock is about 7.4% below its 52-week high of 74.00 and has slipped 3.83% over the past month, a cooling phase after a sharp deal-driven rally.[1]
The key driver is corporate rather than macro. On Feb 3, Banco Santander agreed to acquire Webster Financial, the parent of Webster Bank, in a cash-and-stock deal valued at about $12.3 billion, a move that would significantly expand Santander’s U.S. footprint in the Northeast.[1][2][3][4] The announcement sent Webster shares up roughly 9% on the day as investors priced in the takeover premium and the prospect of a larger, better-capitalized combined franchise.[1]
For Santander, the transaction is a strategic push deeper into U.S. retail and commercial banking, but analysts have flagged integration and execution risk, including technology alignment and branch rationalization across overlapping markets.[1][3] For Webster shareholders, the story is more about deal certainty, regulatory approvals and the final mix of cash and stock than about near-term earnings beats or misses, since the next earnings date and guidance have not yet been reset around the transaction.
Street coverage has tilted constructive on Webster, with a consensus Buy rating from firms including Jefferies and Morgan Stanley, according to Reuters, even as they acknowledge the usual merger-integration overhang.[1] With the stock now trading in the high 60s and volume still elevated relative to pre-deal norms, the tape reflects a market that has largely accepted the strategic logic but is still calibrating how much of the takeover value is already embedded in the price.
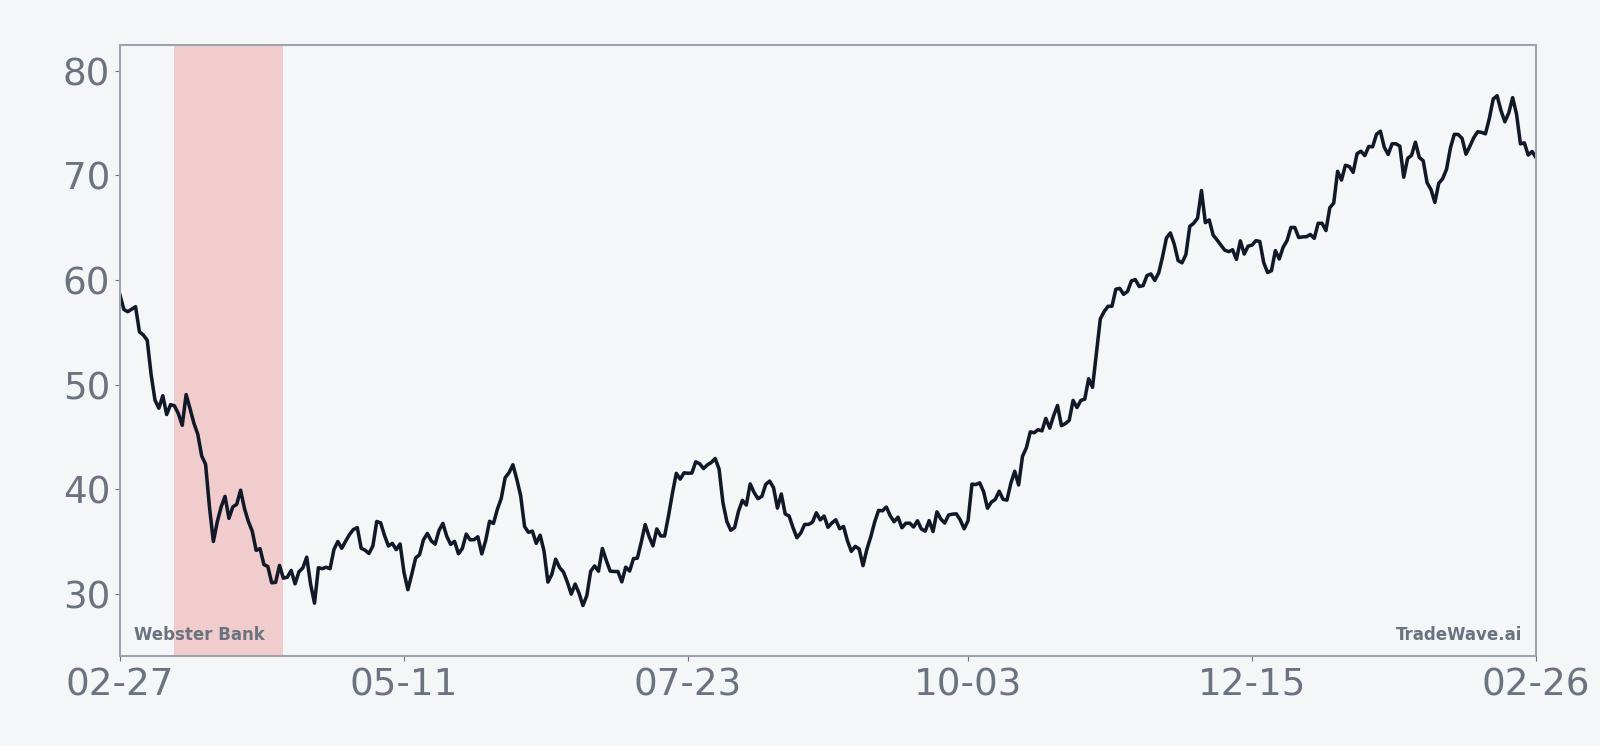
The chart below situates the latest move in its recent multi-month context.
Earnings and deal overlay
Traditional earnings catalysts are taking a back seat to deal milestones. Recent quarterly results, forward guidance and the next earnings date have not been formally reset in the wake of the Santander agreement, and the market’s focus has shifted to regulatory timelines and closing conditions rather than quarterly net interest margin swings.
In a typical year, regional bank investors would be watching loan growth, deposit costs and credit quality into the spring reporting season. This year, those metrics still matter for Webster’s standalone performance, but they are being filtered through the lens of how they affect the combined entity’s capital position and return on equity once the transaction closes.[2][3]
That backdrop is important for the seasonal window because it suggests news flow may be lumpy rather than smooth. A regulatory update or revised deal term could land inside the 29-day stretch and either reinforce or temporarily overwhelm the historical pattern, depending on how the market reads the headline.
Macro and sector context
The Webster deal is part of a broader wave of consolidation among mid-sized U.S. banks as they grapple with higher funding costs, tougher capital rules and the need for scale in technology and compliance.[1][3][4] For Santander, buying Webster is a way to accelerate growth in a key region rather than building branch density organically over many years.
Sector-wise, investors have been rewarding acquirers that can show clear cost synergies and defend deposit franchises, while punishing deals that look like empire-building. Early reaction to the Webster transaction has been mixed for Santander’s own stock, which slipped on the announcement as shareholders weighed the price tag against the long-term strategic benefits.[1]
For U.S. regional banks more broadly, the deal underscores that well-capitalized franchises with attractive local footprints can still command meaningful premiums, even in a more regulated environment. That can support valuations for peers, but it also raises the bar for standalone performance if no buyer emerges.
Valuation and positioning
With Webster trading near 68.50 and its 50-day moving average around 67.84, the stock is hovering just above a key intermediate trend line, suggesting the deal spike has not fully faded.[1] Average 20-day volume of about 6.1 million shares points to a more actively traded name than before the transaction, which can amplify both upside and downside moves around news.
Analysts covering the stock through Jefferies and Morgan Stanley have maintained a Buy stance, according to Reuters, reflecting confidence in the franchise and the strategic logic of the Santander tie-up.[1] Without a widely cited consensus price target in the latest data, the market is effectively using the deal terms and implied takeout value as the main valuation anchor.
Positioning-wise, the 9% jump on the announcement suggests some shorts were forced to cover into the spike, while event-driven funds likely built positions to arbitrage the spread between Webster’s trading price and the implied deal value.[1] That mix of merger-arb capital and residual fundamental holders sets the stage for a potentially choppy tape inside the upcoming seasonal window.
According to historical data from TradeWave.ai, this specific March-to-April stretch has behaved very differently from an average month for Webster Bank, and the next iteration begins in less than a week.
What to watch as the window opens
The 29-day seasonal window for Webster Bank starts on Mar 13 and runs through mid-April, overlapping a period when merger headlines, regulatory updates and broader bank-sector sentiment can all hit the tape. Historically, the pattern has favored shorts with a perfect 10-for-10 record and average declines of 7.39%, but the path has often included sharp countertrend rallies and deep intraperiod drawdowns.
First, traders will be watching how the stock behaves around the 74.00 area, which marks the 52-week high and a rough proxy for the market’s upper tolerance on deal optimism.[1] A failure to retest that level as the window opens would be more consistent with the historical short bias, while a decisive break above it would mark a clear departure from the typical pattern.
Second, any new disclosures on regulatory approvals, closing timelines or potential tweaks to the cash-and-stock mix could inject fresh volatility. A clean, on-track message might compress the spread and dampen swings, while signs of delay or pushback could reintroduce downside risk that aligns more closely with the seasonal history.[1][2][3]
Third, volume will matter. The 9% surge on the February announcement came with heavy trading, signaling that large holders were willing to reprice the stock quickly.[1] If elevated volume persists into the window, it would suggest that merger-arb funds and fundamental investors are still actively adjusting positions, which can magnify both the maximum favorable and adverse excursions that have defined this pattern in prior years.
Finally, behavior inside the window will offer a real-time test of whether a decade-long short-friendly stretch can still assert itself in the face of a transformational deal. A controlled drift lower with contained rallies would rhyme with the historical average path, while a sustained grind higher or a breakout to new highs would mark a clear break from the script and force traders to rethink how much weight to give this particular seasonal edge.
Sources
- Reuters: Santander shares fall on proposed $12.2 billion Webster deal (Feb 4, 2026)
- The Wall Street Journal: Banco Santander to Buy Webster Financial in $12.3 Billion Deal (Feb 3, 2026)
- The Wall Street Journal: Banco Santander Strikes $12.3 Billion Deal for Webster Financial in U.S. Expansion (Feb 3, 2026)
- The Wall Street Journal: Banco Santander Strikes $12.3 Billion Deal for Webster Financial in U.S. Expansion (Feb 3, 2026)