Costco (COST) Has Rallied in 9 of 10 Years in This 155-Day Spring-Summer Window
Costco is trading about 7.1% below its 52-week high as a historically powerful 155-day seasonal window approaches, offering a fresh lens on a stock already priced for strength.

Key takeaways
- A 155-day seasonal window for Costco starting Mar 14 has been positive in 9 of the past 10 years, aligned with a long trade direction.
- Winning years in this stretch have averaged 17.16% gains, while including the lone losing year still leaves a 15% average across all outcomes.
- The pattern’s TradeWave Ratio of 2.74 and Sharpe ratio of 1.27 point to historically strong, risk-adjusted upside in this window.
- Intraperiod swings have been meaningful, with some years showing double-digit drawdowns even when the window finished higher.
- Costco closed at $982.57 on Friday, about 7.1% below its 52-week high of $1,058.23, after a 2.4% daily drop and a 4.8% gain year to date.[3]
- Upcoming earnings and any shift in consumer spending or membership trends will collide directly with this historically bullish seasonal regime.
Price and near-term drivers
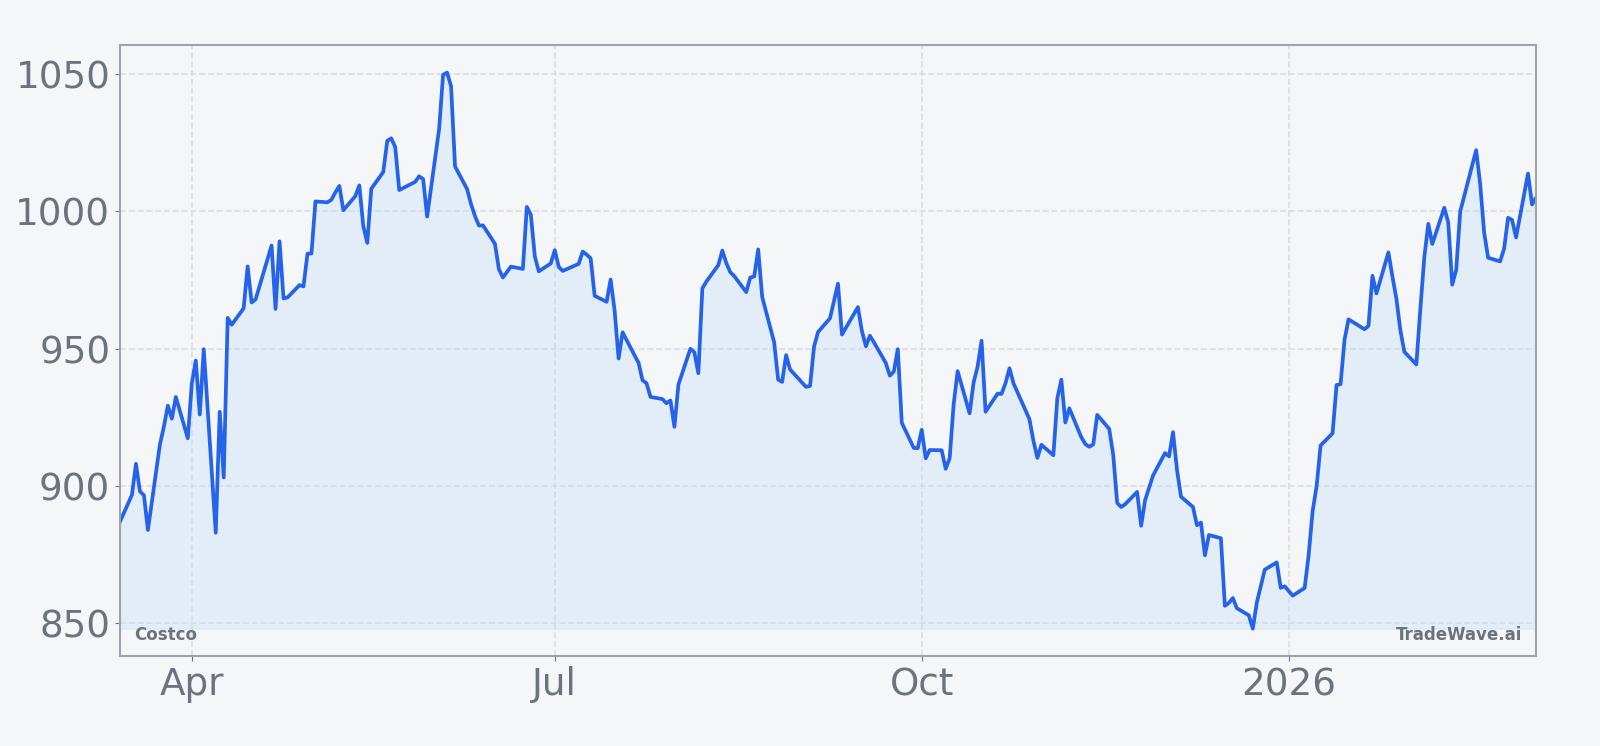
Costco shares finished Friday at $982.57, down 2.4% on the day, leaving the stock about 7.1% below its 52-week high of $1,058.23 and still up 4.8% so far in 2026.[3] The pullback follows a powerful multi-year run that has pushed the warehouse retailer into the four-figure debate, with some strategists openly asking whether investors should trim exposure around $1,000 after a long stretch of outperformance.[3]
In Sep 2025, Costco’s fiscal fourth quarter topped expectations on both revenue and earnings, helped by steady consumer demand and rising membership fees, even as some investors focused on slower comparable-store sales.[1][2][7] That strength set up high expectations heading into the current fiscal year, which were tempered when the company’s subsequent quarter delivered profit of $4.02 per share versus a $4.11 estimate, a miss that briefly knocked the stock and reminded investors that even Costco is not immune to cautious consumers and tariff noise.[5][6][8]
Costco’s next earnings report, covering its fiscal second quarter of 2026, is scheduled for Mar 5, and Wall Street will be watching closely for any sign that membership renewal rates are softening or that inflation-sensitive shoppers are trading down inside the club.[1][2][5][6] Analysts expect renewal rates to ease modestly over the next few quarters, but see growth in online signups and international warehouses as key offsets that could keep the top line and fee income moving higher.[1][2]
On the Street, Costco still carries a Buy consensus rating, with a $1,100 price target from Morgan Stanley cited in late 2025 coverage, a level that sits modestly above current trading and reflects confidence in the company’s ability to defend share against big-box rivals.[1][3] In May 2025, Costco was again outpacing Walmart and Target in U.S. sales growth, underscoring how its membership model and bulk value proposition have resonated even as the broader retail sector wrestled with shifting consumer habits.[4]
Macro forces remain a swing factor. In 2025, Costco’s sales mix was shaped by inflation and tariff dynamics, with shoppers leaning into bulk purchases to stretch paychecks while also reacting to price changes on imported goods.[2][8] That backdrop has kept the stock in the crosshairs of investors trying to balance defensive consumer exposure with the risk that a cooler economy or renewed tariff pressure could slow high-ticket discretionary categories inside the clubs.[2][8]
The chart below situates the latest move in its recent multi-month context.
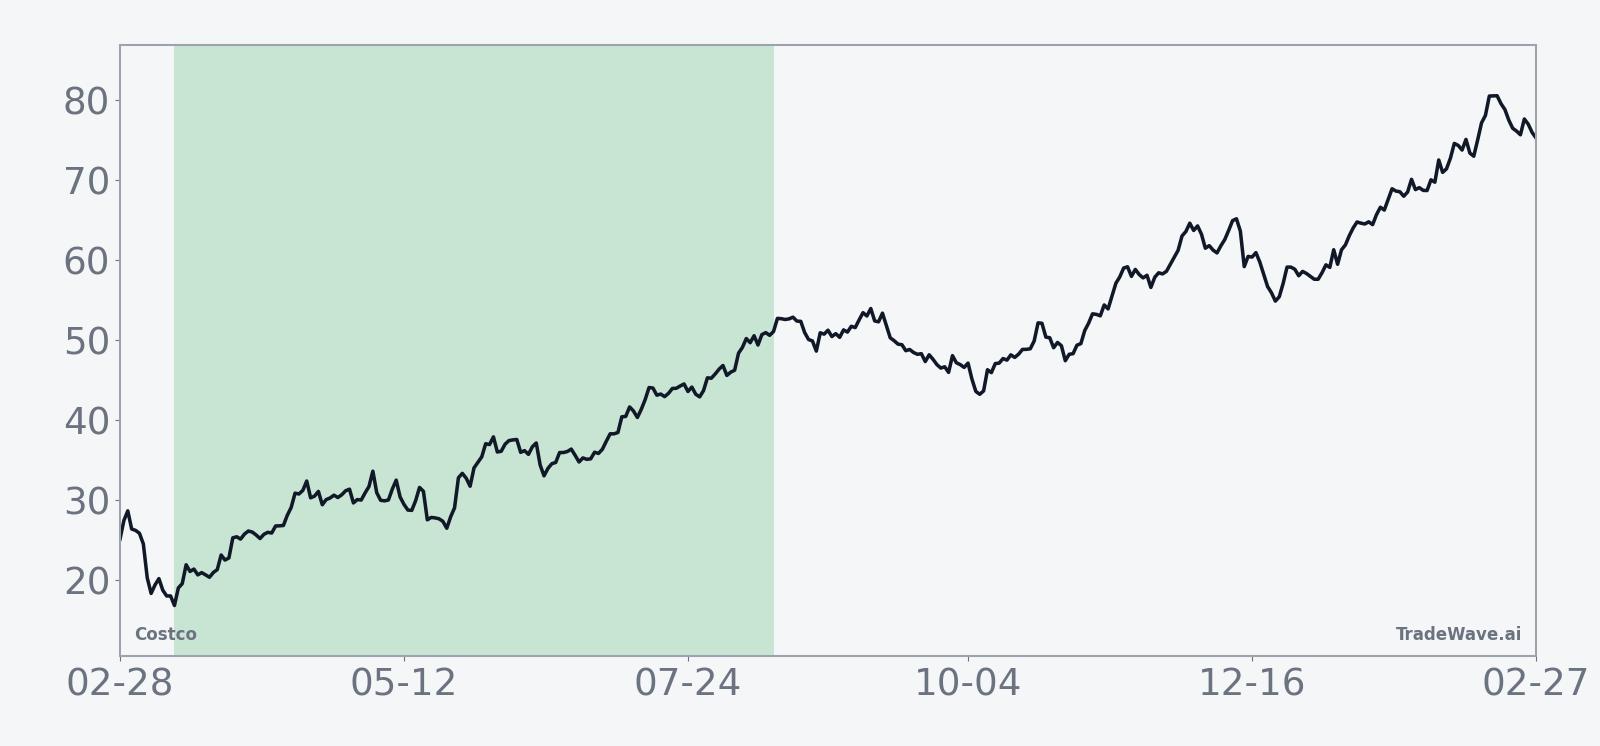
According to historical data from TradeWave.ai, this is not just another earnings season for Costco; the stock is about to enter one of its most statistically distinctive stretches of the calendar.
Seasonal window
Costco has risen in 9 of the past 10 years during a 155-day window that begins on Mar 14, with winning years averaging 17.16% gains. The stock heads into this stretch at $982.57, about 7.1% below its 52-week high and up 4.8% year to date, giving bulls some room above recent support but little obvious valuation slack.[3] For a name that already commands a premium multiple, a window that has historically delivered strong, trend-friendly upside is the kind of pattern long-term holders pay attention to.
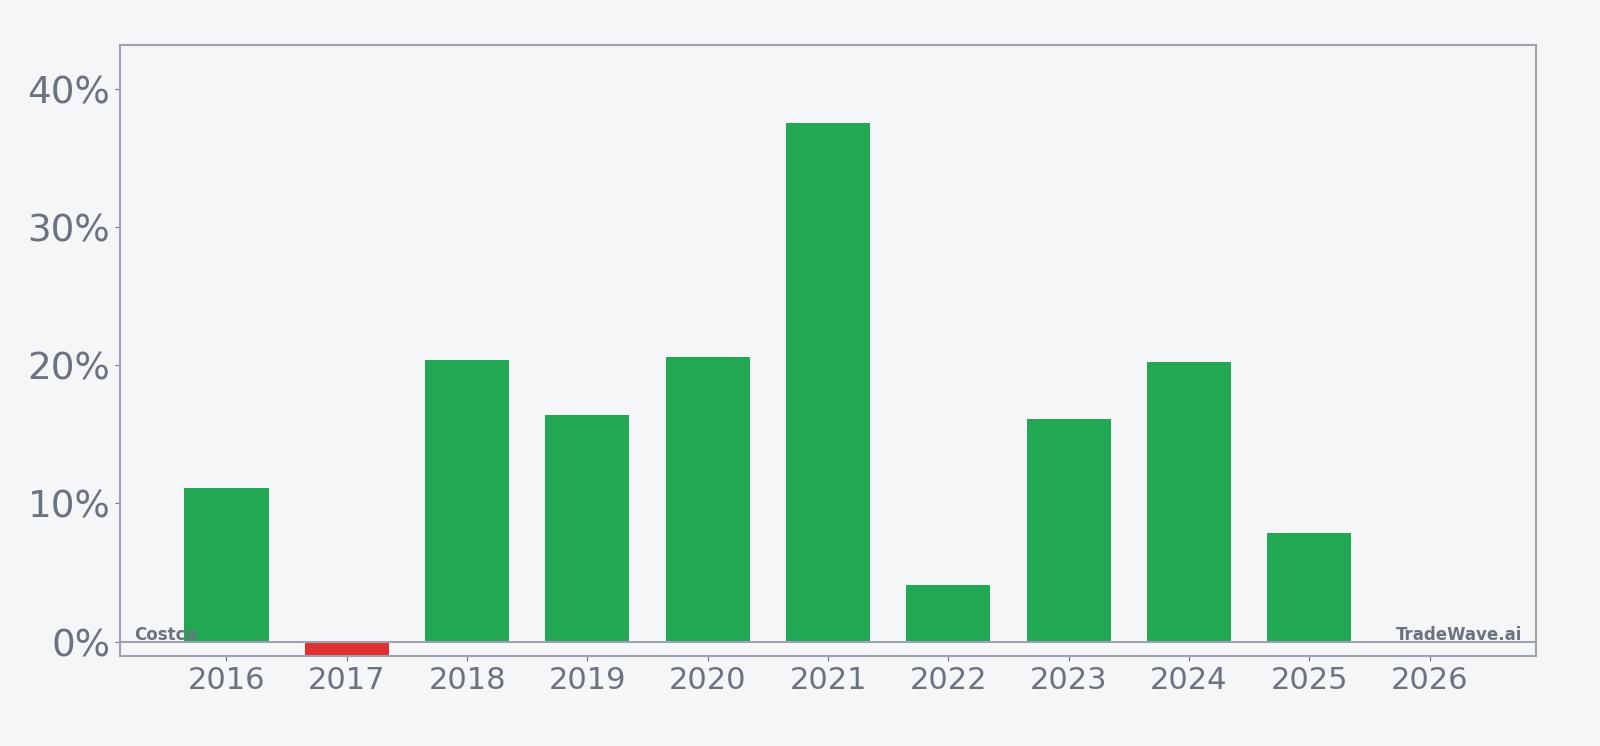
Across the full 10-year sample, Costco’s cumulative return inside this window totals 301%, with an annualized return of 14.91% and a Sharpe ratio of 1.27, which is high for a single, repeatable slice of the calendar. The trade direction is explicitly long, and the pattern has produced 9 winners against just 1 loser, so the 90% Percent Profitable figure is not a statistical quirk from a tiny sample but a decade-long run of mostly consistent behavior.
The lone down year in the sample came in 2017, when the window finished with a modest 0.94% loss despite a maximum favorable move of 15.38% at one point, a reminder that even “good” windows can slip if late selling overwhelms earlier strength. On the other side of the spectrum, 2021 stands out as the strongest year, with a 37.57% net gain and a peak run-up of 37.67% from entry, while 2018, 2020 and 2024 each delivered net returns around 20% with maximum favorable excursions in the low 20% range.
Average winner gains of 17.16% compare with an all-years average of 15%, which means the single losing year has not dragged the profile down much. The median profit of 16.28% sits close to those averages, suggesting the pattern is not being skewed by one or two outlier years but instead reflects a cluster of mid-teens outcomes that repeat often.
Intraperiod risk is real. In 2022, for example, Costco finished the window up 4.11%, but the worst drawdown from entry reached 22.58% at one point, the deepest adverse move in the sample. Even in stronger years like 2016 and 2024, the stock saw maximum adverse excursions of 8.97% and 4.74% respectively before recovering to double-digit gains by the end of the window. That is the MAE/MFE profile in action: best and worst intraperiod excursions that show how far the stock can swing before the final result is known.
The TradeWave Ratio of 2.74 captures how far Costco has typically traveled in the trade direction within this window, independent of where it ultimately closed. Combined with the 10.74% standard deviation of returns, it points to a regime where upside has historically been meaningful but not free of volatility, which fits a stock that often trends strongly yet can react sharply to earnings or macro headlines.
Yearly net and peak moves highlight upside persistence amid typical drawdowns.
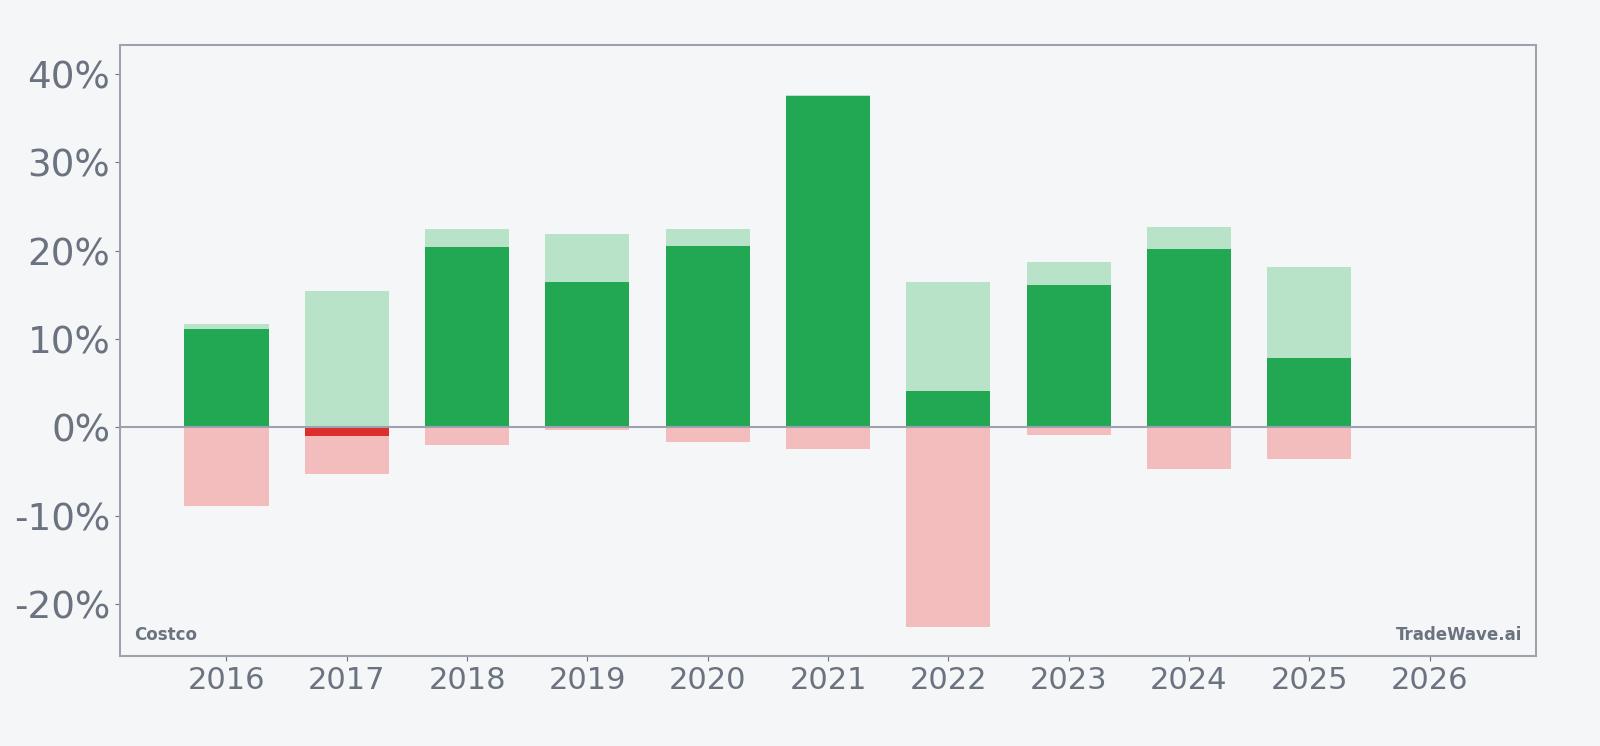
History does not guarantee future results; adverse excursions (MAE) can be large even in winning windows.
Put together, the pattern is clear: this mid-March-to-late-summer window has favored long positions in Costco in 9 of 10 years, with mid-teens gains common but double-digit drawdowns also part of the ride.
What to watch as the window opens
The next few weeks will test whether Costco can once again lean into a calendar stretch that has historically rewarded patience. The first checkpoint is earnings on Mar 5, where any surprise on membership renewal rates, fee growth or international momentum could set the tone for how the stock behaves as the seasonal window begins.[1][2][5][6]
On the chart, traders will be watching the $1,000 area that has become a psychological pivot in recent commentary, as well as the 50-day moving average around $949.91, which has provided a reference point for pullbacks in recent months.[3] A decisive move back toward the 52-week high near $1,058.23 during the early part of the window would be consistent with the historical pattern of strong upside excursions, while a break below the 50-day with expanding volume would look more like the rare losing year in the sample.
Macro and sector signals matter too. Any renewed tariff headlines or signs that inflation is reaccelerating at the checkout line could pressure discretionary baskets inside Costco’s clubs, even as value-conscious shoppers continue to trade into bulk purchases.[2][4][8] If that kind of macro drag shows up just as the seasonal window opens, it would provide a clean test of whether the historical bias toward gains can overpower a tougher fundamental tape.
For investors and traders alike, the checklist is straightforward: track how Costco trades around earnings, watch whether price respects or rejects the $950 to $1,000 band, and see if intraperiod swings stay within the kind of MAE ranges seen in prior years. If the stock grinds higher with contained drawdowns, it would fit neatly with a decade of seasonal history. If instead it stumbles early and fails to recover, that would mark a rare break from one of the more consistent patterns on Costco’s calendar.
Sources
- [1] CNBC, "Costco's quarter failed to impress. But there was still a lot we liked" (Sep 26, 2025)
- [2] Seeking Alpha, "Costco beats on top- and bottom-line but comparable stores sales slow" (Sep 25, 2025)
- [3] Forbes, "Sell Costco Stock At $1,000?" (Mar 2, 2026)
- [4] Seeking Alpha, "Costco outpaces Walmart and Target again in the U.S." (May 29, 2025)
- [5] MarketWatch, "Costco’s stock slips despite profit beat" (Sep 25, 2025)
- [6] Bloomberg, "Costco Posts Quarterly Profit That Misses Market Expectations" (Mar 6, 2025)
- [7] Bloomberg, "Costco’s Earnings Beat Estimates on Steady Consumer Demand" (Sep 25, 2025)
- [8] Yahoo Finance, "Costco stock falls after retailer misses on earnings" (Mar 7, 2025)
- [9] Forbes, "Can Costco Stock Sink 30%?" (Mar 12, 2025)