Viatris (VTRS) Has Dropped in 6 of 6 Midterm Spring Windows as Shares Near 52-Week High
Viatris is approaching a midterm-year spring stretch that has rewarded shorts every time in the last six cycles, just as the stock trades near a 52-week high after a sharp rebound.

Key takeaways
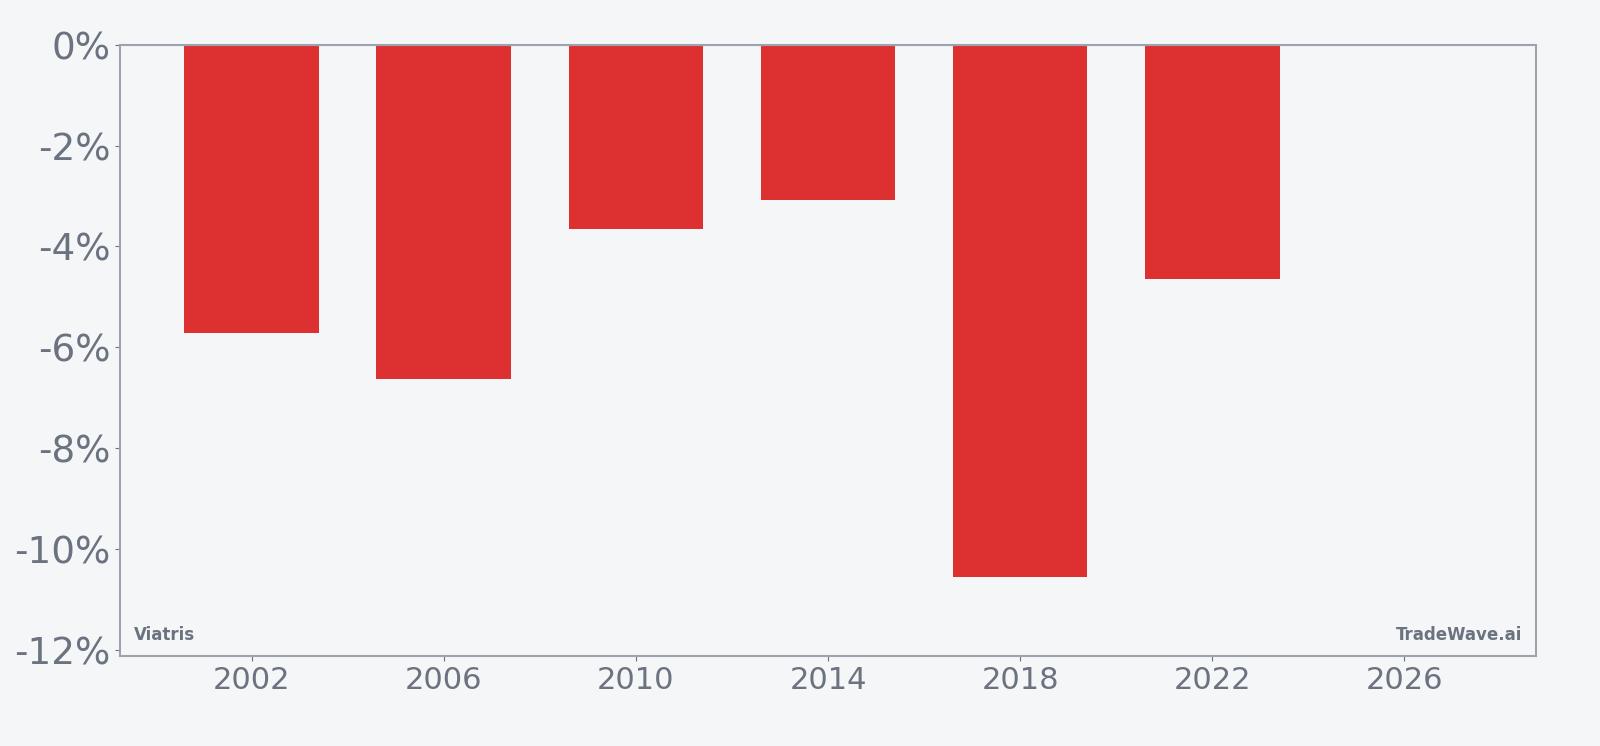
- A 40-day midterm-year spring window for Viatris, starting Mar 30, has produced profitable downside moves for shorts in 6 of 6 historical cycles.
- The pattern is short-directed, with an average profit of 5.71% for the strategy across those winning years.
- All six years in the sample were winners for the short setup, with no losing years recorded in this window.
- The TradeWave Ratio (TWR) of 6.13 signals that price has typically traveled meaningfully in the trade direction within the window, independent of the final close.
- Intraperiod swings have been sizable, with historical best and worst excursions showing that rallies and drawdowns can both develop quickly inside the window.
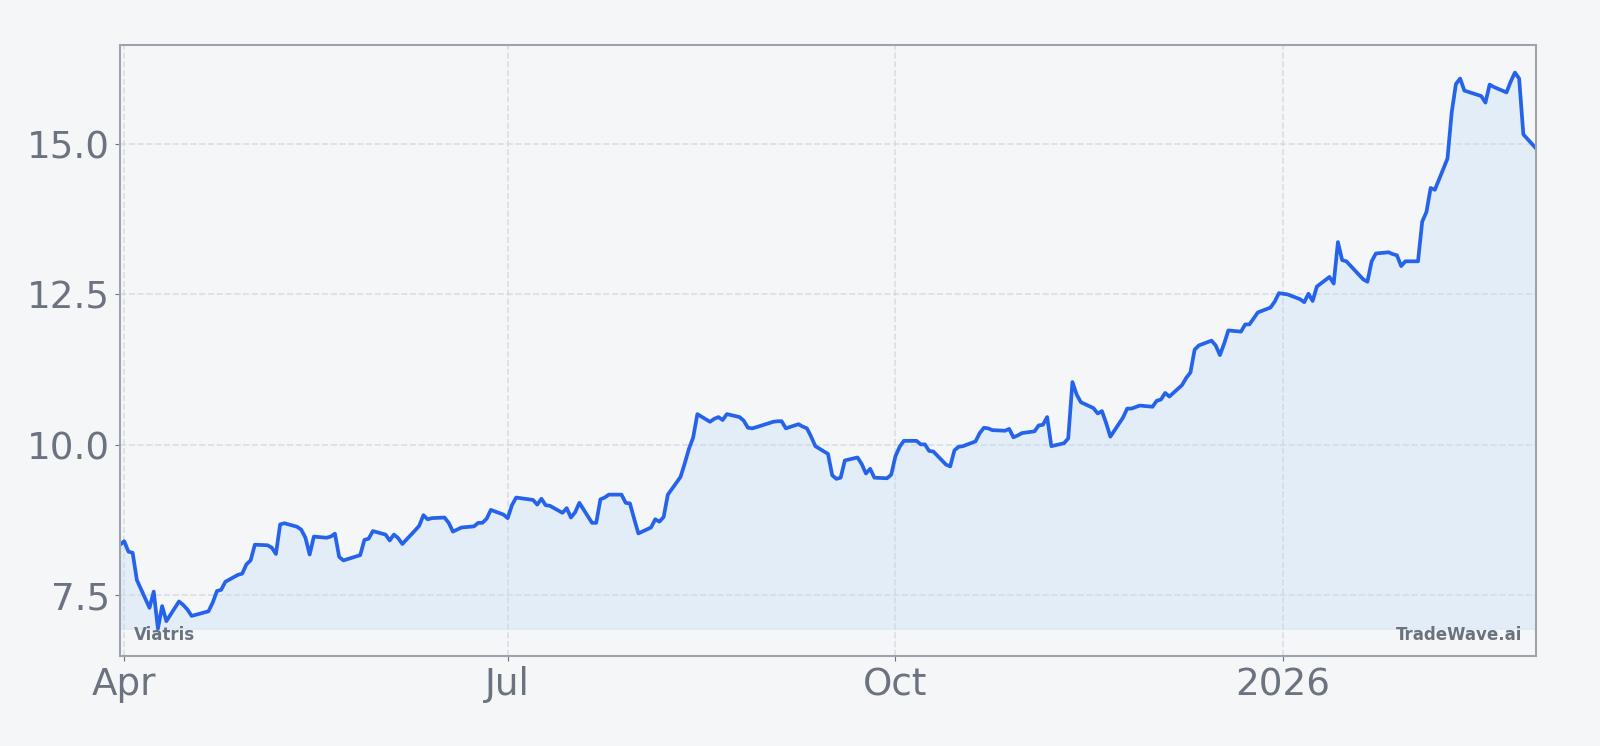
- Viatris closed at 15.70 on Mar 2, up 5.16% on the day and about 4.7% below its 52-week high of 16.47, setting up a potential clash between recent strength and a historically weak midterm-year stretch.
According to historical data from TradeWave.ai, this specific midterm-year spring period has behaved very differently from an average month on the Viatris calendar. The next section walks through how that pattern has played out across the last six midterm election years.
Seasonal window
Viatris has delivered profitable downside moves for shorts in all 6 of the last 6 midterm election years during this 40-day spring window, averaging 5.71% gains for the strategy. The upcoming iteration begins on Mar 30 and arrives with the stock last trading at 15.70, about 4.7% below its 52-week high of 16.47 after a 5.16% jump in the latest session.[4] That combination of a clean short-biased seasonal record and a stock pressing toward the top of its one-year range is what makes this window stand out.
The pattern is built on the last six midterm election years, a phase of the presidential cycle that often coincides with policy uncertainty, shifting drug-pricing rhetoric and tighter fiscal conditions. Grouping Viatris’ behavior by this cycle rather than by simple calendar years helps isolate how the stock has traded when Washington is in mid-course, before the pre-election year’s typical push to stabilize markets.
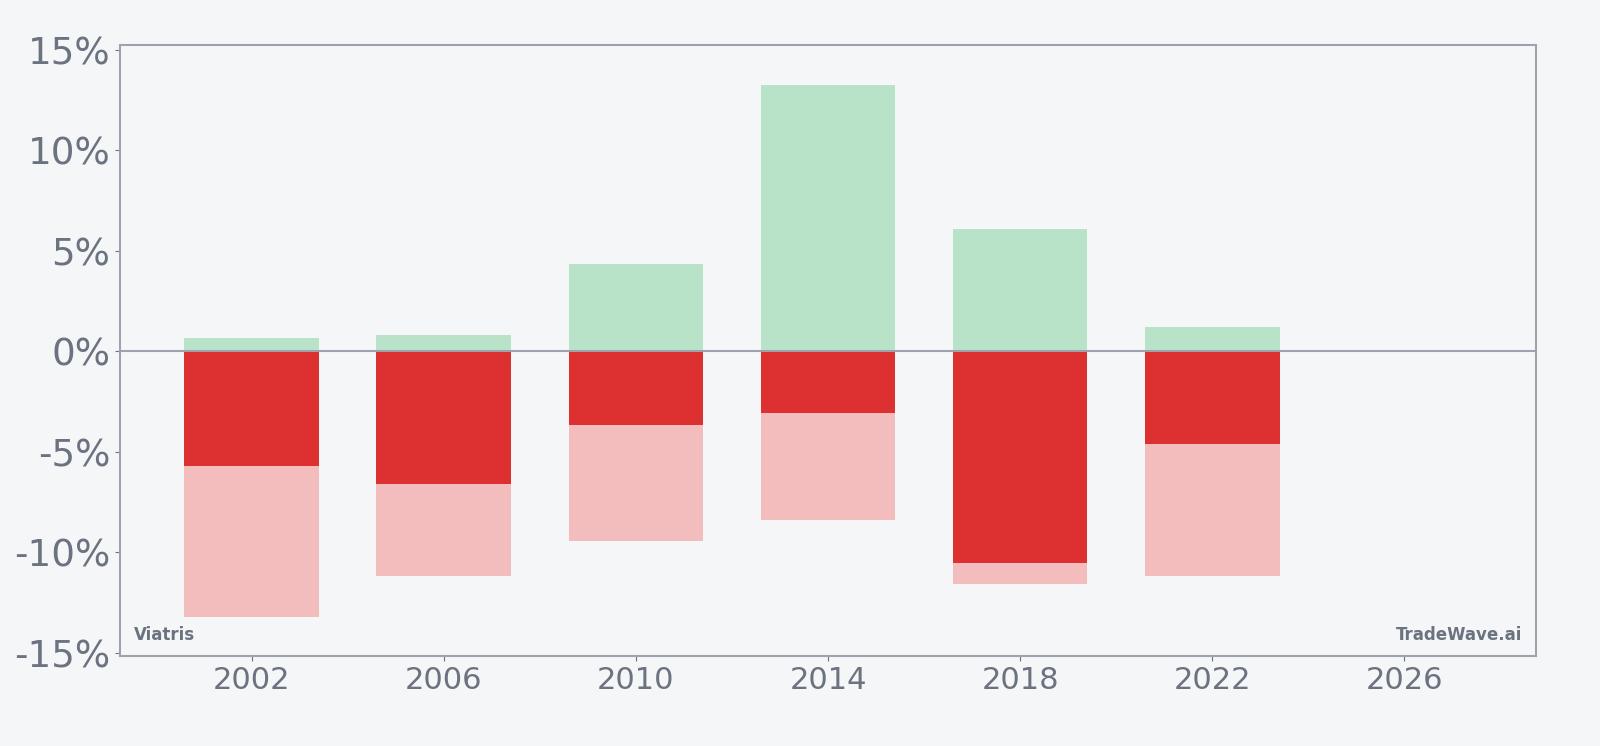
A stacked view of net results alongside best and worst intraperiod swings shows how far Viatris has tended to move inside this window.
Across the six midterm-year samples, the short-directed strategy has never posted a losing outcome in this window. Average profit of 5.71% comes alongside a 39% cumulative gain and a Sharpe ratio of 1.95, which points to a historically strong risk-adjusted profile for this specific slice of the calendar. The TradeWave Ratio of 6.13 indicates that price has typically traveled meaningfully in the trade direction within the window, not just drifted lower.
The per-year breakdown shows that the strongest short year was 2018, with a net return of about 10.55% for the strategy, while the softest was 2014 at roughly 3.07% in net gains. In several years, such as 2014 and 2018, the maximum favorable move inside the window reached mid-single to low-teens percentages, while the worst intraperiod drawdowns also pushed toward double digits. That mix points to a window where both rallies and selloffs can be sharp, even though the final outcome has historically favored shorts.
MFE/MAE behavior matters because it shows how the trade has behaved between entry and exit, not just at the close. In 2002 and 2006, for example, the worst adverse excursions were around 13.21% and 11.21% against the short, even though the trades ultimately finished with 5.71% and 6.63% profits. In 2014, the stock at one point rallied more than 13% against the short before rolling over enough to leave the strategy ahead at the end of the window. Add it up and this is a window where patience has historically been rewarded, but only for traders who could tolerate sizable squeezes along the way.
The cumulative return profile across the six midterm years slopes steadily in favor of the short direction rather than relying on one or two outlier episodes. That kind of clustering is what makes the pattern notable: the window has not just produced one big win and several flat years, but a string of consistent, if sometimes volatile, downside outcomes for the stock.
History does not guarantee future results, and the worst intraperiod drawdowns in this window have been large enough that even a pattern with no losing years has carried meaningful risk.
Price and near-term drivers
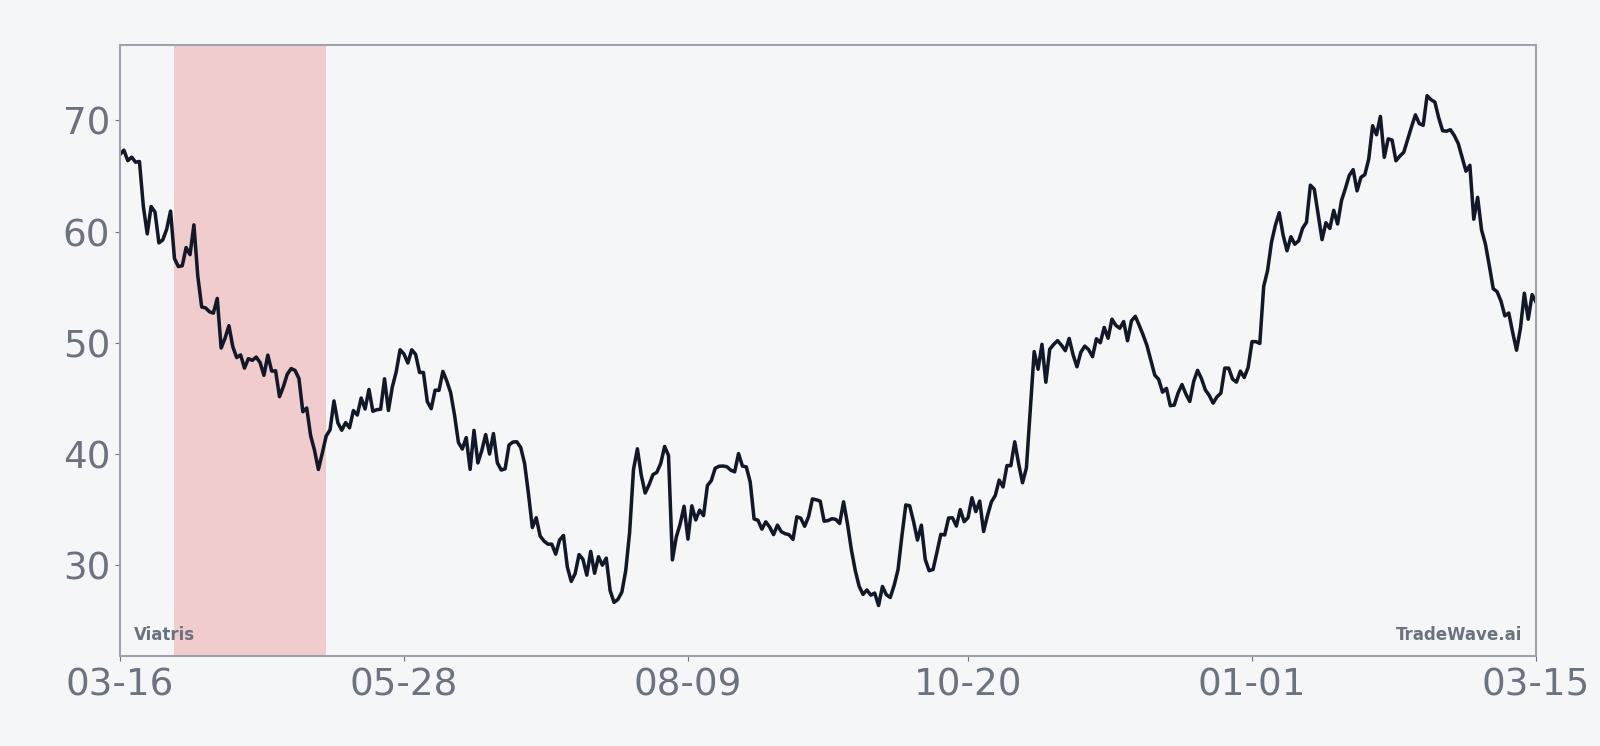
Viatris closed at 15.70 on Mar 2, up 0.77 points or 5.16% on the day, with roughly 13.8 million shares changing hands against a 20-day average volume of about 12.0 million.[4] The stock has gained 19.94% over the past month and sits above its 50-day simple moving average of 13.73, leaving it about 4.7% below its 52-week high of 16.47 and well above its 52-week low near 6.36.[4] That rebound comes after a stretch in 2025 when Viatris faced legal and regulatory overhangs tied to opioid-related claims and securities litigation, which weighed on sentiment at the time.[1][2][3][5]
The chart below situates the latest move in its recent multi-month context.
In Apr 2025, Viatris agreed to pay up to $335 million over nine years to resolve opioid-related claims, adding a defined but long-tailed liability to its balance sheet.[4] Around the same period, several law firms publicized securities-fraud class actions and lead-plaintiff deadlines tied to earlier stock declines, keeping legal risk in focus for shareholders.[1][2][3][5] Those issues framed the backdrop for weaker 2024 results and lower-than-expected 2025 guidance, which had previously pressured the shares before the more recent recovery.[1]
Looking ahead to the upcoming midterm-year spring window, the key tension is between a stock that has rebuilt momentum and a historical pattern that has favored downside moves during this exact phase of the presidential cycle. If Viatris continues to trade near the top of its one-year range into late March, the setup will look similar to prior midterm years where rallies gave way to short-friendly pullbacks once the window opened.
What to watch as the window approaches
For traders tracking this pattern, the first marker is simple timing: the 40-day window begins on Mar 30 and runs into early May. Price behavior as that date approaches will matter. A continued grind higher toward or through the 16.47 high would echo several past midterm years where strength preceded the short-friendly phase, while an early pullback could blunt the seasonal edge before it even starts.
Second, watch how Viatris trades around any fresh headlines on litigation, regulation or pipeline updates. In prior cycles, midterm-year volatility in healthcare has often clustered around policy and legal news, and this stock already carries a history of high-profile settlements and lawsuits.[1][2][3][4][5] A quiet news tape into April could leave technicals and seasonality in the driver’s seat, while a surprise headline could overwhelm the historical pattern in either direction.
Third, monitor intraday ranges and volume once the window opens. The historical MFE/MAE profile shows that even in winning years for the short strategy, Viatris has often staged sharp rallies inside the window before rolling over. If this cycle starts with tight ranges and muted volume, it would mark a departure from that playbook. If instead the stock swings hard both ways on above-average volume, it would look more like the high-variance environment seen in 2014 and 2018.
Finally, keep an eye on how Viatris trades relative to the broader healthcare complex and the S&P 500. Midterm election years can feature choppy early-year action before the pre-election year’s more supportive backdrop, and a stock-specific seasonal pattern that leans short into that macro context can amplify moves. If Viatris underperforms into May while the broader tape holds up, it would be consistent with the historical window. Outperformance through the period would be a clear sign that this cycle is breaking from the past.
Sources
- [1] Morningstar: INVESTOR ALERT: Faruqi & Faruqi, LLP Investigates Claims on Behalf of Investors of Viatris - VTRS (May 11, 2025)
- [2] Morningstar: The Gross Law Firm Reminds Viatris Inc. Investors of the Pending Class Action Lawsuit (Apr 10, 2025)
- [3] Morningstar: The Gross Law Firm Reminds Shareholders of a Lead Plaintiff Deadline in Viatris Inc. Lawsuit (May 8, 2025)
- [4] Reuters: Viatris to pay up to $335 million to resolve opioid-related claims (Apr 7, 2025)
- [5] Morningstar: Viatris Deadline: VTRS Investors with Losses in Excess of $100K May Lead Securities Fraud Lawsuit (Jun 1, 2025)