Apollo Global Management (APO) Has Rallied in 9 of 10 of These 296-Day Windows
Apollo Global Management shares have slid hard from last year’s peak, but a historically powerful 296-day seasonal window is approaching that has often rewarded long exposure.

Key takeaways
- A 296-day seasonal window for Apollo Global Management begins on Mar 28, 2026 and has historically favored long positions.
- Across the past 10 years, the window has produced gains in 90% of cases, with 9 winners and 1 loser.
- Winning years have averaged a 44.26% gain, while including the lone losing year still leaves a 40% average profit across all years.
- The pattern’s TradeWave Ratio of 1.81 and Sharpe ratio of 1.27 point to strong upside moves relative to risk.
- Intraperiod swings have been large, with some years showing double-digit drawdowns even when the window finished higher.
- APO is trading about 31.9% below its 52-week high after a one-day drop of 8.6%, setting up a sharp contrast with the bullish seasonal backdrop.
According to historical data from TradeWave.ai, Apollo’s upcoming 296-day stretch behaves very differently from an average year, with a distinct long-side bias that has repeated across the past decade.
Seasonal window
Apollo Global Management has risen in 9 of the past 10 years during this 296-day window, averaging 44.26% gains in winning seasons while still posting a 40% average profit across all years. The next iteration of that long regime begins on Mar 28, 2026, with the stock currently at $104.60 after a sharp pullback that leaves it about 31.9% below its 52-week high of roughly $153.66.
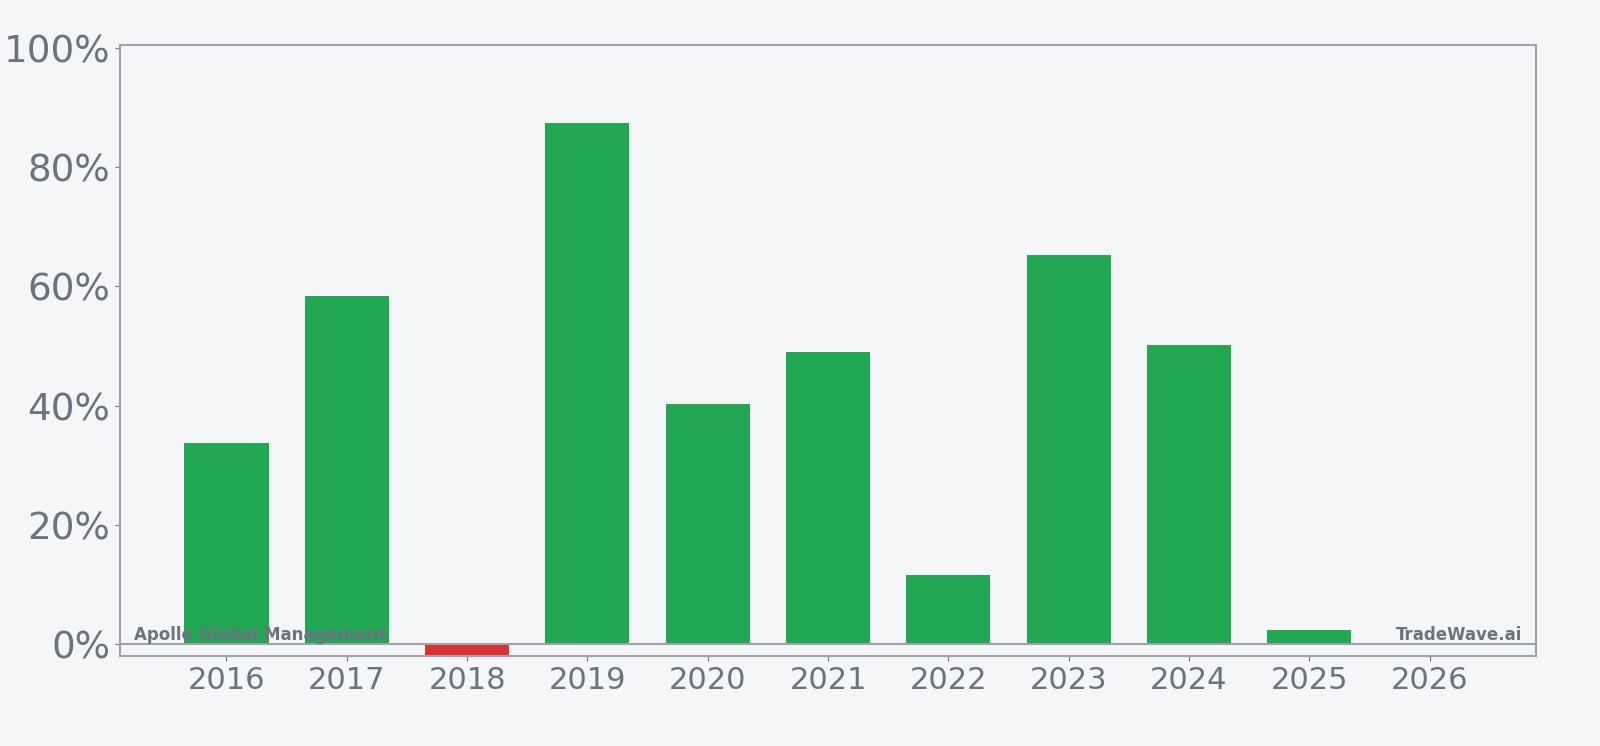
Historically, this has been a long-biased regime for APO. The trade direction is explicitly long, and the 90% win rate means only one of the past ten windows finished lower. That losing year, 2018, saw a modest 1.85% decline, while the strongest season in 2019 delivered an 87.45% gain from entry to exit.
The gap between Avg Profit of 44.26% for winners and Avg Profit - All of 40% shows that the lone down year has not meaningfully diluted the overall profile. Median Profit of 44.69% sits close to the average, which suggests the upside has not been driven by a single outlier but by a cluster of strong seasons.
Intraperiod swings have been large. Maximum favorable excursions, the best point-to-peak moves within each window, have ranged from 12.95% in 2022 to 88.71% in 2019. Maximum adverse excursions, the worst drawdowns from entry, have stretched as deep as 26.8% in 2022 and 25.1% in 2025, even though both of those years ultimately finished higher.
The TradeWave Ratio of 1.81 captures how far APO has typically traveled in the trade direction during the window, independent of where it closed. Combined with a Sharpe ratio of 1.27 based on end-of-window outcomes, the pattern points to a regime where upside has historically outweighed volatility, but not without sizable air pockets along the way.
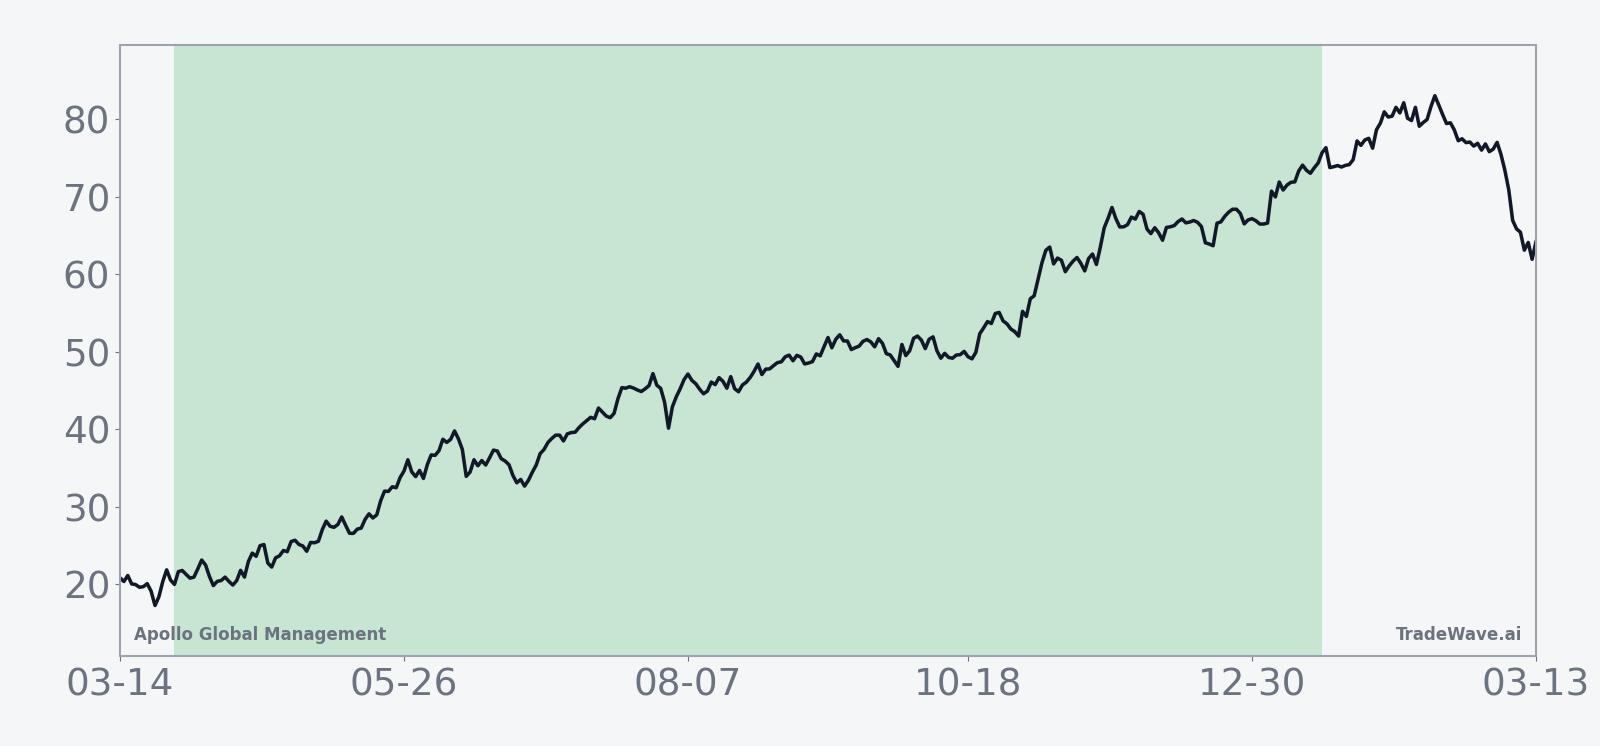
The 10-year average trend line for the window shows gains building over time rather than spiking in a single short burst. In several years, including 2017, 2019 and 2023, the stock pushed to its maximum favorable move late in the window, which fits a pattern of compounding strength rather than a quick pop and fade.
Year-by-year bars that combine net results with peak rallies and worst drawdowns show how often APO has powered higher despite deep interim dips.
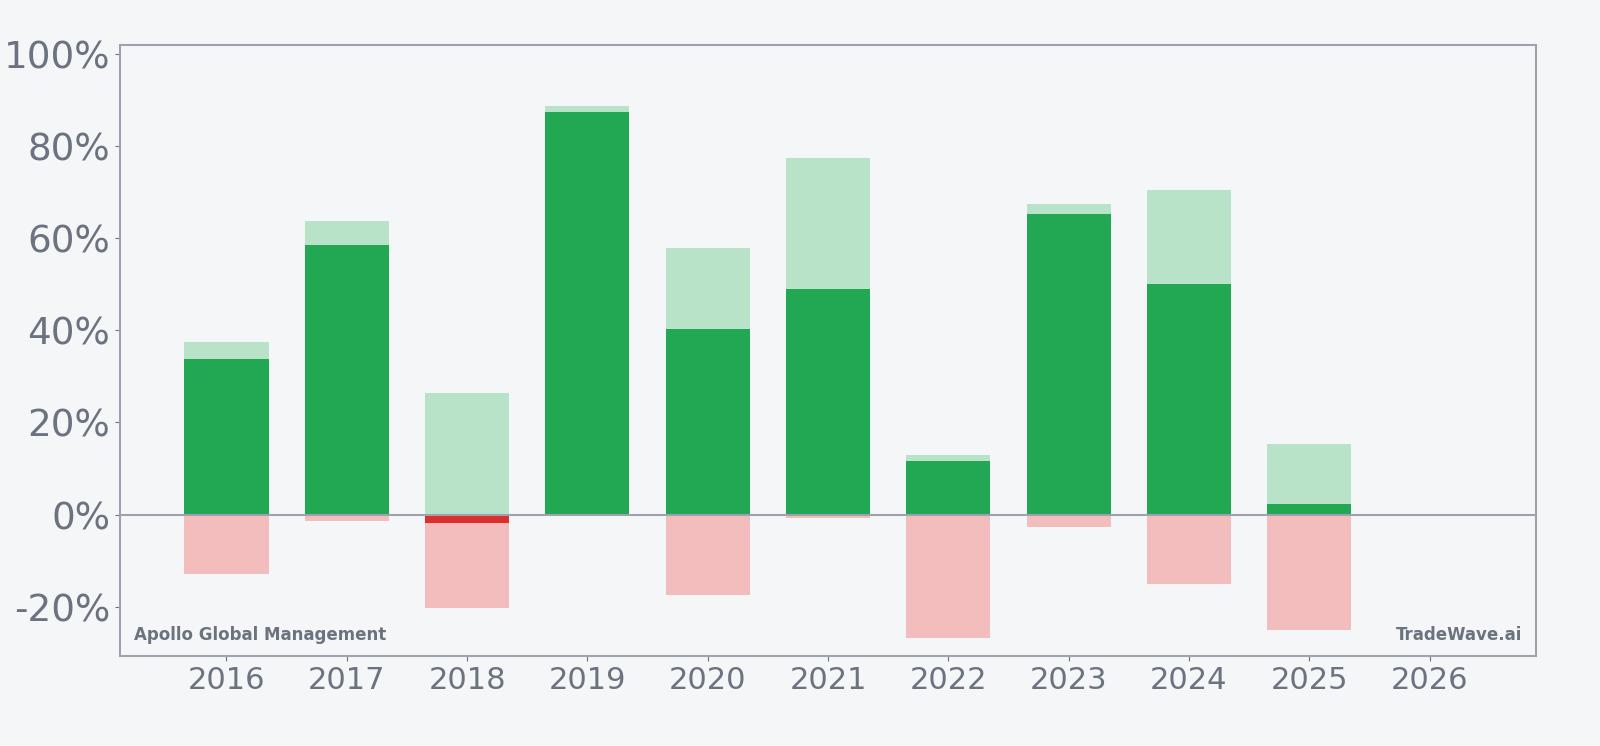
History does not guarantee future results; adverse excursions (MAE) can be large even in winning windows.
Add it up: nine for ten on the win side, double-digit average gains and repeated big rallies, but with drawdowns that have often tested conviction before the window finished.
Price and near-term drivers
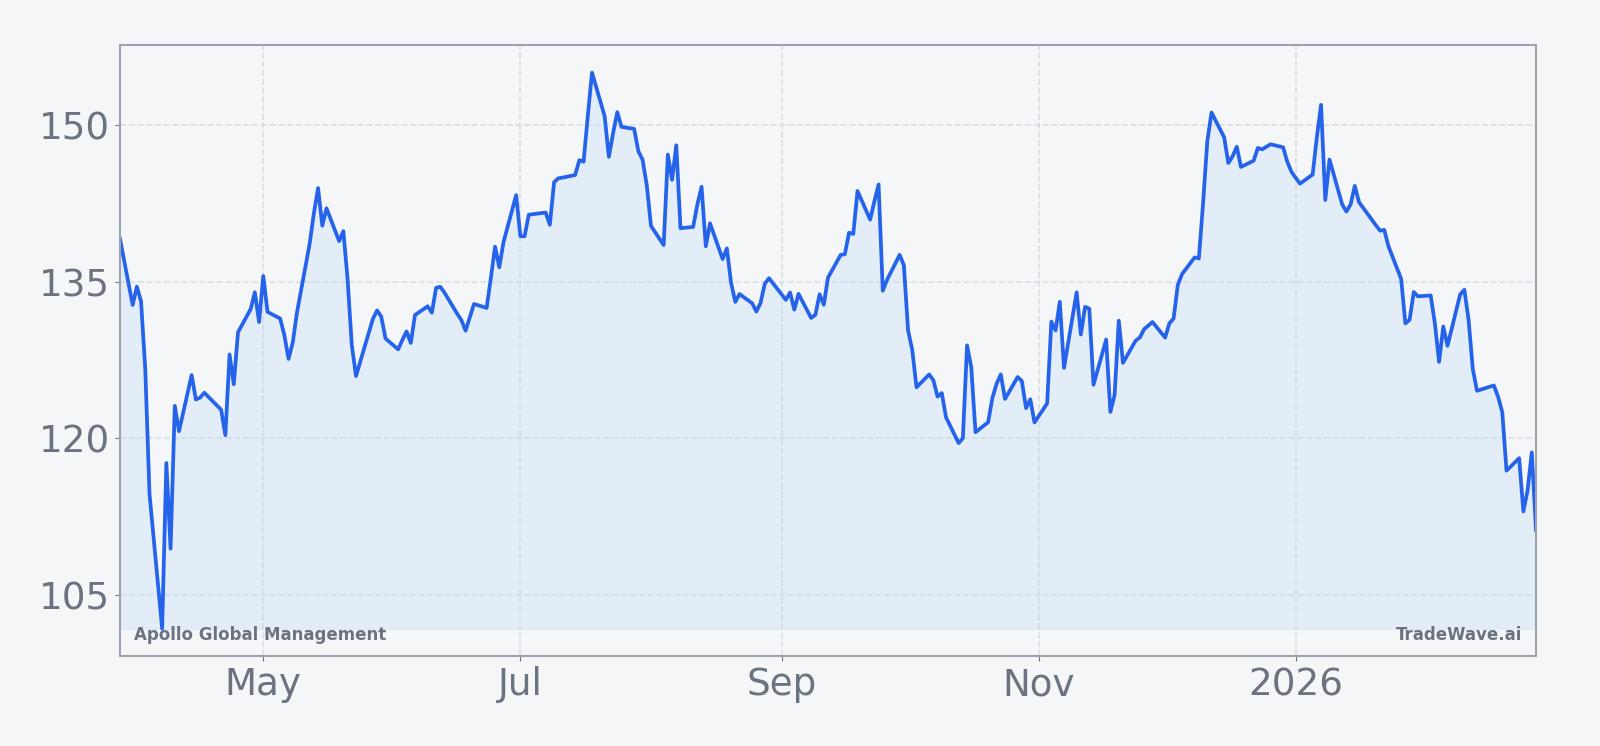
Apollo Global Management closed at $104.60 on Mar 2, down 8.6% on the day and roughly 21.6% lower over the past month, with the stock sitting well below its 50-day moving average of about $134.85 and only a few dollars above its 52-week low near $99.51. Trading volume spiked to more than 15.1 million shares, more than double the recent 20-day average of about 6.4 million, underscoring how quickly sentiment has swung after last year’s run toward the mid-$150s.
The pullback comes against a backdrop of aggressive expansion. On Feb 9, 2026, The Wall Street Journal reported that Apollo had raised a record $228 billion in fresh capital, pushing deeper into new markets and broadening its reach beyond traditional institutional funds into individual investors and retirement plans.[4] That capital-raising firepower has helped Apollo lean into credit and alternative strategies at a time when higher interest rates have complicated classic private equity deals.[1]
Earlier earnings cycles showed how that shift has been paying off. In August 2025, Apollo topped profit estimates as fee-related earnings and inflows hit records, with adjusted net income of $1.18 billion for the quarter.[1] By Nov 4, 2025, the firm again beat expectations, with adjusted net income per share of $2.17 versus a $1.91 estimate and fee-related earnings climbing to a record $652 million as assets under management reached $908 billion.[2]
Strategic moves have extended beyond core funds. In August 2025, Apollo agreed to acquire a majority stake in Stream Data Centers, a builder of large-scale US data centers, positioning the firm to benefit from surging demand for digital infrastructure.[8] Around the same time, Apollo-backed Phoenix Education Partners filed for a US IPO, adding another potential monetization path for the firm’s education holdings.[3]
Not every headline has been positive. On Nov 25, 2025, Apollo was named in an antitrust lawsuit alleging a credit-market cartel that restricted access to certain financing channels.[7] Earlier in 2025, Bloomberg reported that Apollo and partner Vistria were weighing an IPO or sale of the University of Phoenix, with potential valuations in the $1.5 billion to $1.7 billion range, highlighting both opportunity and execution risk around portfolio exits.[5]
In March 2025, Apollo also extended a $275 million loan tied to luxury Wall Street apartments in New York, a deal that underscored the firm’s growing presence in private credit and real estate lending as banks pulled back.[6] Sector-wide, private equity managers have been navigating a tougher backdrop for traditional buyouts as higher rates pressure valuations, but Apollo has leaned into credit and structured solutions to keep earnings growing.[1]
The chart below situates the latest move in its recent multi-month context.
What to watch as the window approaches
The next 296-day seasonal window for Apollo Global Management does not begin until Mar 28, which gives investors several weeks to see whether the current selloff stabilizes or deepens. Historically, even strong seasonal years have tolerated drawdowns of 15% to more than 25% inside the window before finishing higher, so how APO behaves around the $100 area will matter for anyone eyeing the long-biased regime.
First, watch whether the stock can reclaim its 50-day moving average near $134.85 in the months after the window opens. In many of the strongest historical years, including 2017, 2019 and 2023, APO spent much of the window grinding higher rather than chopping sideways, and a sustained move back above key moving averages would rhyme with that pattern.
Second, monitor the firm’s next earnings update and any commentary on fee-related earnings, credit deployment and Athene’s contribution. Prior reports showed that record fee income and rising assets under management were central to Apollo’s ability to grow through a higher-rate environment.[1][2] If those engines stay intact, they could provide fundamental support during a window that has historically rewarded long exposure.
Third, keep an eye on legal and regulatory developments around the credit-market lawsuit and any updates on portfolio monetizations such as the University of Phoenix and Phoenix Education Partners.[3][5][7] Large settlements, delays or failed exits would not erase the seasonal tendency, but they could shape how much of the historical upside is realized in this cycle.
Finally, track trading behavior as the window gets underway: whether volume remains elevated, whether dips toward the 52-week low attract buyers, and whether rallies are accompanied by broad participation across financials. The historical pattern is clear on direction but not on path, and the size of past intraperiod drawdowns is a reminder that even a strong seasonal tailwind can come with sharp turbulence along the way.
Sources
- [1] Reuters, "Apollo tops profit estimates on strong fee-related earnings, inflows," Aug 5, 2025.
- [2] Reuters, "Apollo pledges future growth as profit, assets swell," Nov 4, 2025.
- [3] Reuters, "Apollo-backed Phoenix Education Partners files for US IPO," Aug 29, 2025.
- [4] The Wall Street Journal, "Apollo Looks to New Markets After Strong Quarter," Feb 9, 2026.
- [5] Bloomberg, "Apollo, Vistria Weigh IPO or Sale of the University of Phoenix," Mar 6, 2025.
- [6] Bloomberg, "Apollo Lends $275 Million for Luxury NYC Wall Street Apartments," Mar 3, 2025.
- [7] The Wall Street Journal, "Asset Managers Including Apollo, Ares Sued for Alleged Credit-Market Cartel," Nov 25, 2025.
- [8] Bloomberg, "Apollo Global to Buy Builder of Large-Scale US Data Centers," Aug 6, 2025.