NextEra Energy (NEE) Has Gained in 15 of 15 Spring-Summer Windows as 133-Day Run Opens
NextEra Energy is heading into a historically powerful 133-day seasonal stretch just as shares trade near a 52-week high and investors absorb fresh equity financing.
Key takeaways
- NextEra Energy has finished higher in this 133-day spring–summer window in all 15 years of data, with 15 winners and 0 losers.
- The upcoming window begins on Mar 11, 2026 and historically aligns with an average gain of 9.8% for the stock.
- The pattern is long-biased, with a Trade Direction of “long,” a TradeWave Ratio of 1.51 and a Sharpe ratio of 1.21.
- Some years have seen sharp intraperiod swings, including sizeable drawdowns even in ultimately positive windows.
- NEE closed Monday at $93.77, up 1.9% on the day and about 0.9% below its 52-week high, leaving little margin for error as the window approaches.
- Fresh equity financing and sector strength tied to AI-driven power demand set the backdrop for this historically strong seasonal regime.[4][6]
According to historical data from TradeWave.ai, this specific spring–summer stretch has behaved very differently from an average quarter for NextEra Energy. The next section unpacks how that pattern has played out across the past decade and a half.
Seasonal window
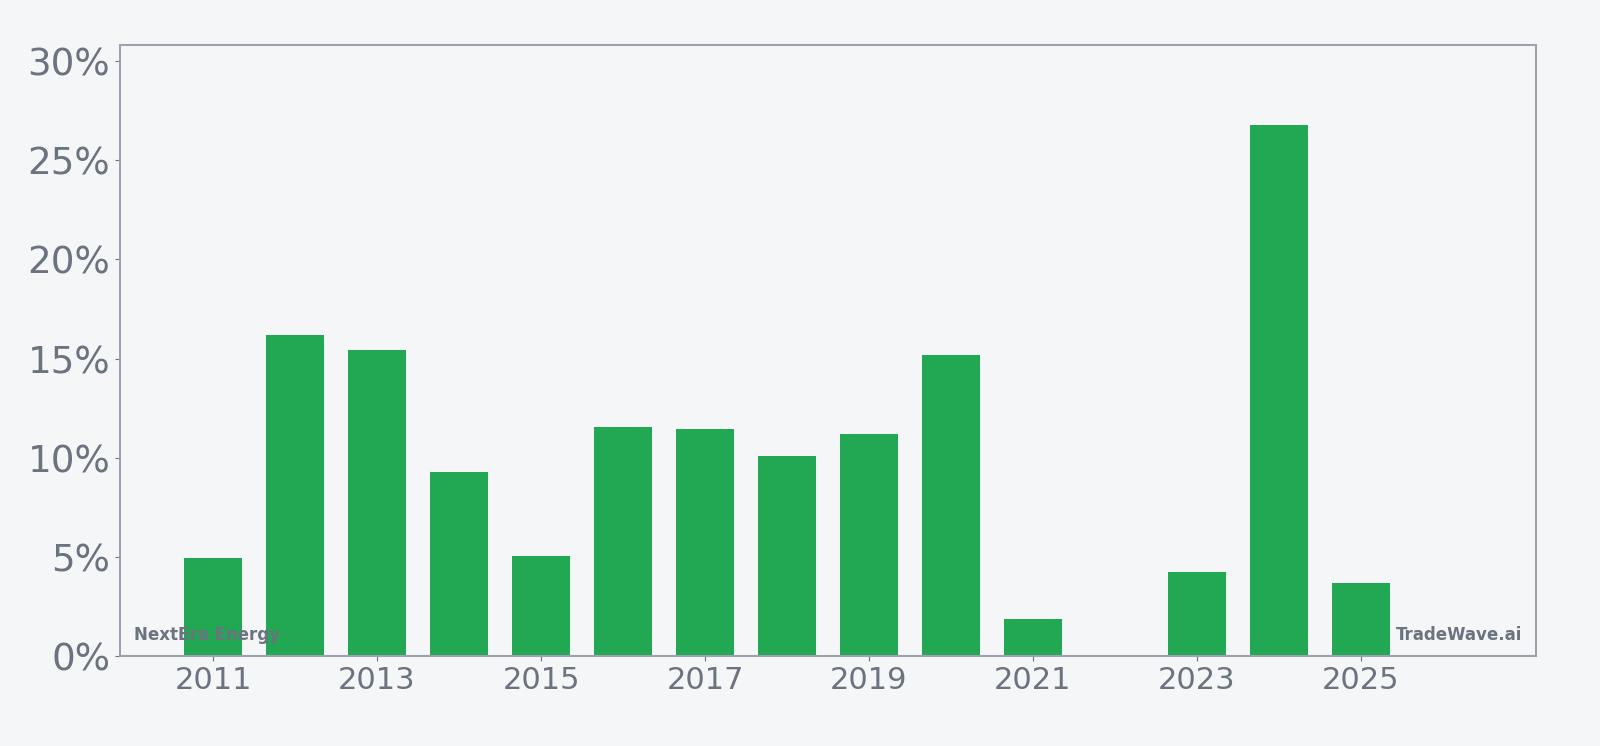
NextEra Energy has posted gains in 15 of 15 years during this 133-day spring–summer window, averaging a 9.8% rise. The next iteration starts on Mar 11, 2026, with the stock currently at $93.77, up 1.9% Monday and trading about 0.9% below its 52-week high of $94.61.[4] That combination of a near-perfect historical record and a price sitting just under a one-year peak gives this window unusual weight for traders watching the name.
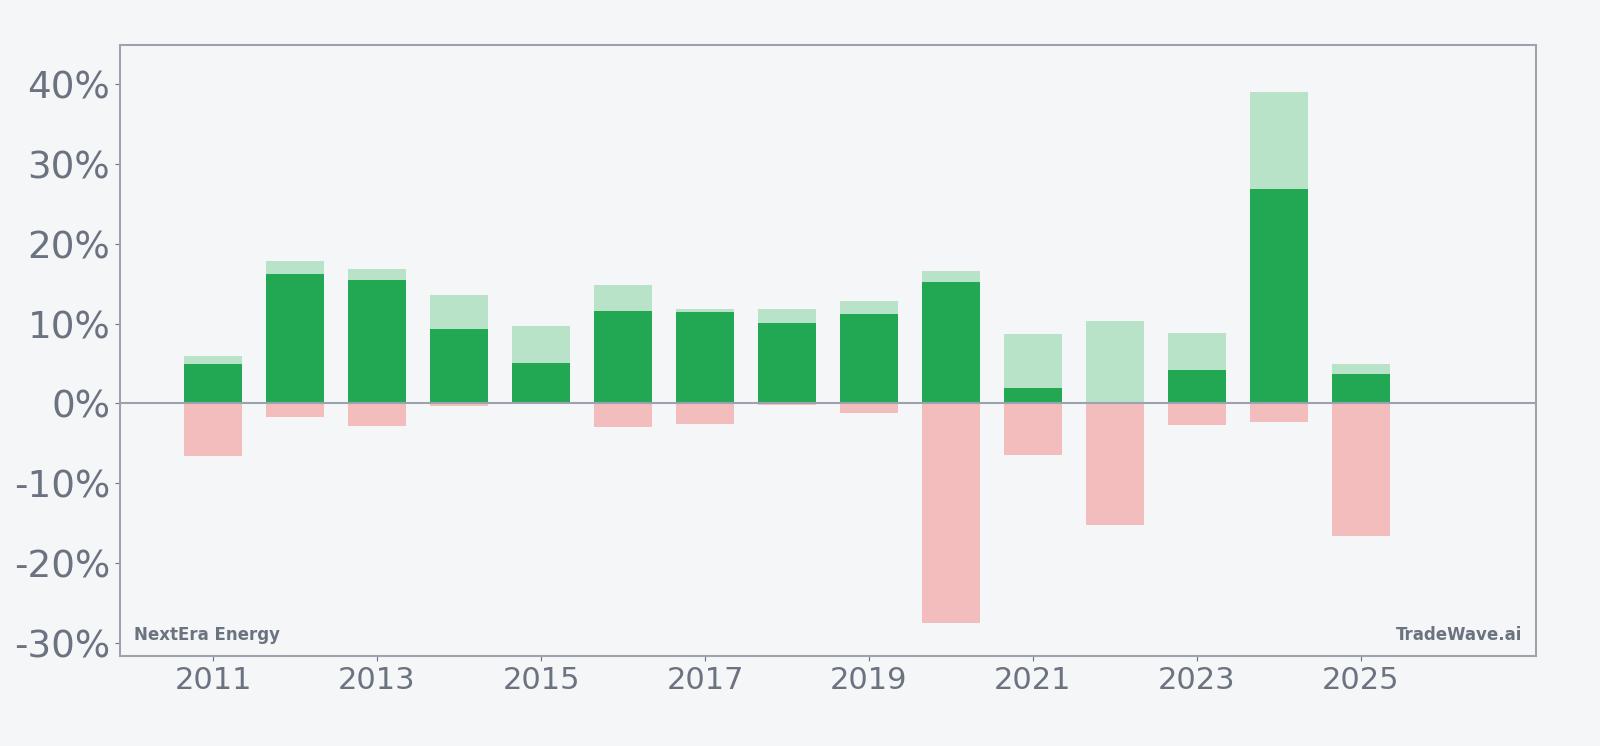
A second view layers in both the best and worst intraperiod swings for each year.
Across the 15-year sample, every single iteration of this window has ended in the green for a long position, with an average gain of 9.8% and a median outcome of 10.1%. The long bias is clear: 15 winners, 0 losers and a Sharpe ratio of 1.21 point to a stretch that has historically rewarded staying long rather than fading strength.
The TradeWave Ratio of 1.51 indicates that price has typically traveled meaningfully in the trade direction within the window, not just drifted higher by a few points. In strong years such as 2024, the stock logged a 26.79% net gain with a maximum favorable move of 39.05% from entry, while even softer years like 2021 still finished positive, albeit with only a 1.91% net rise.
Intraperiod swings have not been trivial. In 2020, the stock ultimately gained 15.17% over the window, but at one point it was down as much as 27.55% from the starting level. In 2025, the net gain was 3.72%, yet the worst drawdown inside the window reached 16.63%, showing that even winning years have demanded a strong stomach.
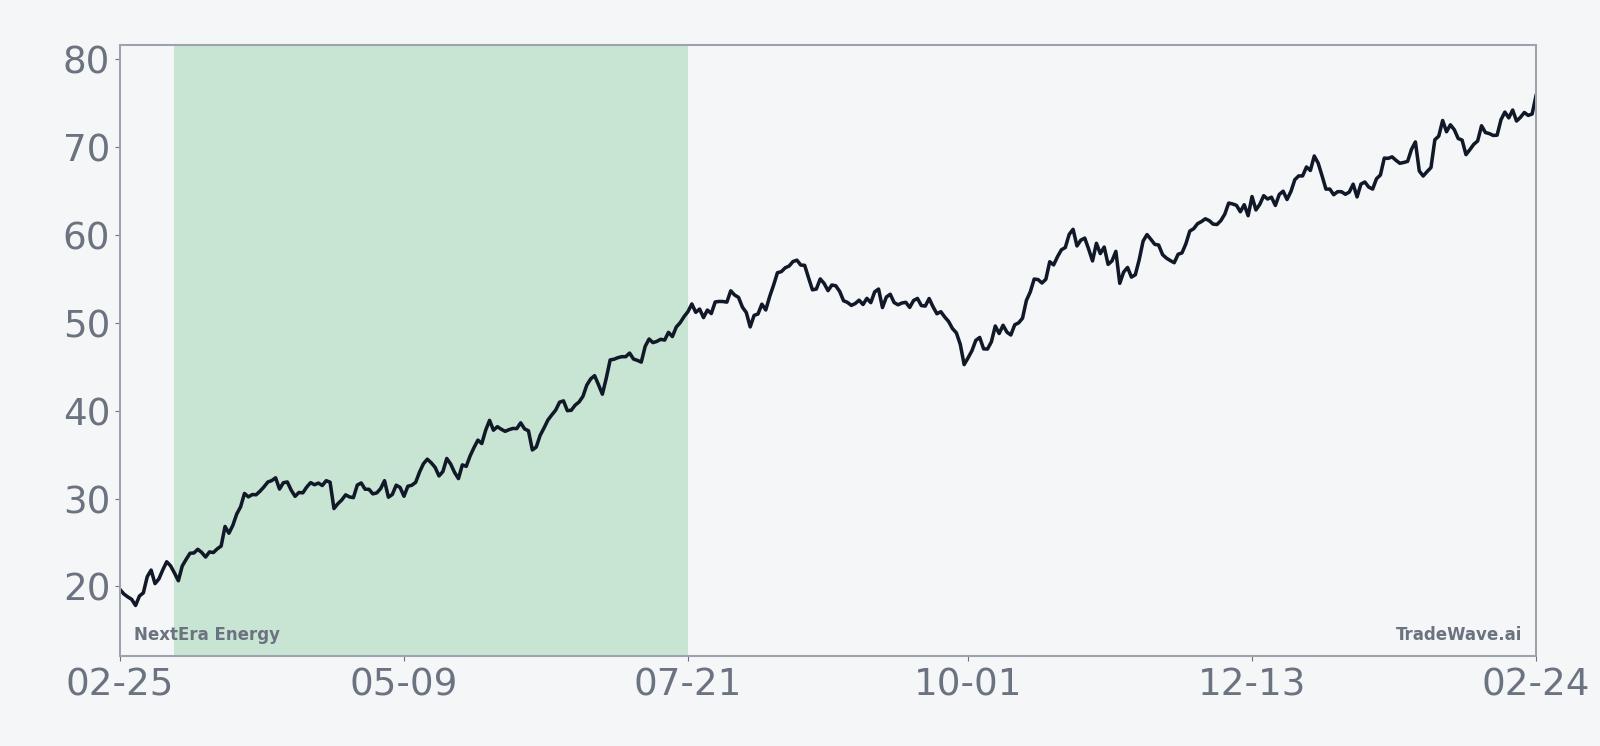
The seasonal trend chart suggests that gains have tended to build gradually rather than in a single burst. The average path shows a steady climb through the middle of the window, with some choppiness toward the end as prior rallies consolidate. That pattern fits a story where investors price in growth and project news over several months instead of reacting to a single catalyst.
The combined net/MFE/MAE bars underline that profile. Many years show maximum favorable moves well into double digits, while the worst adverse excursions vary widely, from shallow pullbacks of a few percent to deep, fast drawdowns. The mix points to a window that has historically offered sizable upside for longs but has not spared them from volatility along the way.
History does not guarantee future results; adverse excursions can be large even in winning windows, and traders should treat the pattern as context rather than a forecast.
Price and near-term drivers
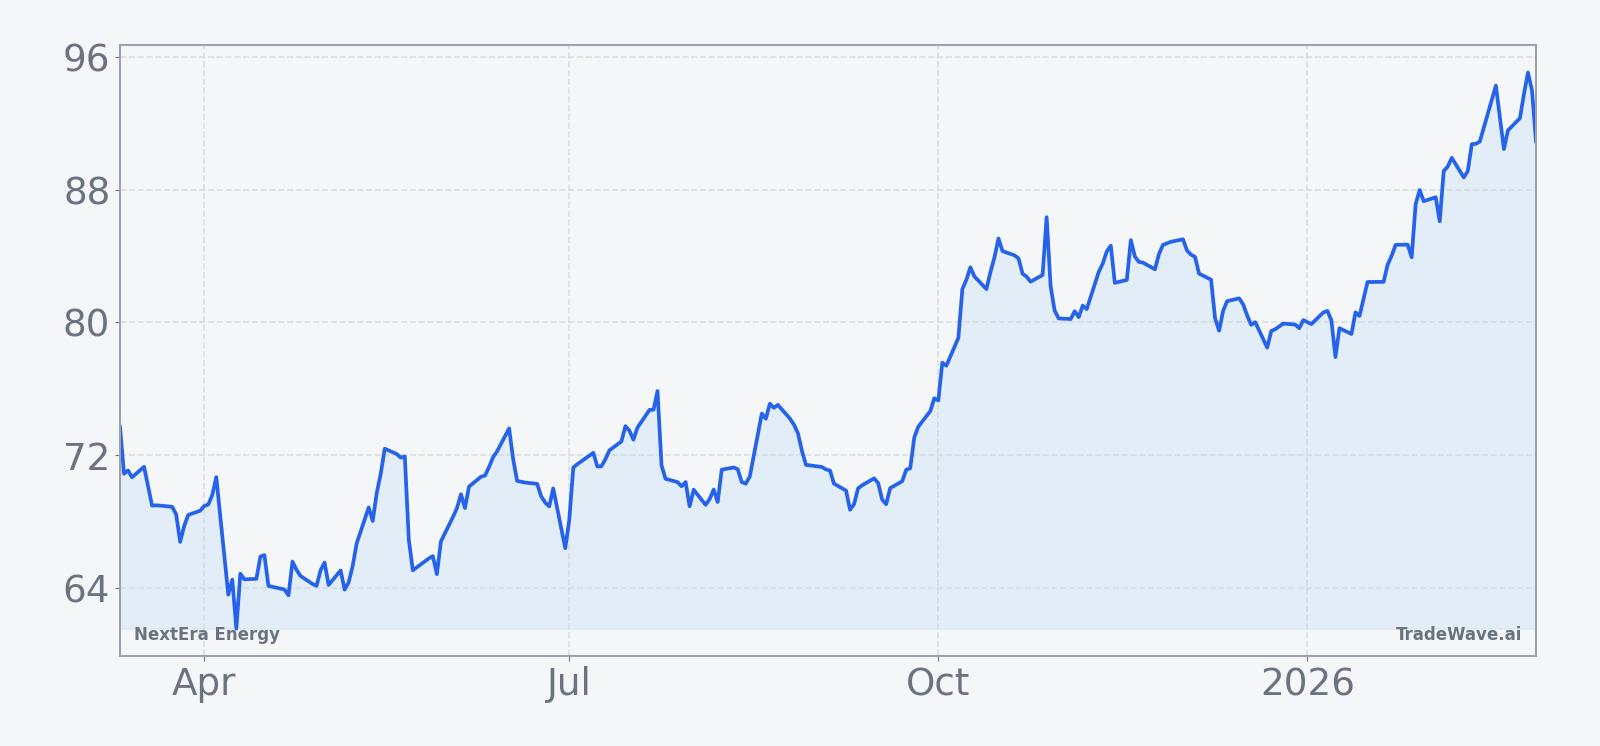
NextEra Energy shares closed Monday at $93.77, up $1.78 or 1.9% on the day, after trading between $90.65 and $94.14 on volume of about 25 million shares.[4] The stock sits just under its 52-week high of $94.61 and well above its 50-day moving average of $84.64, with a one-month gain of 7.79% that reflects renewed interest in utilities tied to data center power demand.
The latest catalyst is fresh financing. On Feb 26, 2026, NextEra Energy said it would sell $2 billion of equity units to help fund its energy project pipeline, a move that adds capital for growth but also modestly dilutes existing shareholders.[4] The stock’s ability to push toward a one-year high in the wake of that announcement suggests investors are comfortable with the balance between dilution and long-term project returns.
Sector context is supportive. Utility stocks, including NextEra Energy, have been benefiting from rising demand linked to artificial intelligence and data centers, with the group up 18% year-to-date according to recent sector commentary.[6] That backdrop has helped reframe NEE less as a sleepy regulated utility and more as a critical infrastructure play for the digital economy.
Longer-term growth narratives also matter. In March 2025, NextEra’s leadership projected a 55% jump in global power demand over the next 20 years, with a notable share coming from data centers, underscoring why hyperscale computing has become central to the company’s pitch.[2] In December 2025, the company’s partnership with Google to develop data centers alongside power plants reinforced that theme by tying NEE directly to one of the largest cloud and AI players.[5]
Regulatory and asset-level developments add another layer. In August 2025, the Federal Energy Regulatory Commission approved NextEra’s application to restart the Duane Arnold nuclear plant in Iowa by year-end 2029, potentially boosting the company’s long-duration baseload capacity.[1] That kind of incremental capacity can be important if the company is to meet the power needs implied by its own demand forecasts.
Ownership behavior has been active as well. In June 2025, Reuters reported that NextEra employees realized $45 million in gains from selling company stock in their retirement plan, a reminder that insiders and staff have been taking profits after a volatile stretch for the shares.[3] While that activity does not signal a directional call on its own, it shows that some internal holders have been willing to lighten up into strength.
The chart below situates the latest move in its recent multi-month context.
Macro and valuation backdrop
NextEra’s seasonal pattern is unfolding against a macro story that leans in its favor. Expectations for a multi-decade surge in electricity demand, driven by AI workloads, electrification and data centers, have turned the utility sector into a growth proxy rather than a pure defensive trade.[2][6] That shift helps explain why NEE is trading above its 50-day average and near a one-year high even after announcing new equity issuance.
Valuation markers are harder to pin down without a fresh consensus earnings view, but the market’s willingness to fund $2 billion of new equity at these levels suggests investors still see attractive project returns.[4] The key question for the coming window is whether execution on large-scale projects and regulatory milestones can keep pace with the growth narrative that has pulled the stock higher.
What to watch as the window opens
The 133-day window starting Mar 11 has a rare track record: 15 winners, no losers and an average gain near 10%. For traders and longer-term holders alike, the next few weeks will show whether NEE can extend that streak from a starting point just shy of a 52-week high.
First, watch how the stock behaves around the $94–95 area. A clean break above the prior 52-week high with volume holding near or above the recent 20-day average of roughly 10.4 million shares would signal that investors are willing to keep paying up for the growth story even after the equity units announcement.[4] Failure to hold that zone, especially if it coincides with broader utility weakness, would mark an early test of the historical pattern.
Second, monitor follow-through on the financing and project pipeline. Any updates on how the $2 billion in equity units will be deployed, or on large-scale data center and nuclear projects, could either reinforce or undercut the growth assumptions that have supported the stock.[1][4][5] Positive progress here would fit the historical script of a strong spring–summer stretch, while delays or cost surprises would raise the odds of a choppier path inside the window.
Third, keep an eye on sector flows. If the utility group’s AI-driven rally stalls, NEE’s seasonal tailwind may have to work against a tougher tape.[6] Conversely, continued inflows into power and infrastructure names would give the stock a supportive backdrop as the historical regime kicks in.
Finally, volatility inside the window matters as much as the end result. Past cycles show that even winning years have seen double-digit drawdowns at some point, so traders will be watching how deep any pullbacks run before buyers step in. Add it up: a near-perfect seasonal record, a stock pressing against its highs and a sector riding a structural demand story make this upcoming window one of the more consequential stretches on the calendar for NextEra Energy.
Sources
- [1] Seeking Alpha, "NextEra Energy wins FERC approval for nuclear restart of Iowa's Duane Arnold plant," Aug 27, 2025.
- [2] Reuters, "CERAWEEK NextEra Energy expects 55% jump in global power demand over the next 20 years, CEO says," Mar 10, 2025.
- [3] Reuters, "NextEra workers net $45 million from sales of company stock," Jun 12, 2025.
- [4] Reuters, "NextEra Energy to sell $2 billion of equity units to fund energy projects," Feb 26, 2026.
- [5] Bloomberg, "Google and NextEra to Develop Data Centers With Power Plants," Dec 8, 2025.
- [6] Reuters, "Utility Sector Performance and AI-driven demand," 2025–2026 sector overview.