Carnival (CCL) Has Delivered 8 of 8 Wins for Bears in This 41-Day Spring Window
Carnival shares have rallied strongly year to date but sit well below last year’s peak, just as a historically bearish 41-day spring window for the stock’s short side approaches.

Key takeaways
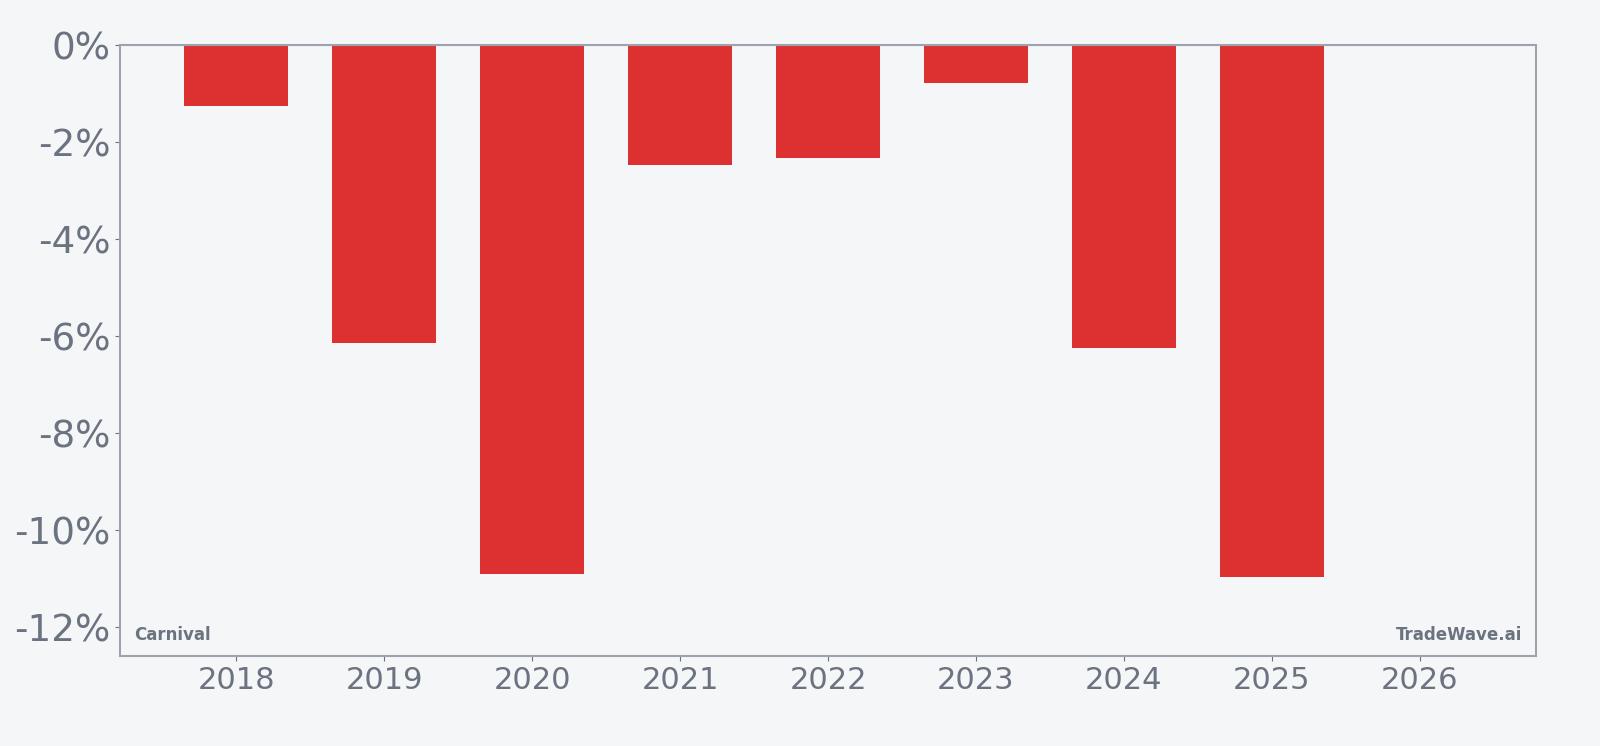
- Carnival’s upcoming 41-day window starting Mar 16 has favored short positions in all 8 years of data, with 8 winners and 0 losers.
- The pattern has delivered an average profit of 5.14% for shorts, with a 48% cumulative gain across the sample.
- Intraperiod swings have been wide, with some years showing double-digit favorable moves for shorts alongside deep temporary rallies against the trade.
- CCL trades at $28.04, up about 23% year to date but roughly 17.6% below its 52-week high of $34.03, after a sharp one-month pullback.
- Fundamentals remain solid, with Carnival beating recent earnings expectations and guiding to higher 2025 profit, even as the chart shows a potential cup-and-handle setup.
According to historical data from TradeWave.ai, this specific spring stretch has behaved very differently from an average month on the calendar for Carnival, and the next iteration is about to open again.
Seasonal window
Carnival has produced profitable short-side trades in 8 of 8 years during this 41-day spring window, with an average gain of 5.14% for bears. The next iteration begins on Mar 16, with the stock last changing hands at $28.04, about 17.6% below its 52-week high of $34.03 and still up roughly 23% for 2026. That mix of a strong year-to-date rebound and a clean seasonal record on the short side gives traders a defined calendar to watch for potential volatility.
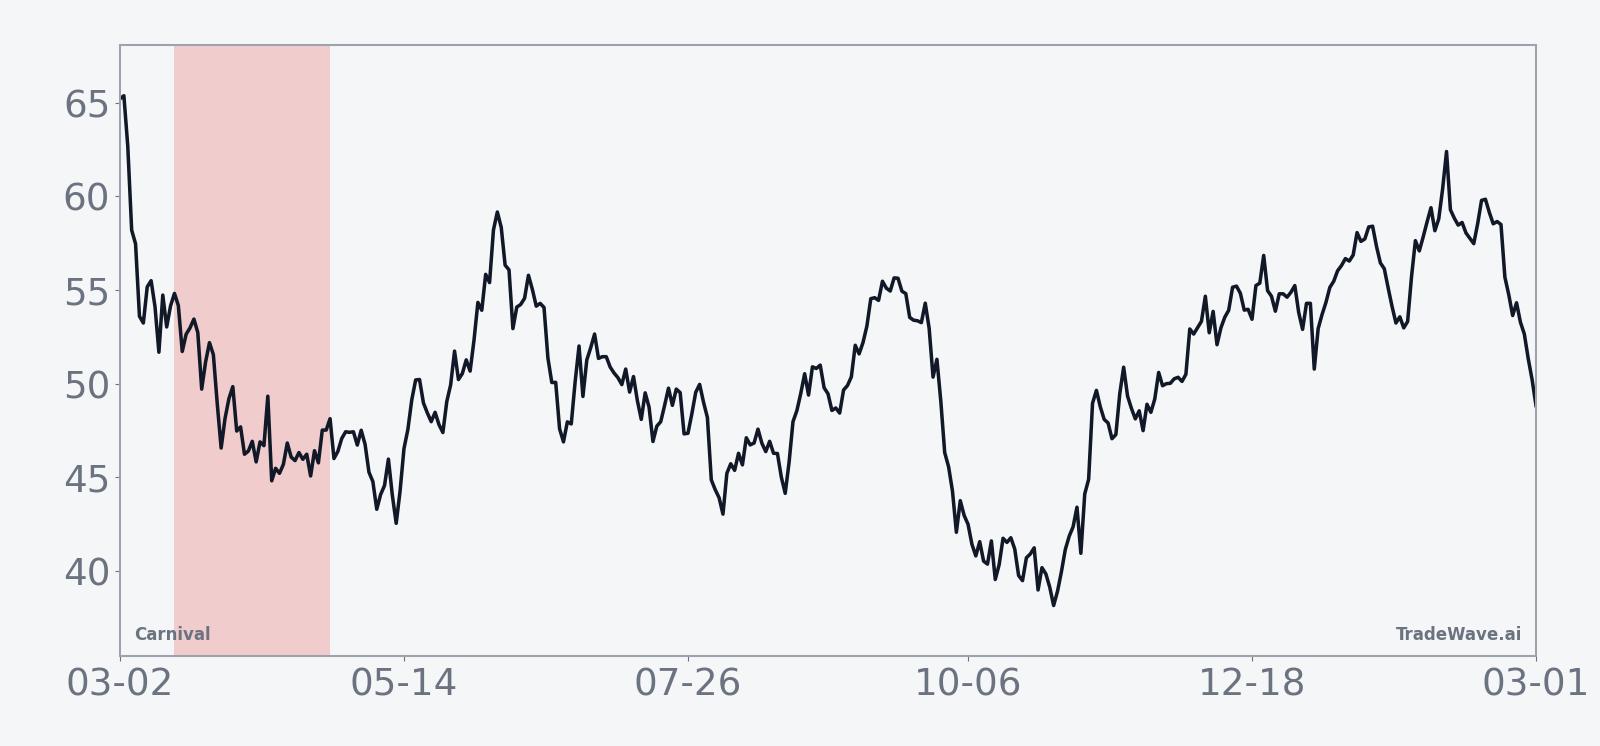
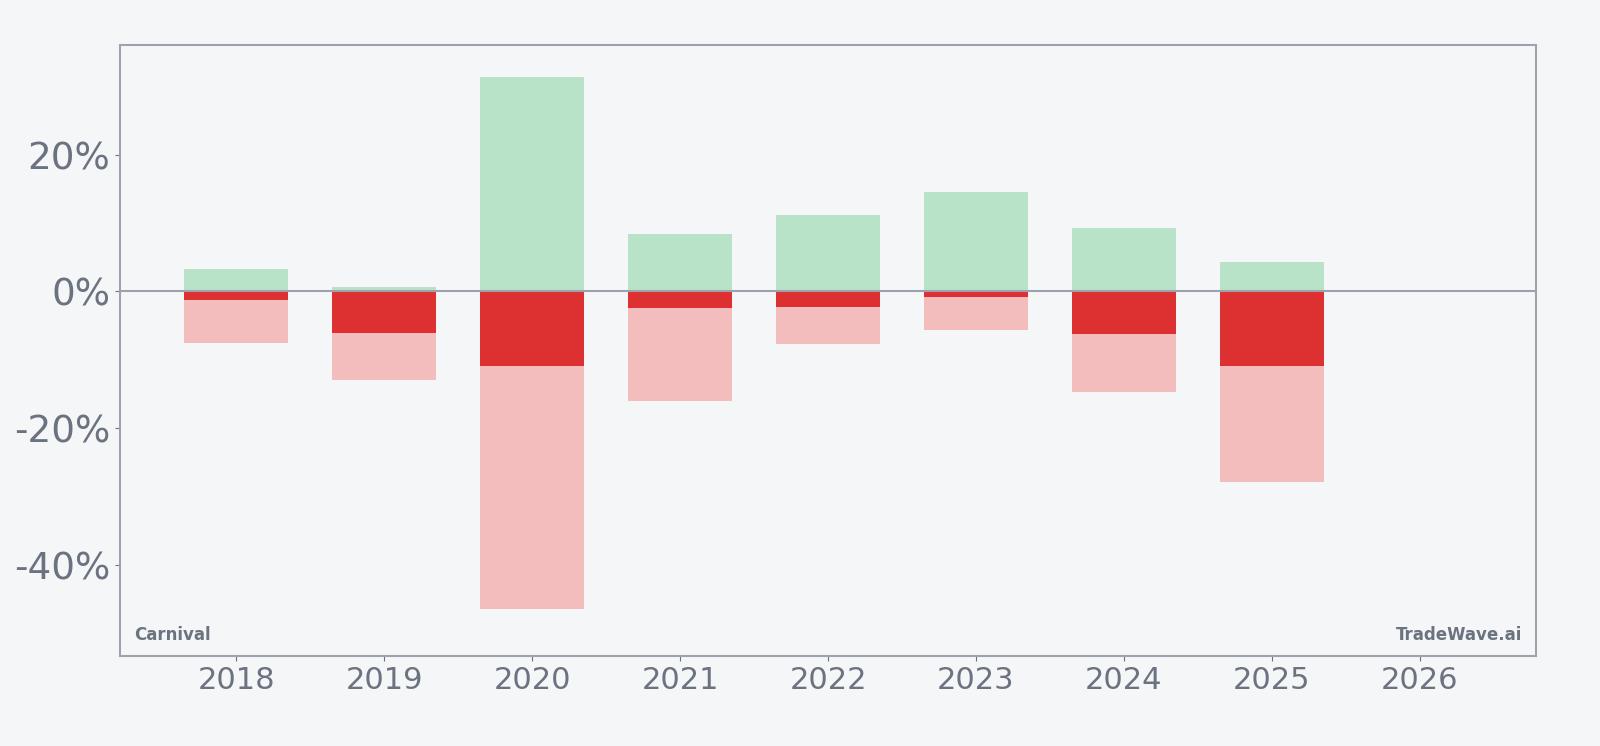
A combined view of net results with peak rallies and drawdowns shows how far the stock has tended to travel inside this window.
Across the eight-year sample, every iteration of this window has ended with Carnival lower than where it started, which is favorable for the short trade direction. The median profit of 4.31% sits slightly below the 5.14% average, suggesting a few larger wins have pulled the mean higher while most years still delivered mid-single-digit declines. Add it up and the cumulative return for the pattern is 48%, a meaningful edge for a window that lasts less than two months each year.
The per-year breakdown shows that the strongest short-side years were 2020 and 2025, when net returns reached about 10.91% and 10.96% respectively as the stock slid sharply over the window. At the other end of the spectrum, 2023 delivered a modest 0.78% gain for shorts, underscoring that even in winning years the final move can be relatively small. That mix of outcomes is reflected in a standard deviation of 4.11%, which keeps the Sharpe ratio at 1.14 despite the perfect win record.
Intraperiod swings have been large. In 2020, the maximum favorable move for shorts reached 31.37%, while the worst drawdown against the position in that same year hit 46.47% from entry, showing how violently the stock has whipsawed inside this calendar slice. Other years tell a similar story on a smaller scale, with maximum adverse moves such as 16.04% in 2021 and 27.86% in 2025, even though both windows ultimately finished in the shorts’ favor. For traders, that means the window has historically rewarded the direction but demanded a strong stomach for volatility.
The eight-year average trend line suggests that weakness has often been staggered rather than front-loaded. In several years, Carnival has chopped sideways or even bounced early in the window before rolling over more decisively later on, which lines up with the pattern’s relatively high TradeWave Ratio of 1.24. That figure signals that price has typically traveled meaningfully in the short direction at some point during the window, even when the final net move was more modest.
The combined net, maximum favorable, and maximum adverse bars reinforce that message. In most years, the maximum favorable move for shorts has been comfortably larger in magnitude than the final net decline, which implies that traders who timed exits well could have captured more than the simple close-to-close result. At the same time, the maximum adverse bars show that temporary rallies against the short have often been deep enough to challenge risk limits before the pattern ultimately resolved lower.
History does not guarantee future results, and the worst intraperiod drawdowns in this window have been large even in years that finished profitably for the short side.
Put together, the record is clear: this 41-day spring stretch has been a consistently negative period for Carnival’s share price in the past eight years, with a perfect record for shorts but a volatility profile that has punished anyone unprepared for sharp countertrend moves.
Price and near-term drivers
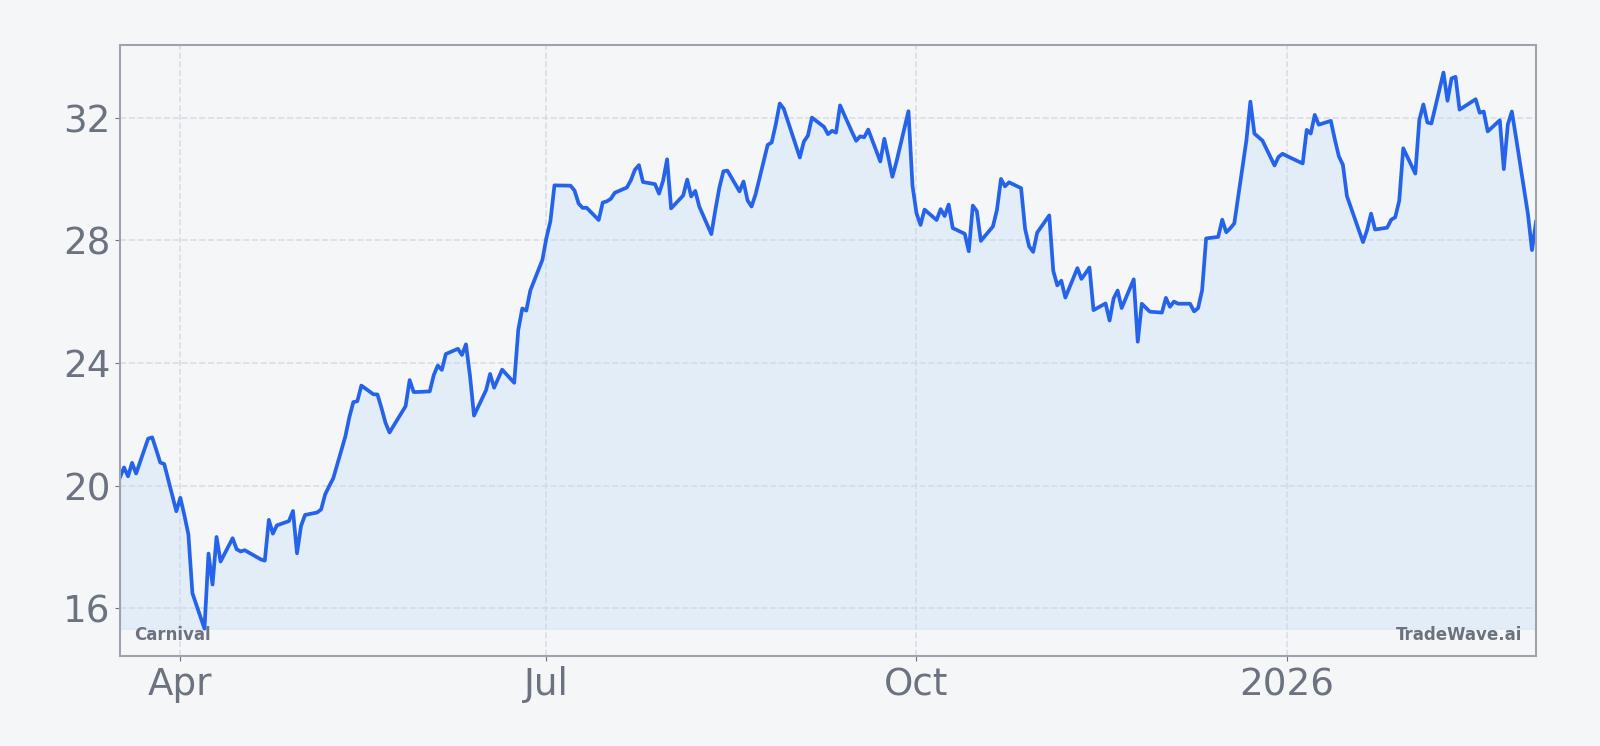
Carnival closed Thursday at $28.04, up 0.09% on the day, extending a rebound that has left the stock roughly 23% higher so far in 2026 but still well below its 52-week high of $34.03 and comfortably above the 52-week low of $15.07. The stock has dropped about 12.3% over the past month and now trades under its 50-day moving average of $30.99, a sign that the near-term trend has cooled after a strong run.
Fresh analysis this week pointed out that Carnival’s fundamentals remain robust, with high customer deposits, improving return on invested capital and a business that is shifting from survival mode to a deleveraging phase.[3] That backdrop has helped support a “Buy” consensus rating from Morningstar, even as the share price has given back some ground from late-2025 highs. The technical picture is more nuanced, with a Feb 18 note flagging a potential cup-and-handle pattern that, if confirmed, would typically be associated with upside breakouts rather than renewed weakness.[5]
On the earnings front, Carnival has been executing ahead of expectations. For the quarter ended Aug 31, the company delivered adjusted profit per share of $1.43, topping estimates of $1.32, on revenue of $8.15 billion versus forecasts of $8.10 billion.[1] Management has raised its adjusted EPS forecast for fiscal 2025 to about $2.14, up from a prior $1.97, even while flagging that cruise costs are expected to rise around 3.3%.[1][2] Earlier in the recovery, Carnival reported record revenue and net income as demand and efficiency measures kicked in, and by mid-2025 it said it had already exceeded its 2026 financial targets.[2][4]
Macro and sector currents are still blowing in Carnival’s favor. Strong cruise demand has persisted despite elevated costs, helped by investments in destinations and onboard experiences that support pricing power.[1] Across the travel space, customer deposits and bookings for 2026 have been described as running at record levels, underscoring how far the sector has come from the pandemic-era trough.[2] For a stock that remains sensitive to discretionary spending and fuel costs, that combination of resilient demand and improving balance sheet gives investors a fundamental cushion as they weigh the seasonal pattern.
The chart below situates the latest move in its recent multi-month context.
What to watch as the window opens
The next few weeks will test whether Carnival’s strong fundamentals and constructive chart setup can offset a spring window that has historically leaned hard in favor of shorts. Traders will be watching how the stock behaves as Mar 16 approaches, particularly around the $30 area near the 50-day moving average and the recent swing lows carved out during the February slide.
On the fundamental side, any updates on booking trends, pricing, or cost inflation will matter, especially given management’s upgraded 2025 profit guidance and the company’s push into a deleveraging phase.[1][3] A steady drumbeat of strong demand data would argue that any seasonal weakness is more about positioning and technicals than a change in the underlying story.
Inside the window itself, the key tell will be whether rallies are sold or sustained. Historically, even the winning short years have featured sharp countertrend spikes, so a pattern of intraday or multi-day pops that quickly fade would be consistent with the past. A clean break back above the 52-week high zone, by contrast, would mark a clear departure from the eight-year seasonal script.
For now, the takeaway is straightforward: Carnival heads into mid-March with a solid fundamental backdrop, a stock that has cooled after a big run, and a spring calendar slot that has delivered 8 of 8 profitable short-side years. How the price behaves inside that 41-day band will show whether this is the year the pattern finally breaks or another entry in a remarkably consistent seasonal record.