Apple Inc. (AAPL) Has Rallied in 10 of 10 Years in This 232-Day Seasonal Window
Apple Inc. is heading toward a long seasonal window that has never been negative in the past decade, just as the stock trades below its highs and investors focus on AI-driven growth and the next earnings leg.

Key takeaways
- Apple Inc. is approaching a 232-day seasonal window starting Mar 13 that has produced gains in 10 of 10 years.
- The pattern is long-biased, with an average profit of 24.51% across all years and a cumulative 737% gain over the decade.
- Every year in the sample was a winner, with no losing seasons in this window for Apple shares.
- The TradeWave Ratio of 1.4 and Sharpe ratio of 1.42 point to strong upside travel relative to risk in prior cycles.
- Intraperiod drawdowns have still been meaningful in some years, so investors have historically had to sit through volatility to capture the gains.
- The window opens as Apple trades about 9.6% below its 52-week high and as Wall Street frames 2026 as a key AI year for the company.[1][13]
According to historical data from TradeWave.ai, this upcoming stretch has behaved very differently from an average calendar period for Apple, and the next iteration is about to start.
Seasonal window
Apple Inc. has risen in 10 of 10 years during this 232-day window, averaging 24.51% gains with a long trade direction. The next window begins on Mar 13, 2026, with the stock last trading at $260.29, about 9.6% below its 52-week high of $288.08.[1]
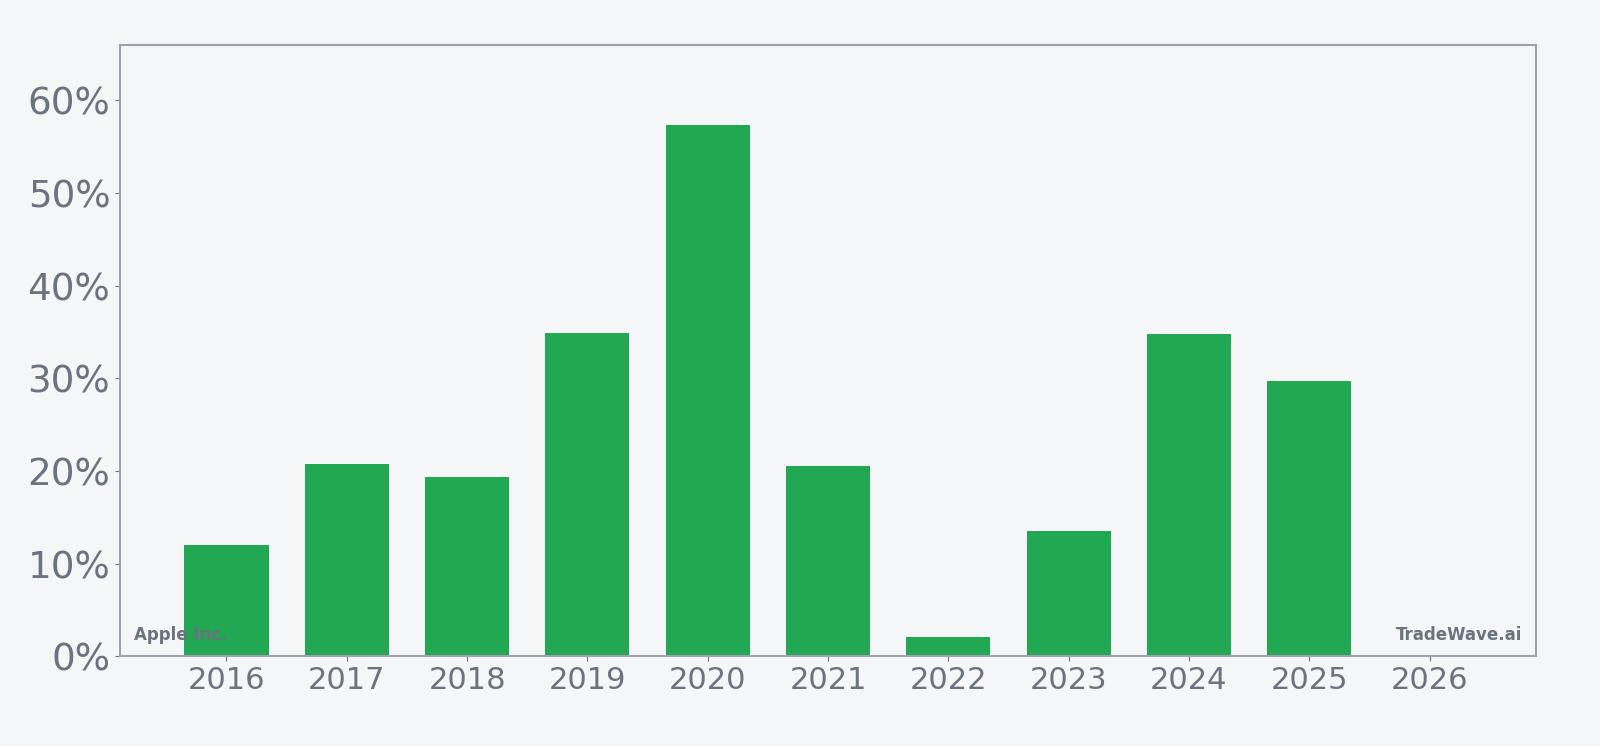
Across the past decade, this long-biased window has delivered a cumulative 737% return, with the median year posting a 20.63% gain. The strongest season in the sample was 2020, when Apple’s best point-to-peak move inside the window reached 99.45% and the final net gain was 57.36%, while the softest year was 2022, which still finished up 2.10% despite a much choppier path.
A stacked view of net returns with peak run-ups and worst drawdowns shows how upside and downside have coexisted inside this window.
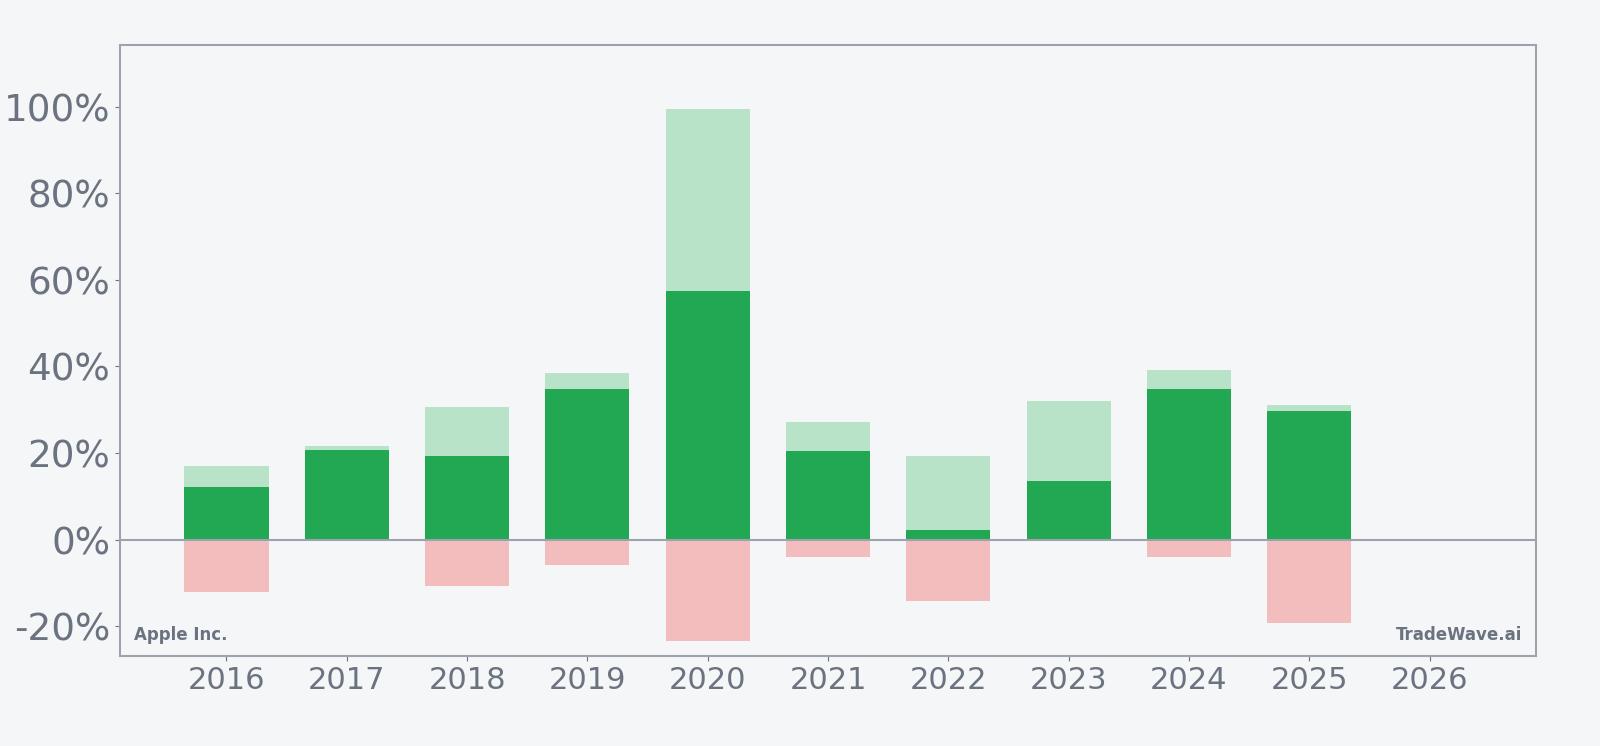
The maximum favorable excursions in many years, including 2019, 2020 and 2024, show that Apple has often staged large rallies at some point during the window, while the maximum adverse excursions in years like 2016, 2020 and 2025 reveal that those rallies have not come in a straight line. The TradeWave Ratio of 1.4 captures that historically, price has tended to travel meaningfully in the long direction during the window, and the Sharpe ratio of 1.42 suggests that the end-of-window outcomes have been strong relative to volatility. Add it up: 10 for 10 winning seasons with double-digit average gains makes this one of Apple’s most consistently positive long regimes in the past decade.
History does not guarantee future results, and even in winning windows the worst intraperiod drawdowns have been large enough to test conviction.
Price and near-term drivers
Apple shares closed at $260.29 on Mar 6, down 0.8% on the day, leaving the stock about 9.6% below its 52-week high of $288.08 and modestly above its 50-day moving average of $265.02 on a one-month gain of 2.48%.[1] The stock’s pullback from record territory comes after Apple projected 13% to 16% revenue growth for the March quarter on the back of record iPhone demand, a tone that helped reset expectations for 2026 growth.[1]
In late February, Wedbush framed the recent Apple sell-off as “unwarranted” and argued that 2026 is shaping up as the company’s year of AI, with new features expected to deepen engagement across the installed base.[13] That bullish narrative sits alongside a consensus “Buy” rating and a $290 price target from Wedbush Securities, which implies upside from current levels and reflects confidence that iPhone and services momentum can carry through the next product cycle.[9][11][13]
On the earnings front, Apple’s most recent quarter delivered revenue of $102.466 billion and earnings per share of $1.77, topping expectations as iPhone and services growth offset pockets of hardware softness.[1][5] Management guided to continued strength in services and iPhone, with AI integration flagged as a key driver of future revenue, which helps explain why investors are so focused on the company’s software roadmap into 2026.[1][7]
Sector-wise, Apple remains a bellwether for tech hardware and services, with strong iPhone demand and recurring services revenue helping to support sentiment across the broader complex.[2] At the same time, Apple’s AI positioning is increasingly tied into the wider theme of technology adoption, where investors are trying to separate durable earnings power from hype across the mega-cap cohort.[13]
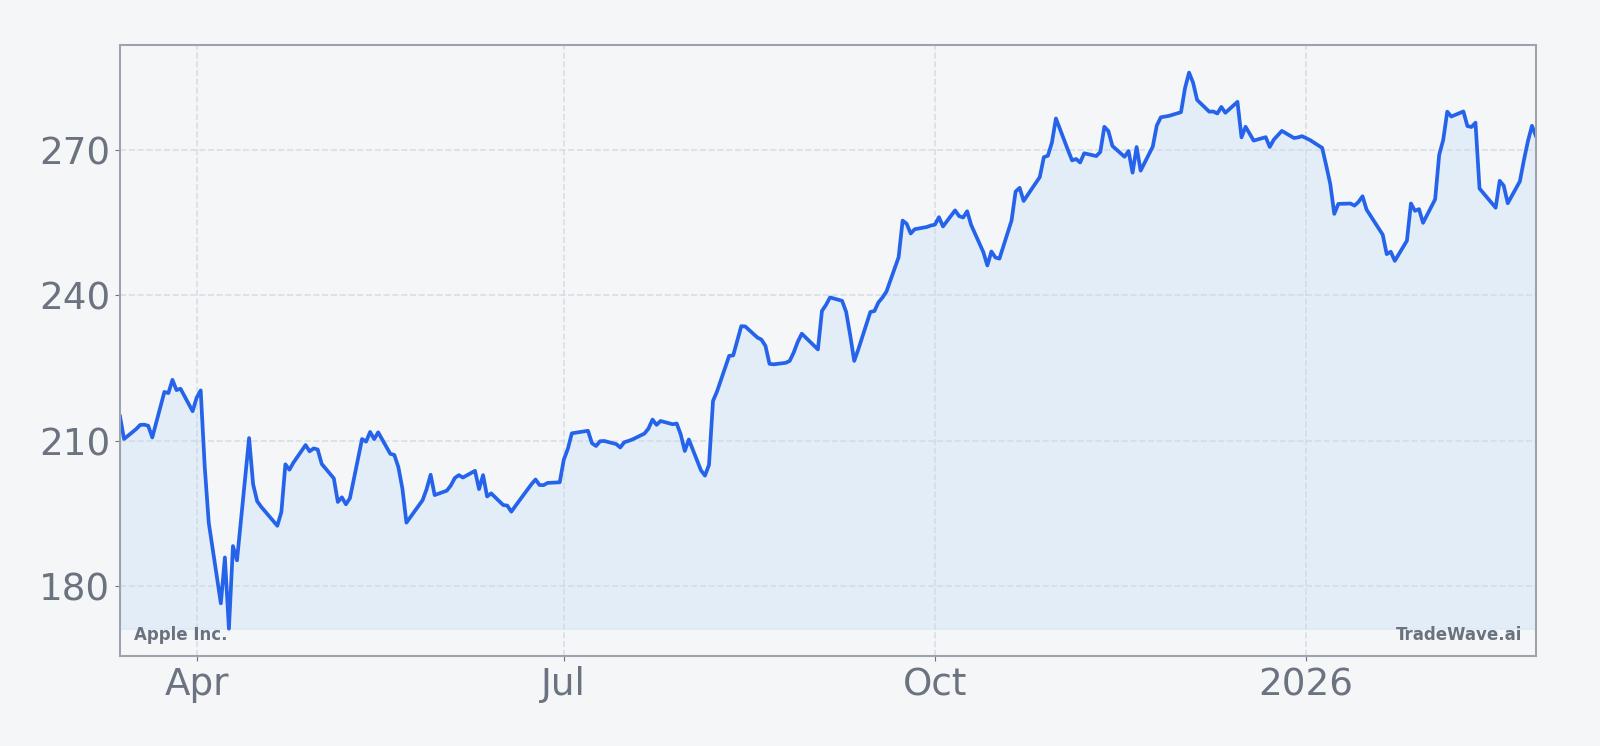
The chart below situates the latest move in its recent multi-month context.
Earnings and guidance in focus
Apple’s next scheduled earnings report is for fiscal Q4 2025 on Oct 30, 2025, which will land inside the upcoming seasonal window and could act as a key checkpoint for how closely the stock tracks its historical pattern.[5] The company has already set the tone with its March-quarter outlook, calling for double-digit revenue growth driven by record iPhone results, which raises the bar for execution as the year progresses.[1]
In the most recent earnings cycle, Apple’s revenue beat and upbeat commentary on iPhone demand and AI ambitions helped shares jump more than 4% in after-hours trading before that move faded in subsequent sessions.[1][10] That kind of post-earnings volatility is a reminder that even in a historically strong seasonal regime, single-day reactions around results can be sharp in both directions.
Analysts following the name expect “good headline numbers” from Apple, with Wedbush and others pointing to iPhone 17 and AI features as catalysts that could support both unit growth and higher average selling prices.[11][13] For investors watching the seasonal window, the key question is whether those product and AI narratives are strong enough to keep earnings revisions moving higher through the heart of the 232-day stretch.
Macro and AI backdrop
Apple’s seasonal window opens against a macro backdrop where AI and technology adoption remain central themes for equity markets. Recent analysis has framed Apple’s AI strategy as a core reason the company is positioned for growth in 2026, with new capabilities expected to deepen ecosystem lock-in and support services revenue.[13]
Within the tech hardware and services space, Apple’s combination of hardware scale and high-margin services has helped it weather macro crosscurrents better than many peers.[2] That resilience matters for the seasonal pattern because it suggests that, in prior years, the company has often been able to convert product cycles and ecosystem strength into sustained share-price gains over multi-quarter stretches.
Valuation and positioning
With Apple trading below its recent highs but still near the upper end of its 52-week range, the stock is not cheap in absolute terms, yet several commentators have argued that free cash flow strength leaves room for upside.[6][14] One analysis in late 2025 suggested Apple shares could be roughly 20% undervalued based on free cash flow, while another outlined a path for the stock to break $300 as AI and services growth compound over time.[6][14]
Wedbush’s $290 price target, paired with its view that the recent sell-off is unwarranted, underscores that at least part of the Street sees the current consolidation as an opportunity rather than a warning sign.[9][13] For traders watching the seasonal window, that backdrop of supportive fundamental narratives and constructive analyst positioning adds another layer to a pattern that has already been skewed toward strong long outcomes.
What to watch as the window opens
As the 232-day seasonal window kicks off on Mar 13, the first thing to watch is how Apple trades around key technical levels, especially the 50-day moving average near $265 and the 52-week high zone around $288.[1] A sustained push back toward or through that high early in the window would be consistent with the historical tendency for strong upside travel, while a deeper slide toward the lower end of the recent range would mark a clear departure from the typical script.
Second, earnings and guidance will be critical checkpoints. The March-quarter results and any updates on AI integration, iPhone demand and services growth will help determine whether the fundamental story can support another year of double-digit gains inside a window that has never produced a loss in the past decade.[1][5][7] Watch how the stock behaves not just on the headline print but in the days and weeks after, since prior years have shown that big intraperiod drawdowns can coexist with strong final outcomes.
Third, keep an eye on how the broader AI and mega-cap tech narrative evolves. If 2026 continues to be framed as Apple’s year of AI, as Wedbush has argued, then positive news on software features, on-device models or ecosystem tie-ins could reinforce the long-biased seasonal backdrop.[13] Conversely, any sign that AI monetization is slipping behind expectations could be the kind of catalyst that tests the pattern’s historical consistency.
Finally, monitor volatility around major news days. The last earnings cycle showed that Apple can swing sharply in after-hours trading before settling into a new range, and the historical maximum adverse excursions inside this window confirm that even winning seasons have required patience.[1][10] For traders and investors alike, the message is straightforward: the calendar has been a powerful tailwind for Apple in this stretch, but the path has rarely been smooth.
Sources
- [1] Seeking Alpha – Apple projects 13%-16% revenue growth for March quarter as iPhone demand drives record results (Jan 30, 2026)
- [2] Reuters – Apple revenue forecast beats estimates as iPhone sales soar (Jul 31, 2025)
- [3] Seeking Alpha – Apple Q3 revenue crushes estimates by nearly $5B, shares edge higher (Jul 31, 2025)
- [5] Business Insider – Apple is reporting earnings today after reaching a historic $4 trillion market cap (Oct 30, 2025)
- [6] Barchart.com – Apple’s Free Cash Flow Surges, Implying AAPL Stock Could Be 20% Too Cheap (Nov 2, 2025)
- [7] Yahoo Finance – Q2 2025 Apple Inc Earnings Call (May 2, 2025)
- [9] MarketWatch – With Apple stock near a record high as earnings loom, here’s the options trade to make (Oct 20, 2025)
- [10] CNBC – Apple gave up its earnings pop. How to trade it from here (Oct 31, 2025)
- [11] Seeking Alpha – Apple expected to report 'good headline numbers' says Wedbush (Jul 30, 2025)
- [12] Morningstar – Apple investigation initiated by former Louisiana Attorney General (Aug 16, 2025)
- [13] Seeking Alpha – Apple sell-off 'unwarranted,' as Wedbush says 2026 is the tech giant's year of AI (Feb 17, 2026)
- [14] Forbes – How Apple Stock Can Break $300 (Dec 5, 2025)