Economic Headwinds Test Microsoft (MSFT) While Its 160-Day Spring Window Stays Perfect
Microsoft is trading well below its 52-week high just as a 160-day spring–summer window that has delivered gains in every year of the past decade comes back into focus.

Key takeaways
- Microsoft’s 160-day window starting Mar 7 has been positive in 10 of 10 years, a 100% win rate for a long bias.
- Average gain across those years is 20.67%, with cumulative returns of 524% over the decade in this specific stretch.
- Intraperiod swings have been meaningful, with several years showing double-digit drawdowns even as the window finished higher.
- Shares closed at $408.96 on Mar 8, about 25.5% below the 52-week high of $549.14, leaving room above if the pattern repeats.
- Recent earnings beat expectations but revived worries about Azure’s slowing growth and heavy AI infrastructure spending.[2][4][6][10]
- Short interest sits at 0.79%, a low but closely watched gauge of sentiment as AI leadership debates intensify.[8]
According to historical data from TradeWave.ai, this particular spring–summer stretch has behaved very differently from an average calendar slice for Microsoft. The next section looks at how that pattern has played out over the past decade and what it means for the current backdrop.
Seasonal window
Microsoft has risen in 10 of 10 years during the 160 trading days starting around Mar 7, averaging gains of 20.67%. The latest iteration of that window began on Mar 7 with the stock at $408.96, about 25.5% below its 52-week high of $549.14, so the pattern is kicking in from well off the top of the range.
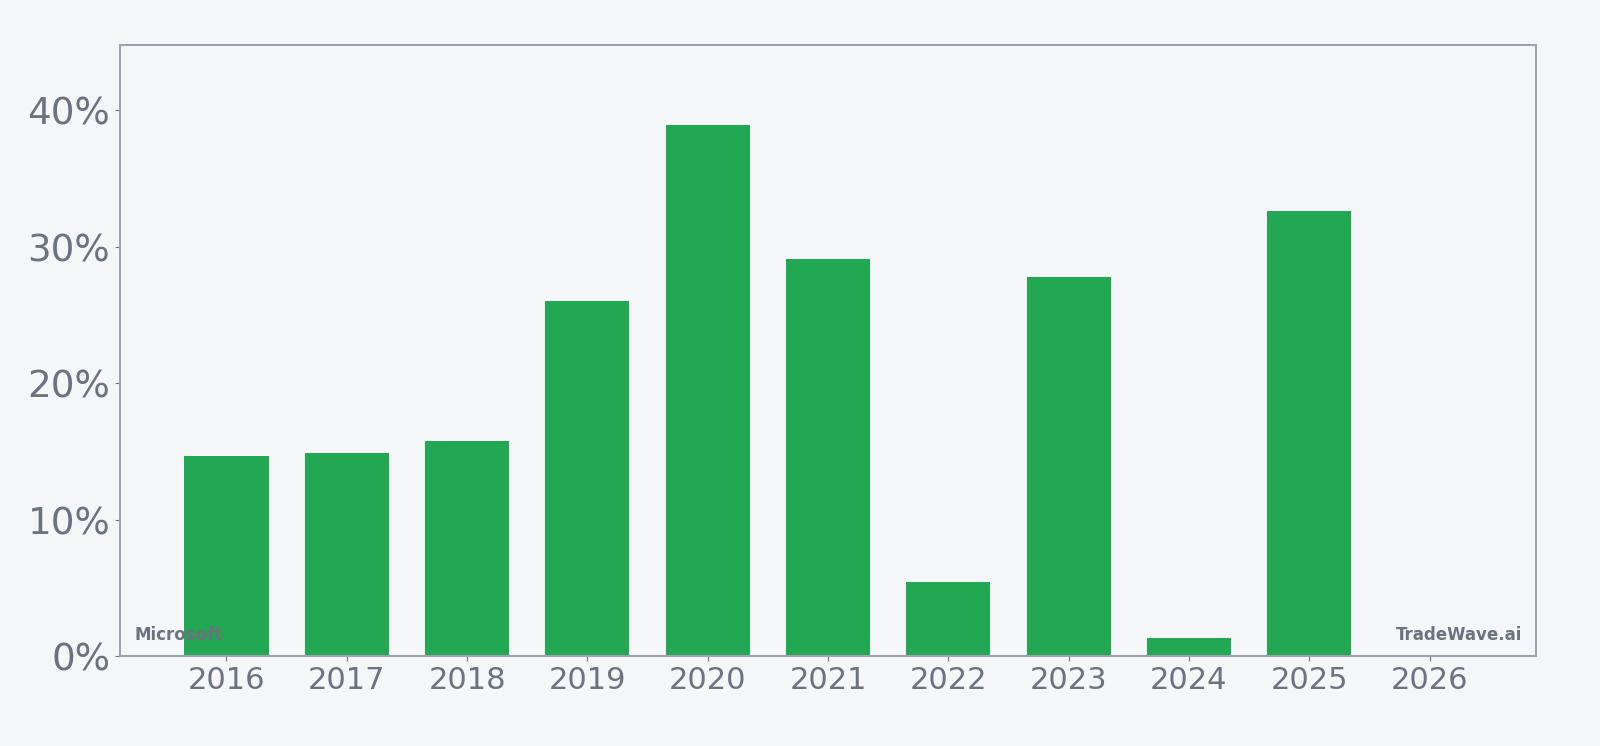
Across the 10-year sample, the long trade direction has aligned cleanly with outcomes: every single window finished higher, with no losing years. Average profit of 20.67% sits close to the 20.9% median, which suggests the gains are not just a couple of outliers but a fairly consistent cluster of strong seasons.
The strongest year in this pattern was 2025, when Microsoft gained 32.6% between entry and exit, after a maximum favorable move of 41.48% and despite a worst intraperiod drawdown of 12.34%. At the other end of the spectrum, 2024 barely cleared the bar with a 1.37% net gain, even though the stock rallied as much as 14.68% at one point and then gave most of it back before the window closed.
Those two bookends show how the maximum favorable excursion and maximum adverse excursion behave in this stretch. In some years, like 2020 and 2023, the stock has pushed 40% to 45% higher at the best point in the window, but that upside has come with double-digit drawdowns along the way. In softer years such as 2022 and 2024, the worst drawdowns of roughly 5% to 13% arrived even though the final result was still positive.
The TradeWave Ratio of 1.94 indicates that, historically, Microsoft has tended to travel almost twice as far in the trade direction inside the window as a typical baseline move for the stock. Combined with a Sharpe ratio of 1.56 based on end-of-window outcomes, the pattern has delivered both strong absolute returns and solid risk-adjusted performance for a long bias, even if the ride has been bumpy in several iterations.
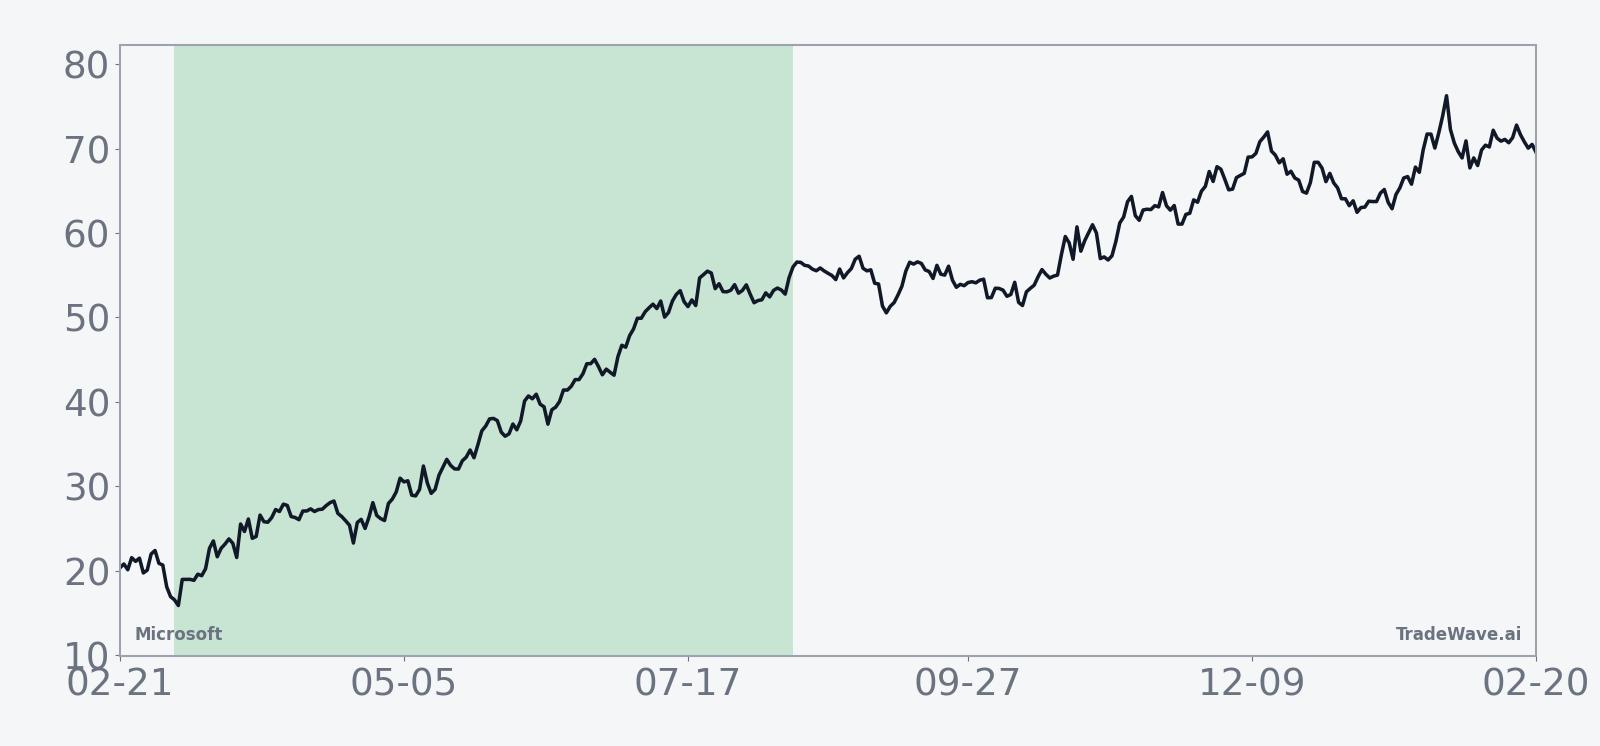
The 10-year average seasonal trend shows gains building in stages rather than in a straight line. The typical pattern features an early push higher, a mid-window consolidation with noticeable giveback, and then a second leg of strength into the final third of the period, which has often locked in the bulk of the net return.
A second view of yearly net, best run-up and worst drawdown highlights how much room the stock has historically had to move inside the window.
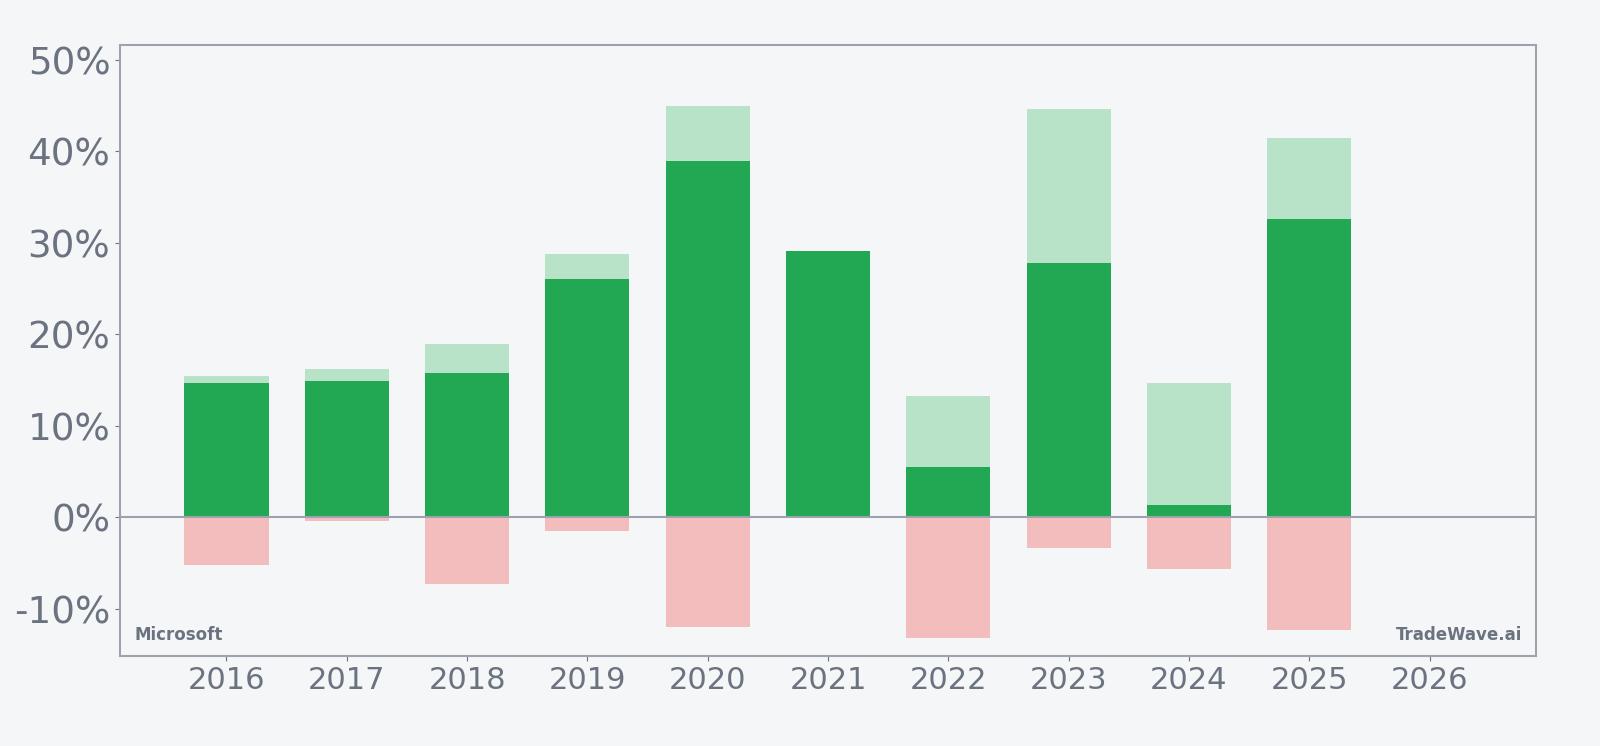
Viewed through that lens, the pattern is striking: 10 winners, no losers, and multiple years where the best intraperiod rally topped 25% while the worst drawdown stayed in the single digits. Add it up: 524% cumulative gains across these ten spring–summer windows, with enough volatility inside each one to matter for traders who care about path, not just destination.
History does not guarantee future results, and even in this strong window the worst intraperiod drawdowns have reached double digits in some years.
Price and near-term drivers
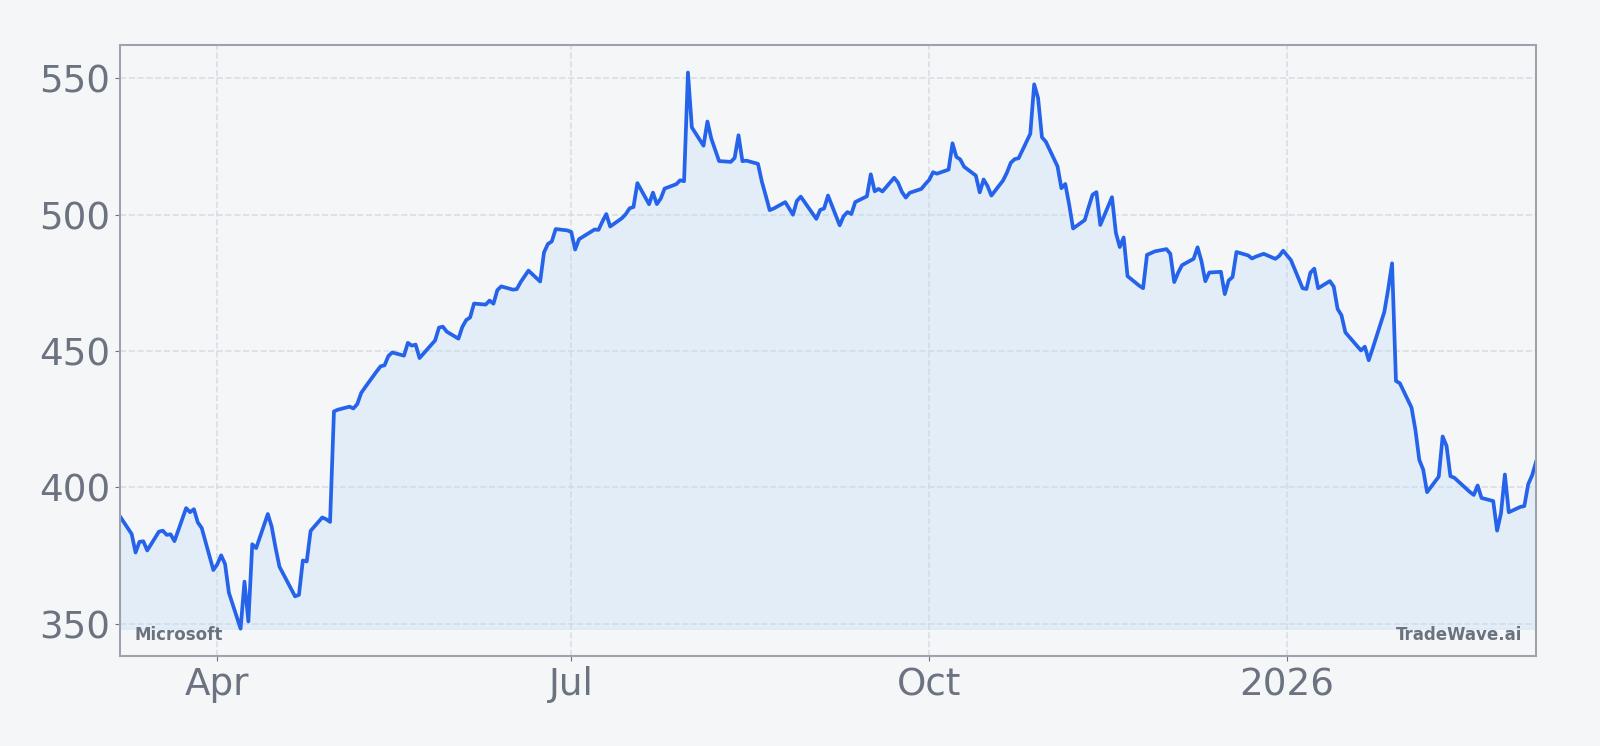
Microsoft closed Friday at $408.96, down 0.4% on the day, leaving the stock about 25.5% below its 52-week high of $549.14 and roughly 20.4% above its 52-week low of $339.57. The move came on volume of just over 30.8 million shares, lighter than the 20-day average of about 38.1 million, as investors continued to digest the latest earnings and AI headlines.
On Jan 28, Microsoft’s fiscal second-quarter results topped Wall Street estimates, with revenue up 17% year over year and adjusted earnings per share of $4.14, but the stock slipped after hours as investors focused on Azure’s 39% growth rate and the perception of a slowdown from prior quarters.[2][6] The following day, analysis highlighted a surge in commercial remaining performance obligations to $625 billion, underscoring how much AI-related demand is already locked into the backlog even as near-term cloud growth moderates.[4]
That tension has defined the stock’s recent trading range. In late February and early March, commentary pointed to heavy AI data center spending and potential margin pressure as key risks, even as Microsoft’s scale and profitability were cited as reasons it could still justify a premium valuation.[8][10] A separate analysis framed the stock as needing to “defy market headwinds,” with AI and cloud growth expected to remain the main drivers of upside if execution holds.[10]
Short interest around 0.79% keeps the positioning picture relatively calm, but it also leaves little cushion if sentiment turns more cautious around AI leadership or cloud growth.[8] In February, one detailed critique argued that Microsoft’s AI strategy and Copilot traction were not as dominant as the market narrative suggested, raising the risk that expectations embedded in the stock could be ahead of reality.[8]
The chart below situates the latest move in its recent multi-month context.
Earnings and AI narrative
Looking ahead, Microsoft’s next scheduled earnings event is its fiscal second-quarter 2026 report on Jan 28, 2026, which will again put Azure growth and AI monetization under the microscope.[2] For now, management has guided to continued strength in cloud and AI, while acknowledging that infrastructure build-out and higher operating costs could weigh on margins in the near term.[10]
In Jan 2026, several outlets framed the latest quarter as a classic “good numbers, tough reaction” setup: revenue and earnings beat, but the market zeroed in on the deceleration in Azure and the sheer scale of capital spending required to stay ahead in AI.[2][4][6] That dynamic matters for the seasonal window because the historical pattern has often overlapped with periods when investors reassess growth versus profitability in mega-cap tech, amplifying both rallies and pullbacks inside the range.
Back in Jul 2025, Microsoft’s earnings beat and a push through the $4 trillion market-cap mark reinforced the idea that the company sits at the center of the AI and cloud trade, even if that milestone came in a different price regime.[3] Later that summer, valuation-focused pieces debated whether buying the stock around $500 still made sense, arguing that strong growth and profitability could justify the premium if AI adoption stayed on track.[5]
Macro and sector backdrop
At the macro level, Microsoft remains one of the cleanest ways to express the “AI revolution” theme, with cloud and AI workloads driving a large share of incremental demand.[1] That tailwind has to be weighed against concerns about a broader economic slowdown and the possibility that enterprise customers could moderate cloud spending if budgets tighten, a risk that has already crept into commentary around Azure’s latest growth step-down.[2]
Within the sector, Azure’s 39% growth still looks strong on an absolute basis, but competition in cloud computing is intense and investors are watching for any sign that Microsoft is ceding ground.[2] At the same time, heavy investment in AI infrastructure and data centers is a double-edged sword: it supports long-term positioning in AI, but it also pressures margins and free cash flow in the near term, a trade-off that recent analysis has flagged as a key risk for the stock.[10]
Valuation and Street stance
Wall Street remains broadly constructive. Wedbush and other analysts have reiterated Buy ratings with a consensus price target around $600, implying substantial upside from current levels, though some of those targets were set when the stock traded closer to $500 and before the latest pullback.[1][11] The bullish case leans on Microsoft’s scale in cloud, its early lead in AI tooling, and the visibility provided by a swelling commercial backlog.[1][4][11]
On the other side of the ledger, more cautious voices have focused on the risk that AI investments and margin compression could cap near-term returns, especially if growth expectations remain aggressive.[8][10] That debate is unfolding just as the historically strong seasonal window gets underway, which could either reinforce the bull case if the stock grinds higher or magnify disappointment if fundamentals or sentiment slip.
What to watch in this window
For traders tracking this 160-day stretch, three things stand out. First, watch how Microsoft behaves around key resistance zones that line up with the 50-day moving average near $436 and, further up, the mid-$400s band where prior rallies have stalled. A sustained move back toward that zone during the window would be consistent with the historical pattern of strong spring–summer performance.
Second, earnings and AI commentary will remain the main catalysts. Any update that shifts the narrative on Azure growth, Copilot adoption or AI infrastructure spending could quickly change how investors treat this seasonal tailwind, especially given the history of sizable intraperiod drawdowns even in winning years.[2][4][6][8][10]
Third, keep an eye on positioning and sentiment. Short interest is low at 0.79%, but if skepticism around Microsoft’s AI leadership or margin profile builds, that figure could start to climb, signaling a more crowded bear case just as the seasonal window has historically favored the long side.[8] If, instead, short interest stays muted and flows remain supportive, it would fit the pattern of prior years where pullbacks inside the window ultimately resolved higher.
In short, the record is clear: 10 for 10 in this window over the past decade, with big swings along the way. How Microsoft trades against that backdrop in the coming months will tell investors whether this spring–summer stretch remains one of the stock’s most reliable calendar edges or finally breaks the streak.
Sources
- [1] Seeking Alpha, "Microsoft keeps Outperform rating as Wedbush sees 'robust' Q4 results" (Jul 25, 2025)
- [2] Seeking Alpha, "Microsoft stumbles even as Q2 results top estimates" (Jan 28, 2026)
- [3] Business Insider, "Microsoft Stock Surges After It Posts Another Earnings Beat" (Jul 30, 2025)
- [4] The Motley Fool, "Is It Time to Buy Microsoft Stock as Its Backlog Soars?" (Jan 30, 2026)
- [5] Forbes, "Buy MSFT Stock At $500?" (Aug 27, 2025)
- [6] Barron's, "Microsoft Stock Falls Despite Earnings Beat. Cloud Growth Slowed Slightly." (Jan 28, 2026)
- [7] CNBC, "Stocks making the biggest moves after hours: Microsoft and more" (Oct 29, 2025)
- [8] Seeking Alpha, "Microsoft's Lack Of Leadership In AI, Wait" (Feb 16, 2026)
- [10] Forbes, "Can Microsoft Stock Defy Market Headwinds?" (Mar 4, 2026)
- [11] Seeking Alpha, "Analysts see upside in Microsoft stock" (referenced within Jul 25, 2025 coverage)