AI Revolution and Azure Growth Power Microsoft (MSFT) Outlook Despite Recent Share Pullback
Microsoft has entered an 11-day midterm-election-year pattern that has often leaned lower, just as the stock trades about 11.7% below its 52-week high and investors debate how much AI-driven growth is already priced in.

Key takeaways
- Microsoft has entered an 11-day seasonal window tied to the last 9 midterm election years, where the historical trade direction has been short.
- The pattern has been profitable 67% of the time, with 6 winners and 3 losers across the sample.
- Average profit in winning years is 4.54%, while the all-years average, including losing seasons, is 2%.
- Historical maximum favorable and adverse moves inside the window show that intraperiod swings can be sharp in both directions.
- The TradeWave Ratio of 1.34 and a Sharpe ratio of 0.39 point to a modest but persistent edge for the short setup, with meaningful volatility.
- This window arrives as Microsoft trades about 11.7% below its 52-week high and faces scrutiny over valuation and AI-driven expectations.[5][10]
According to historical data from TradeWave.ai, this part of the calendar has shown a distinct pattern for Microsoft in past midterm election years, and the next section looks at how that backdrop compares with today’s setup.
Seasonal window
This seasonal window is currently underway, spanning 11 days, and has historically been a weak stretch for Microsoft during midterm election years. Today the stock trades at $478.51, about 11.7% below its 52-week high of $542.07 and well above its 52-week low of $214.25, leaving it elevated on a multi-year view even after recent consolidation.[5][10]
Because this pattern is grouped by the presidential election cycle, it focuses specifically on how Microsoft has behaved in the last 9 midterm election years rather than across all calendar years. That matters in early 2026 because markets are entering another midterm election year, a phase that has often featured policy uncertainty, shifting expectations for regulation and taxation, and more uneven risk appetite compared with the pre-election year that follows.
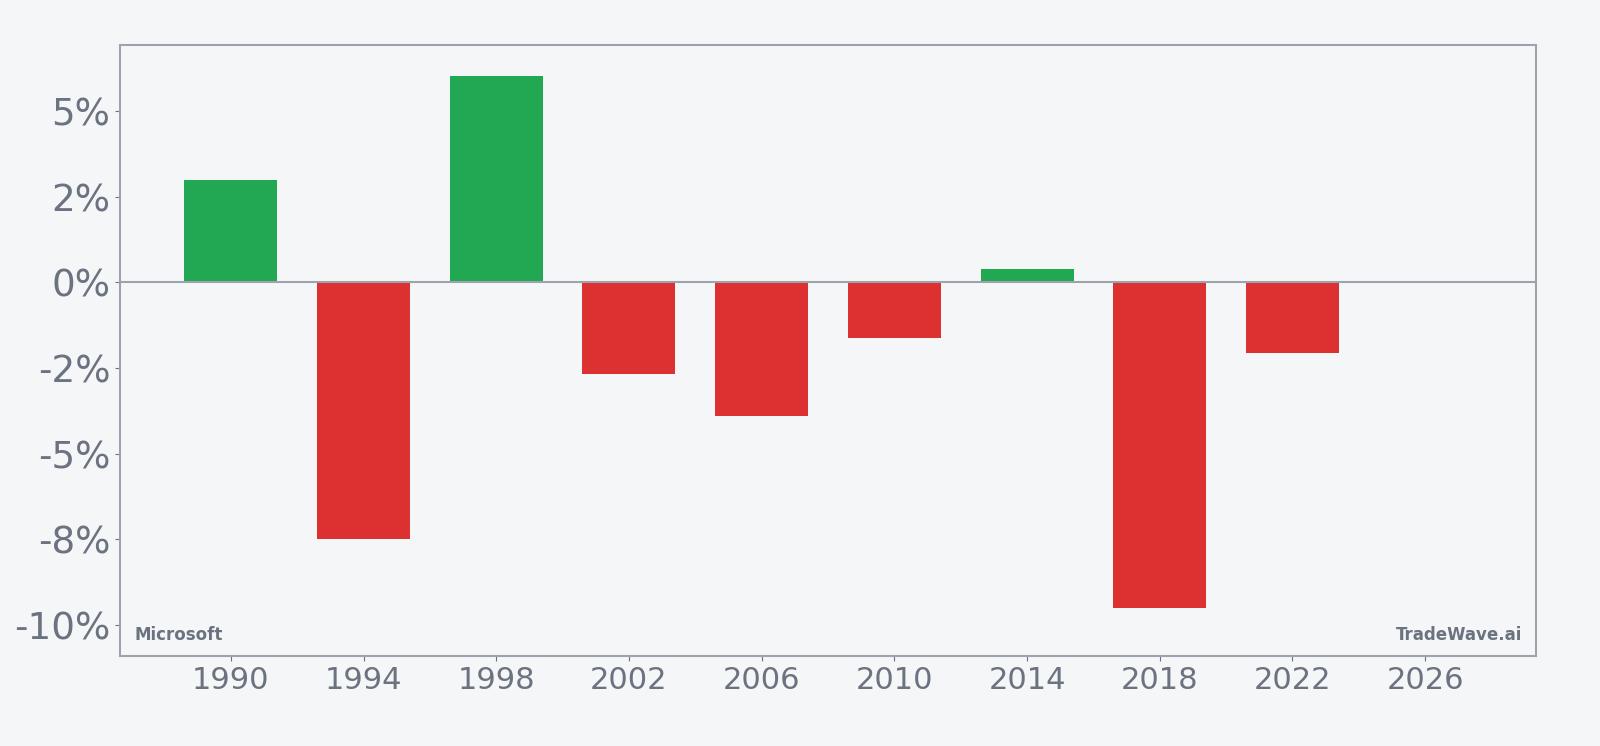
The historical trade direction for this window is short, meaning that in prior midterm election years Microsoft has more often moved lower than higher over these 11 days. The pattern has been profitable 67% of the time, with 6 winning years and 3 losing years, so the bias is clear but not overwhelming. Average profit in the winning years is 4.54%, while the average across all years, including the losing ones, is 2%, which reflects the drag from several sizable upside squeezes against the short setup.
The per-year breakdown shows how uneven the path can be. In 1998, for example, Microsoft rallied 6.03% over the window, which would have been a losing outcome for a short position, while in 2018 the stock fell 9.49%, aligning strongly with the short direction. The mix of outcomes underscores that even within a midterm-year framework, company-specific and macro news can dominate the tape in any single year.
Intraperiod swings have also been meaningful. The maximum favorable move, or best point-to-peak excursion in the trade direction, has at times been large, indicating that when the short pattern works it can do so quickly. At the same time, the maximum adverse move, or worst drawdown from entry, has also been significant in several years, highlighting the risk of sharp rallies that run counter to the historical tendency before any eventual reversal.
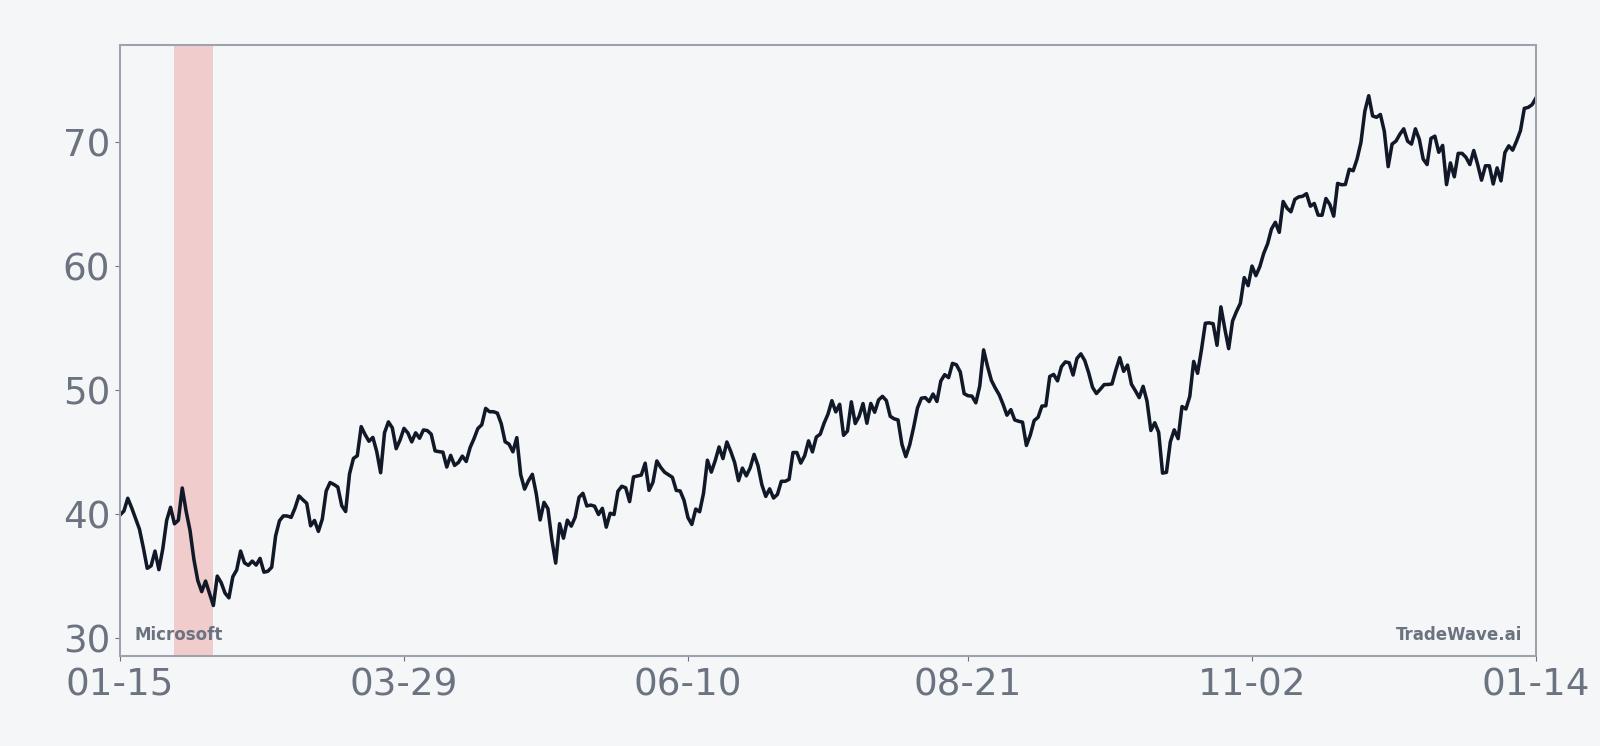
The historical seasonal trend chart suggests that, on average, Microsoft has tended to soften rather than surge during this stretch, with the typical path showing pressure building through the middle of the window before stabilizing. The cumulative return profile is consistent with a modest but persistent downward bias rather than a one-day shock, which fits with the idea of a short setup that often develops over several sessions.
Year-by-year net returns and intraperiod swings help clarify how much room the stock has historically had to move in both directions during this window.
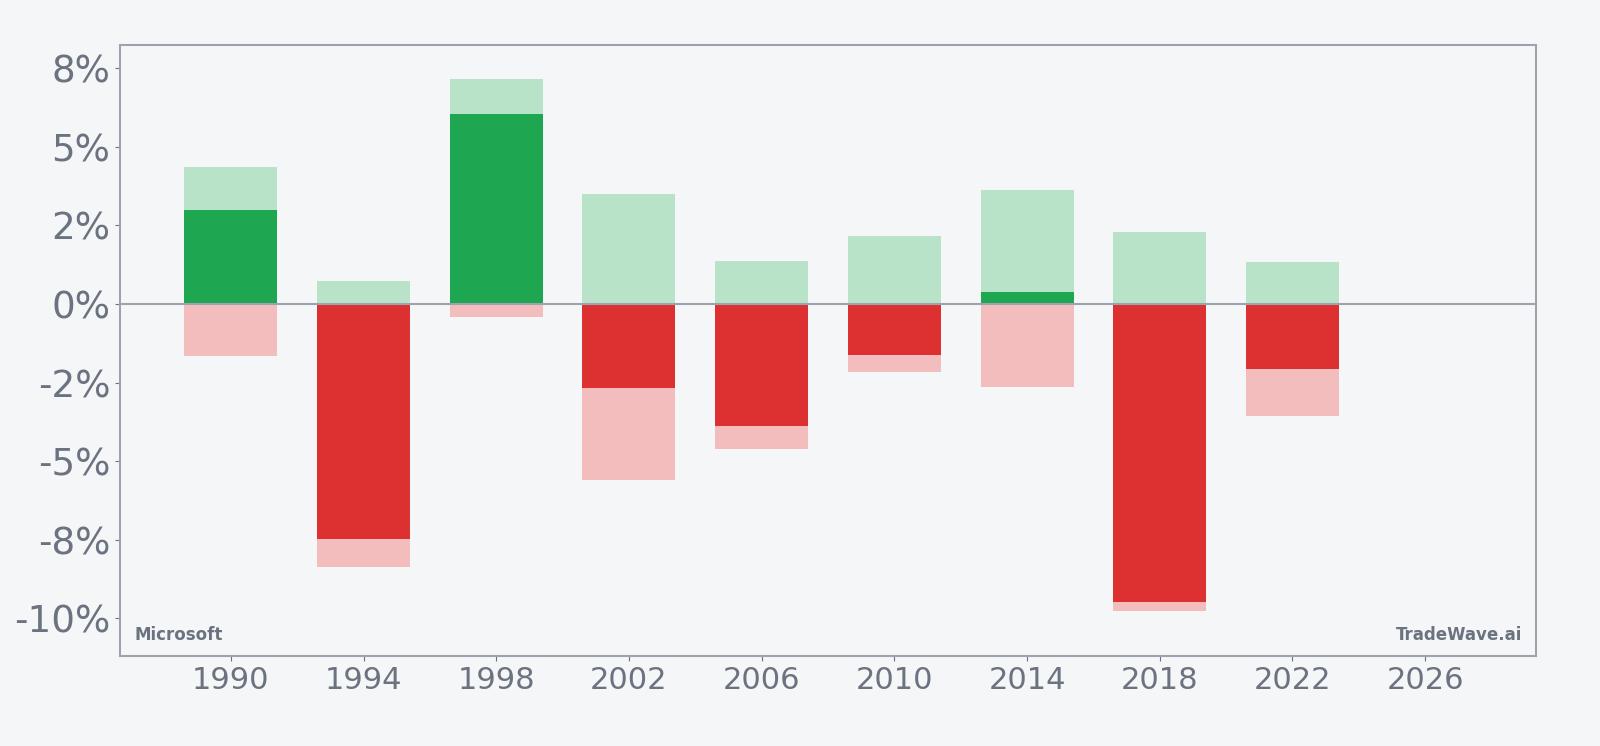
The combined net, maximum favorable, and maximum adverse excursion bars show that even in years where the final outcome aligned with the short direction, Microsoft often experienced sizable countertrend rallies inside the window, while some losing years for the short setup saw strong upside spikes with relatively contained downside. That mix of large positive and negative excursions, alongside a TradeWave Ratio of 1.34 and a Sharpe ratio of 0.39, points to a pattern where the edge for shorts has existed but has come with meaningful volatility.
History does not guarantee future results; adverse excursions (MAE) can be large even in winning windows.
Price and near-term drivers
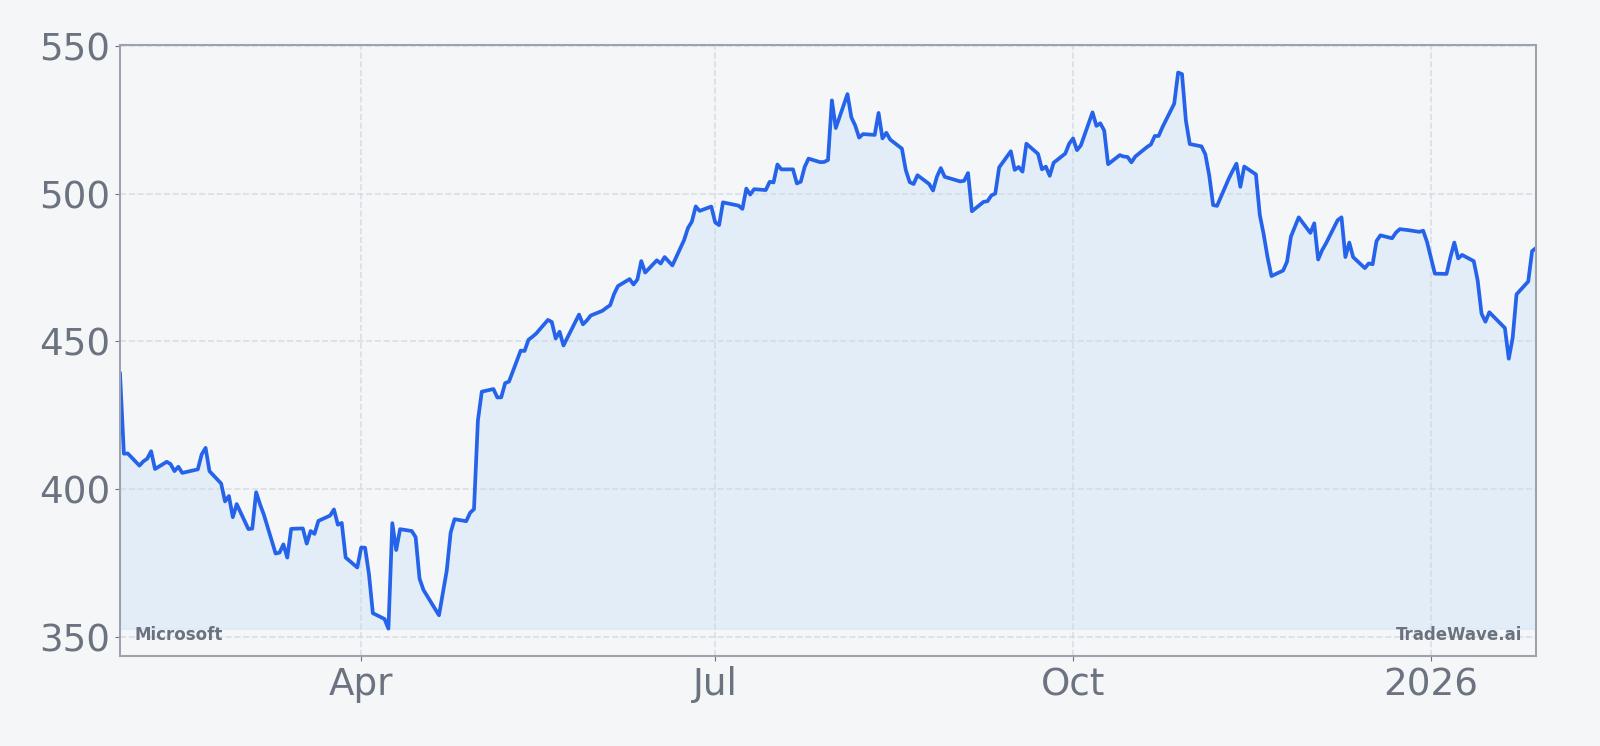
Microsoft’s $478.51 share price leaves it about 11.7% below its 52-week high of $542.07, but still far above its 52-week low of $214.25, reflecting a stock that has already rerated higher on the back of cloud and AI optimism.[5][10] In January 2026, analysts at Barron’s highlighted that the stock had recently pulled back to a seven-month low even as Wall Street remained broadly constructive on the long-term AI and Copilot story, underscoring the tension between strong fundamentals and valuation concerns.[10]
Valuation has been a central part of that debate. In a Jan 7, 2026 analysis, Forbes examined whether Microsoft shares had become expensive after a multi-year run, pointing to elevated multiples relative to historical norms and the need for continued robust earnings growth to justify the premium.[5] That discussion follows a series of earnings beats through 2025, when Microsoft consistently topped revenue and earnings expectations on the strength of Azure and AI-related demand, even as guidance occasionally came in more cautious than investors had hoped.[2][3][6]
In July 2025, Business Insider reported that Microsoft’s stock surged after another quarterly earnings beat, with cloud and AI once again the main drivers of upside versus estimates.[3] Earlier that year, Forbes noted that the company’s Q2 FY2025 results exceeded expectations but that a softer outlook weighed on the shares, illustrating how quickly sentiment can swing when expectations are high.[2] CNBC coverage in October 2025 similarly flagged Microsoft among the large-cap tech names making notable after-hours moves around earnings, reinforcing its role as a bellwether for both the Dow and broader tech sector.[6][13]
Analyst views have generally remained supportive. In July 2025, Seeking Alpha reported that Wedbush kept an Outperform rating on Microsoft and pointed to “robust” results, with a consensus price target around $600 that implied further upside from then-current levels.[1] That bullish stance has been echoed in other commentary that frames Microsoft as a core beneficiary of the AI revolution, with cloud infrastructure, productivity software and developer tools all positioned to capture incremental spending.[1][11]
The chart below situates the latest move in its recent multi-month context.
Macro and election-cycle backdrop
The broader macro story around Microsoft remains tightly linked to the AI and cloud spending cycle. Analyst commentary through 2025 emphasized that AI adoption across industries and continued growth in Azure have been central to the company’s performance, with enterprises investing in infrastructure and software to support new workloads.[1][3] Sector-focused analysis has highlighted Azure’s roughly mid-30% revenue growth as a key pillar, helping offset slower segments and reinforcing Microsoft’s status as a core platform provider.[3]
Within the presidential election cycle, early midterm election years have often been more volatile for large-cap tech than the pre-election years that follow. Policy debates around regulation, antitrust, data privacy and taxation can weigh on sentiment, even when company fundamentals remain strong. For a systemically important name like Microsoft, that means periods of policy uncertainty can translate into sharper swings in index-level performance, particularly when valuations are already rich and expectations for AI-driven growth are high.
Looking ahead from this 11-day window, the historical pattern suggests that midterm election years can be a “two-playbook” environment: a choppier, risk-heavy start followed by a stronger stretch as markets transition into the pre-election year. For Microsoft, that context frames the current seasonal weakness as part of a broader cycle in which early-year volatility has not necessarily derailed longer-term uptrends but has often introduced pockets of downside risk that matter for positioning and risk management.
What to watch
For this 11-day midterm-year window, the key question is whether Microsoft’s price action respects the historical tendency toward weakness or instead resembles one of the years where short setups struggled. Traders and investors will be watching how the stock behaves around the $478.51 area and whether it gravitates toward prior support zones or attempts to retest the upper end of its recent range.[5][10]
On the macro side, any shifts in expectations for regulation of large technology platforms, changes in the interest-rate outlook, or updates on enterprise AI spending could all influence how closely this year tracks the historical pattern. Stronger-than-expected commentary on cloud and AI demand, or signs that corporate IT budgets are holding up better than feared, could blunt the typical midterm-year softness, while renewed concerns about valuation or policy risk could reinforce it.[1][3][5]
Because Microsoft is a major weight in key equity indices, volatility during this window can have outsized effects on broader benchmarks, particularly if moves are driven by AI or cloud headlines that spill over into peers. Investors will be looking for whether any downside pressure remains contained within the historical intraperiod ranges suggested by past maximum adverse moves, or whether a break beyond those norms signals a more significant shift in sentiment.
Finally, as the calendar progresses deeper into the midterm election year and eventually toward the pre-election year, the way Microsoft trades through this early-seasonal window may offer clues about how investors are balancing AI optimism against policy and valuation risks. A pattern that aligns with historical weakness would fit the traditional midterm-year script, while a decisive divergence could indicate that the current AI and cloud cycle is reshaping the usual election-year playbook for one of the market’s most important stocks.
Sources
- [1] Seeking Alpha, "Microsoft keeps Outperform rating as Wedbush sees 'robust' Q4 results" (Jul 25, 2025)
- [2] Forbes, "What's Happening With MSFT Stock?" (Jan 30, 2025)
- [3] Business Insider, "Microsoft Stock Surges After It Posts Another Earnings Beat" (Jul 30, 2025)
- [4] Forbes, "Buy MSFT Stock At $500?" (Aug 27, 2025)
- [5] Forbes, "Is Microsoft Stock Expensive?" (Jan 7, 2026)
- [6] CNBC, "Stocks making the biggest moves after hours: Alphabet, Meta, Starbucks, Microsoft and more" (Oct 29, 2025)
- [7] Yahoo Finance, "Investing in the Future: American Water Speaks on Workforce and Water Quality at 2025 NARUC Summer Summit" (Jul 31, 2025)
- [8] Barchart.com, "Intel Stock Pops on Estimate-Beating Q3. Options Data Tells Us INTC Could Be Headed Here Next." (Oct 24, 2025)
- [9] Bloomberg, "Microsoft’s (MSFT) Fading AI Mojo Keeps Shares in Lengthy Purgatory" (Mar 4, 2025)
- [10] Barron's, "Microsoft Stock Hits a 7-Month Low. Why Wall Street Analysts Are Backing a Recovery." (Jan 14, 2026)
- [11] Yahoo Finance, "Nvidia, Snowflake, Nebius and CoreWeave Surges as AI Deal Sparks Rally" (Sep 9, 2025)
- [12] Barchart.com, "Supermicro’s Earnings Selloff Explained: Should You Buy SMCI Stock Now?" (Aug 6, 2025)
- [13] CNBC, "The setup on earnings beyond tech" (Oct 29, 2025)
- [14] Barchart.com, "Dear Nvidia Stock Fans, Mark Your Calendars For April 2" (Mar 27, 2025)