Boeing (BA) Gets Consensus ‘Buy’ as Market Weighs Tariffs, Delays and Post-Earnings Rally
Boeing has entered a 21-day midterm-election-year pattern that has been consistently positive in past cycles, just as the stock pulls back from a post-earnings run and investors reassess the aerospace recovery and policy backdrop.
Key takeaways
- Boeing is in a 21-day seasonal window tied to the last 10 midterm election years, starting Jan 29.
- The pattern has a long trade direction and has been profitable in 100% of those years, with 10 winners and 0 losers.
- Average profit across the sample is 6.12%, with a median gain of 5.38%, pointing to a historically constructive bias.
- Historical best-case intraperiod rallies have been sizable, but adverse moves within the window have at times been sharp, underscoring volatility risk.
- The setup arrives as Boeing shares are up about 16% year to date following a swing to profit in Q4 2025 and a pullback of 3.1% in the latest session.[1][4][5]
- Regulatory scrutiny, certification delays and tariff policy remain key macro and political variables that could shape how this midterm-year pattern plays out.[5][10][13]
According to historical data from TradeWave.ai, this part of the calendar has shown a distinct seasonal tendency for Boeing in prior midterm election years, and the next few weeks provide a fresh test of that pattern.
Seasonal window
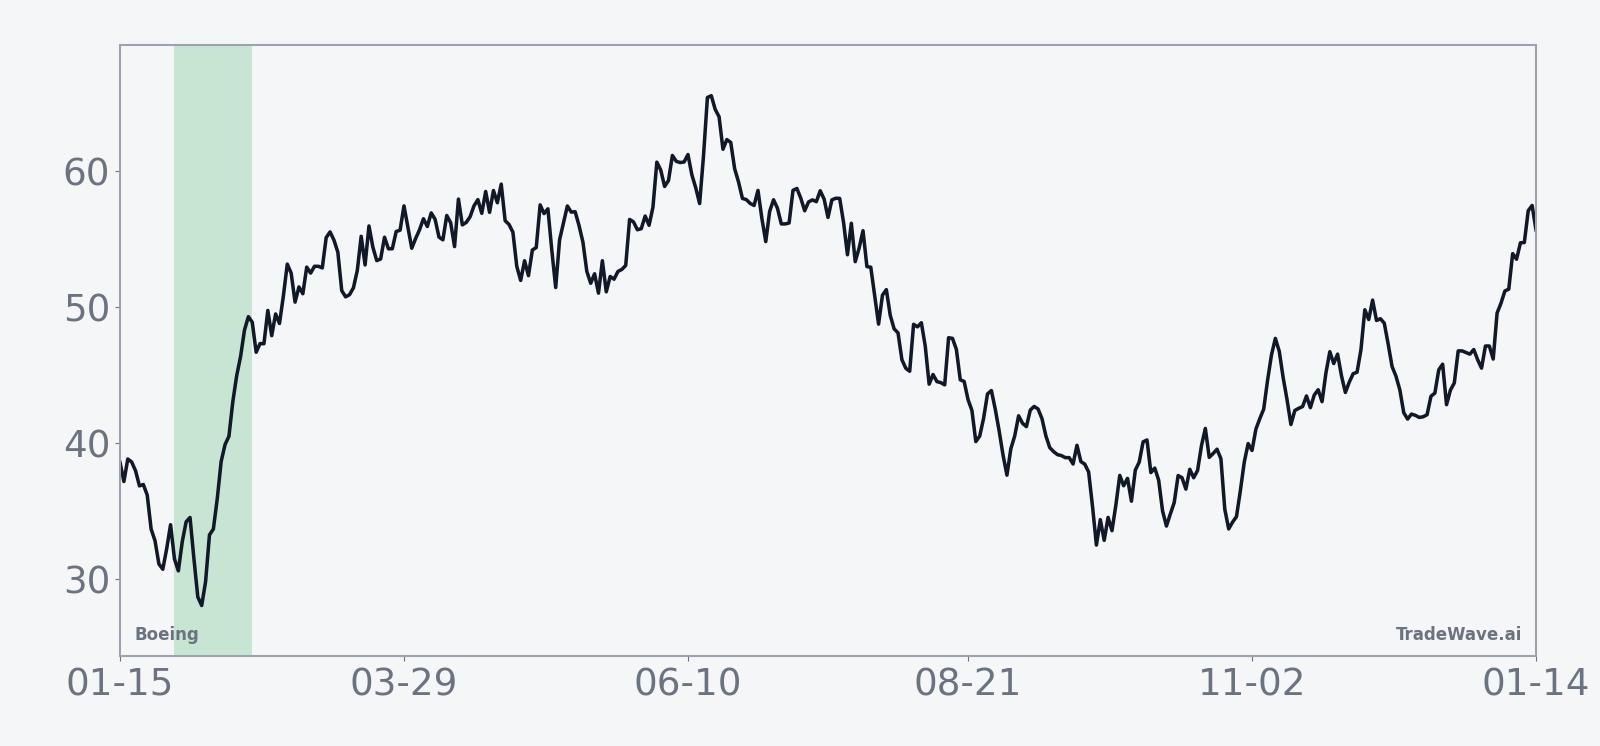
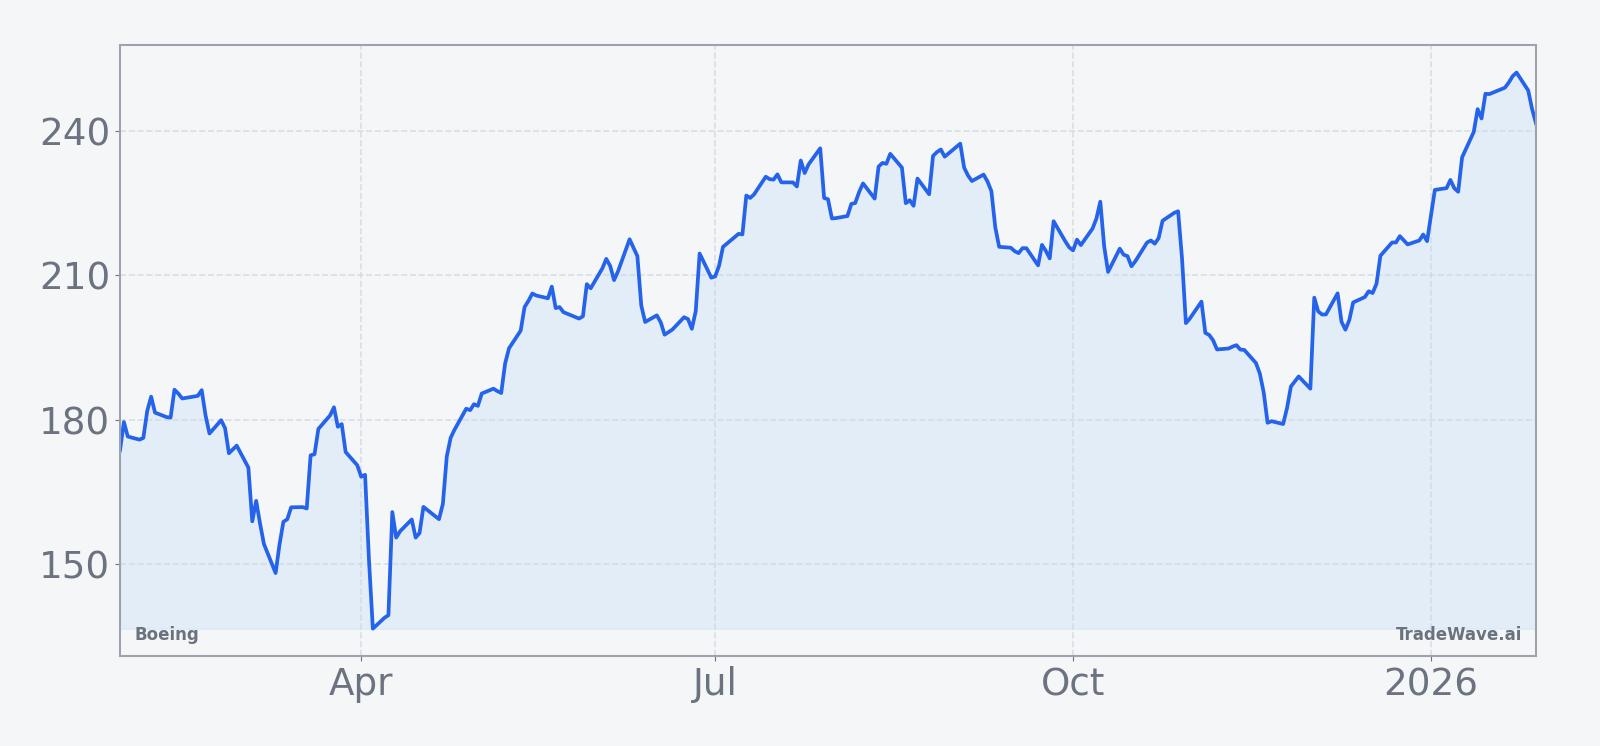
This seasonal window is currently underway, spanning 21 days from Jan 29, 2026, and has historically been a strong stretch for Boeing in midterm election years. Today the stock closed at $234.04, down 3.1% on the session, yet it remains up about 16% for 2026 after a post-earnings rally earlier in the week.[1][4][5]
Because this analysis groups only the last 10 midterm election years, it isolates how Boeing has tended to behave at this point in the presidential cycle, when policy debates often shift from early-term agenda setting toward positioning for the following pre-election year. For an aerospace and defense bellwether that sits at the intersection of trade policy, tariffs and industrial investment, that cycle-specific lens can matter as much as the broader market backdrop.[5][11][13]
Historically, this midterm-year window has aligned with a long trade direction for Boeing, with gains in every one of the 10 years in the sample. Percent Profitable stands at 100%, with 10 winners and 0 losers, and the average profit across those years is 6.12%, while the median gain is 5.38%. That consistency suggests a clear positive seasonal bias, even though the magnitude of returns has varied from a modest 1.22% advance in 2014 to a double-digit 10.48% rise in 1994.
Average profit figures only tell part of the story. In the strongest years, such as 1994 and 2002, Boeing’s net return over the 21-day span exceeded 9%, while even the softer outcomes, like 2014’s 1.22% gain, still finished in positive territory. The cumulative return across all 10 midterm-year instances is 80%, and the annualized return for this pattern is 6.08%, paired with a Sharpe ratio of 2.0 that reflects historically favorable risk-adjusted performance for this specific window.
Intraperiod swings have been meaningful. The maximum favorable move, or best point-to-peak rally within the window, has ranged from 1.48% in 2014 to 13.38% in 1994, underscoring that in strong years the stock has often accelerated higher once the pattern gets going. At the same time, the maximum adverse move, which captures the worst drawdown from the entry point during the window, has at times been sizable, reaching as deep as an 8.48% drop in 2014 and a 6.87% decline in 2018 before those years ultimately finished higher.
The per-year table shows that some of the more volatile episodes combined large rallies with notable setbacks. In 2018, for example, Boeing’s best intraperiod run-up was 6.05%, but the stock also experienced a 6.87% drawdown at one point before closing the window with a 4.19% gain. In 2010, the pattern delivered a 4.49% net return, yet the worst intraperiod decline reached 5.07%, illustrating that even winning years have not been smooth.
Trend metrics within the pattern point to a generally constructive shape. The long-trend reading of 70 versus 30 on the short side, and an even stronger 90 versus 0 balance over the shorter horizon, indicate that in prior midterm election years the stock has tended to build gains rather than fade them as the 21 days progress. The average cumulative return curve for the window slopes upward, suggesting that strength has often accrued over the full period rather than being confined to a single burst.
Viewed through the lens of the TradeWave Ratio, which measures how far price typically travels in the trade direction within the window regardless of the final close, Boeing’s value of 2.08 highlights that historical moves in this stretch have not only been positive on average but have also featured meaningful directional travel. Combined with a standard deviation of 2.94%, the data describe a window where upside has tended to dominate, yet volatility has remained a defining feature.
Taken together, the historical pattern defines the quantitative seasonal backdrop for the current period.
A combined view of net returns and intraperiod swings shows how rallies and drawdowns have coexisted in this window.
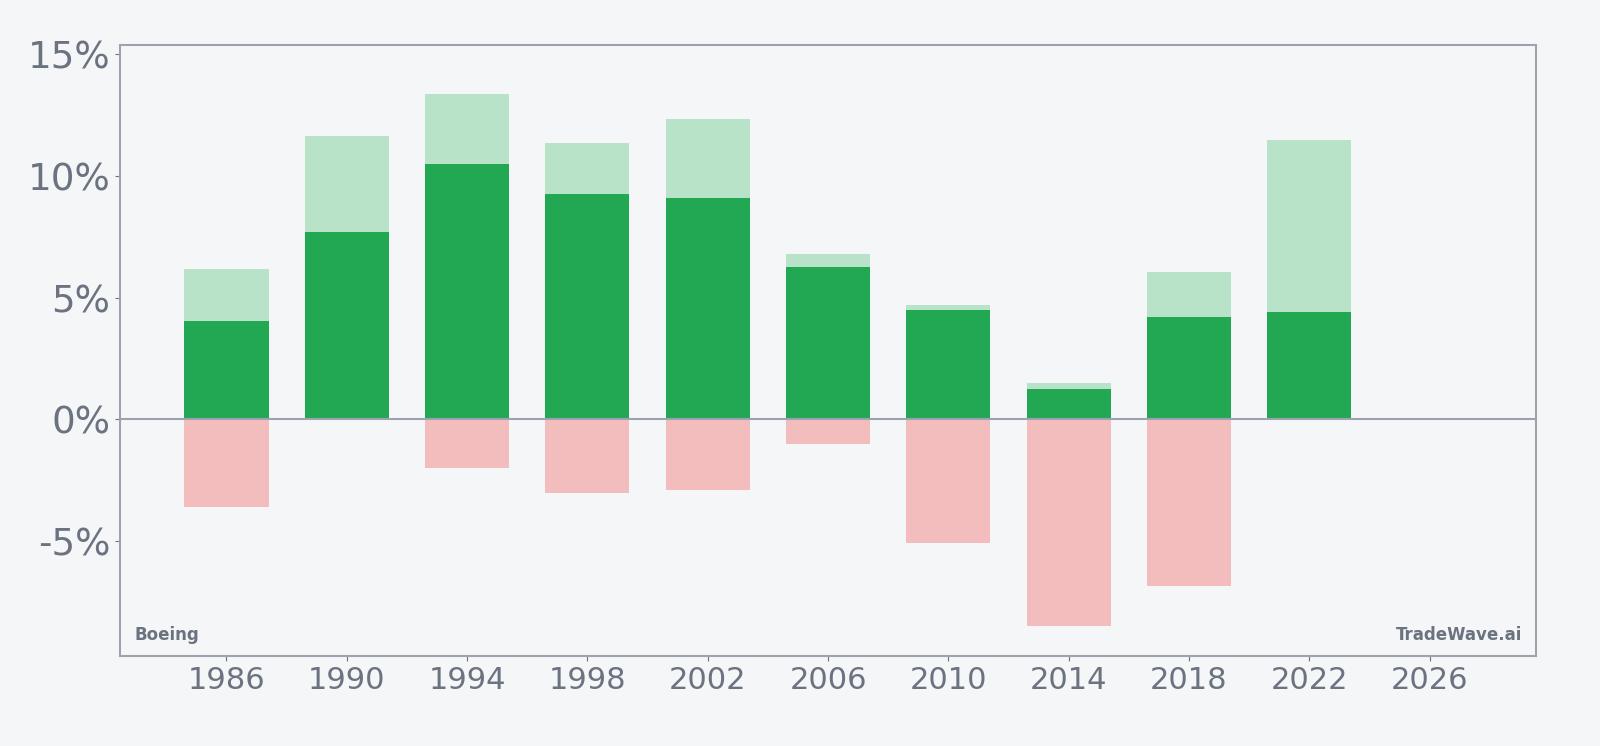
History does not guarantee future results, and adverse excursions within the window can be large even in years that ultimately finish higher.
Price and near-term drivers
Boeing shares fell 3.1% to $234.04 on Jan 29, giving back part of a strong start to the year that has left the stock up about 16% in 2026 following a swing to profit in the fourth quarter of 2025.[1][4][5] The pullback comes after investors initially cheered the company’s better-than-expected results and signs of operational progress, then reassessed how much of the turnaround story is already reflected in the price.[1][4][5][13]
The latest earnings report marked a notable milestone in Boeing’s recovery narrative. In coverage ahead of the release, analysts highlighted the market’s focus on whether the company could translate higher jet deliveries into sustained profitability, following earlier quarters that still showed core losses even as performance improved.[1][5][13] By the time results were in, commentary from major outlets pointed to a swing to profit in the fourth quarter and a shrinking quarterly loss earlier in 2025 as evidence that the operational reset is gaining traction, even if investors remain sensitive to execution risk.[1][4][5][13]
At the same time, the regulatory and legal overhang has not disappeared. In June 2025, a high-profile National Transportation Safety Board hearing into the 737 MAX 9 Alaska Airlines mid-air incident underscored lingering questions about Boeing’s quality controls and safety culture, issues that can influence both public perception and the pace of regulatory approvals.[10] In March 2025, reports that Boeing and U.S. prosecutors were continuing talks on a potential criminal case settlement highlighted another layer of uncertainty that investors have had to factor into valuations.[7]
Product timelines remain a central concern. In July 2025, Boeing disclosed delays in certification for key models, including certain 737 MAX variants and the 777-9, pushing approvals into 2026 and raising the prospect of slower-than-hoped production ramps and deliveries.[3][13] Those delays complicate the otherwise improving picture on 737 MAX output, which had been cited by Wall Street as a reason for growing optimism about the stock as production increased and airlines sought to refresh fleets.[3][6][13]
Macro and policy dynamics also intersect with Boeing’s story. Tariff policy has been a recurring theme, with company leadership signaling support for strategies that protect and expand U.S. aerospace jobs even as raw materials and components can be subject to duties that affect costs.[11][13] In May 2025, for example, analysts at UBS raised their price target on Boeing while arguing that the company could navigate tariff risk, a view that underscored how trade policy and industrial strategy are increasingly intertwined for large manufacturers.[11]
Sector-wide, the aerospace recovery has been a key backdrop. As global travel demand has rebounded and airlines have moved to modernize fleets, higher 737 MAX production and deliveries have been cited as signs of an operational turnaround across the industry, with Boeing positioned as a primary beneficiary if it can execute on its backlog and maintain quality standards.[3][6][13] That context helps explain why the stock has been sensitive not only to its own headlines but also to broader market moves tied to corporate earnings and risk appetite, including the S&P 500’s record-setting run as major companies report results.[5]
Short interest in Boeing, reported at 2.27%, suggests that while some investors remain cautious, the stock is not heavily targeted by bearish positioning relative to many other high-profile names.[7] That leaves the seasonal window interacting with a market that is neither deeply skeptical nor euphoric, and where incremental news on deliveries, safety oversight or policy could tip sentiment in either direction.
The chart below situates the latest move in its recent multi-month context.
What to watch in this window
For the remainder of this 21-day midterm-year window, traders and investors will be watching how Boeing trades around key fundamental and policy catalysts relative to its historically strong seasonal backdrop. One focus will be whether the post-earnings pullback stabilizes above recent support levels, which would be more in line with prior years where early weakness gave way to gains, or whether selling pressure deepens in a way that would mark a clear departure from the pattern.[1][4][5]
Another area to monitor is the flow of news on production, certification and safety oversight. Updates on 737 MAX and 777-9 certification timing, any follow-on commentary from regulators after past hearings, and signals on delivery schedules could all influence whether investors lean into or fade the historical tendency for strength in this stretch.[3][6][10][13] Policy developments around tariffs and industrial strategy, particularly as the political calendar advances toward the pre-election year, may also shape sentiment, given Boeing’s role in trade and manufacturing debates.[5][11][13]
Finally, positioning and sentiment indicators such as short interest and options activity will be important to track. With short interest at 2.27%, a meaningful shift higher or lower could signal whether skeptics are pressing their view or covering into strength, which in turn would interact with the seasonal pattern’s history of sizable intraperiod swings.[7] How the stock behaves inside this window, relative to those historical tendencies, will offer a real-time read on whether the midterm-year playbook is still a useful guide for Boeing in the current cycle.
Sources
- [1] Yahoo Finance, "Boeing Q4 Earnings Preview: What To Expect From Upcoming Report" (Jan 26, 2026).
- [2] Forbes, "Why You Shouldn’t Be Buying Boeing Stock" (Mar 5, 2025).
- [3] Seeking Alpha, "Boeing tops expectations, stock seeks direction on higher deliveries and revenue beat" (Jul 29, 2025).
- [4] Barron's, "Boeing Earnings Trounced Expectations. The Stock Finally Turns Higher." (Jan 26, 2026).
- [5] Reuters, "S&P 500 hits record high as corporate earnings roll in; Medicare rates hit insurers" (Jan 27, 2026).
- [6] CNBC, "Wall Street sentiment on Boeing is improving as 737 MAX production increases" (Jun 5, 2025).
- [7] Seeking Alpha, "Boeing, U.S. prosecutors continue talks on criminal case settlement" (Mar 16, 2025).
- [8] Yahoo Finance, "'This Should've Been Caught Years Ago:' Boeing Faces NTSB Heat Over 737 MAX 9 Alaska Airlines Mid-Air Blowout Incident" (Jun 24, 2025).
- [9] CNBC, "Boeing gets a price target hike from UBS, which says the airplane maker can navigate tariff risk" (May 9, 2025).
- [10] Reuters, "Boeing's quarterly loss shrinks as jet deliveries rebound, but shares drop" (Jul 29, 2025).