10-for-10: Broadcom (AVGO) Has Never Posted a Losing Year in This 344-Day Window
Broadcom is trading near record territory as it steps into a 344-day stretch that has never produced a losing year in the past decade, just as its AI story dominates the chip sector.

Key takeaways
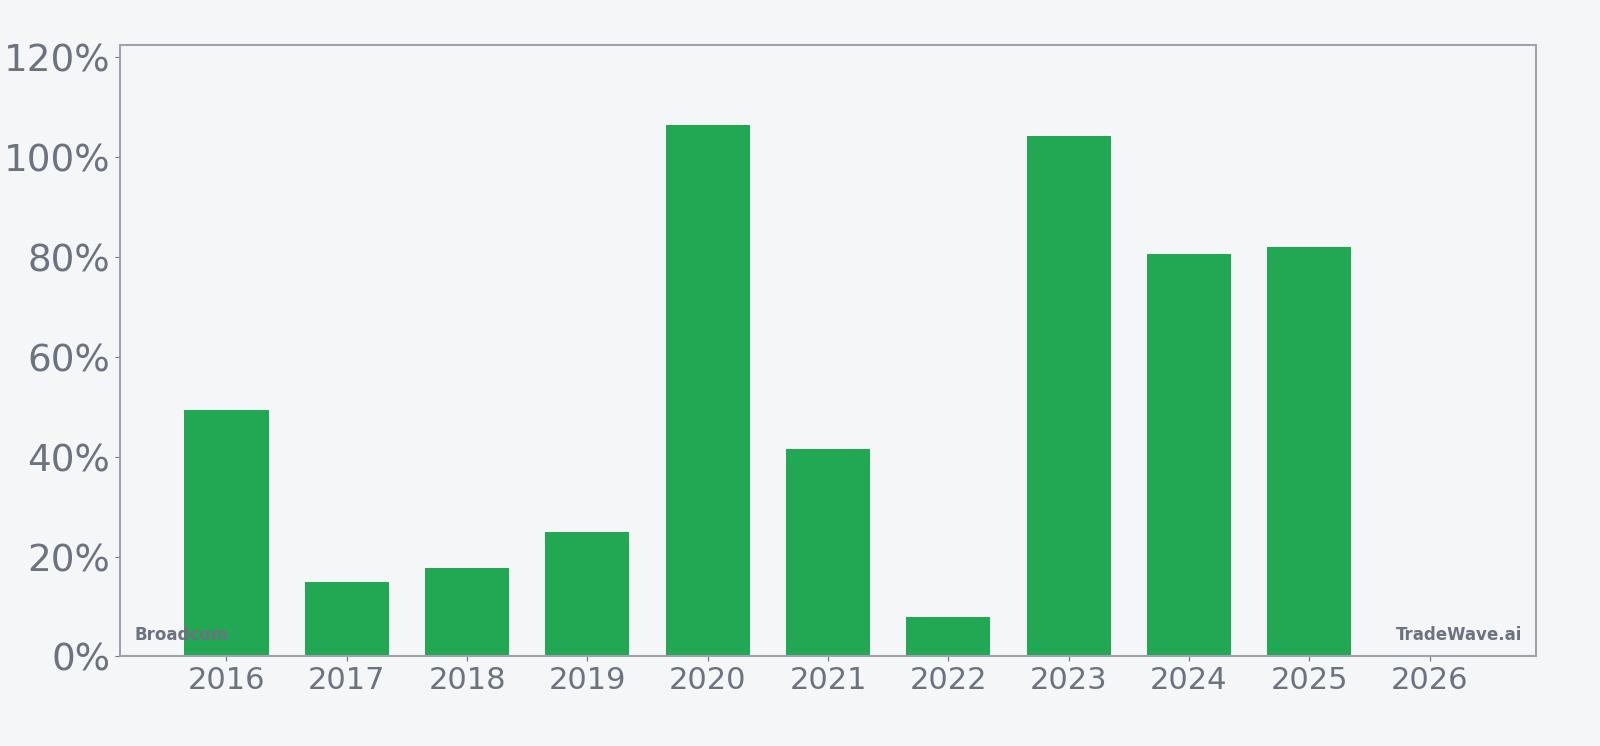
- Broadcom’s 344-day window starting Mar 8 has been positive in every one of the past 10 years, with 10 winners and 0 losers.
- Average gain across those years is 52.93%, with a median profit of 45.36% and cumulative return of 5,230% for the pattern.
- The trade direction is long, and the TradeWave Ratio of 1.45 signals that price has typically traveled meaningfully in the upside direction within the window.
- Intraperiod swings have been large in some years, with adverse moves exceeding 20% even when the final result was positive.
- Broadcom closed Friday at $330.48, about 20.0% below its 52-week high and more than double its 52-week low, underscoring how extended the stock already is.
- AI-driven revenue growth and custom chip deals have powered Broadcom’s fundamental story, but the seasonal record suggests this long regime has historically aligned with that strength.[1][3][5]
Seasonal window
Broadcom has posted gains in 10 of 10 years during this 344-day window, averaging 52.93% profits for long positions. The latest iteration begins with the stock at $330.48, about 20.0% below its 52-week high of $413.03 and roughly 142.2% above its 52-week low of $136.46. That combination of a flawless decade-long seasonal record and a stock already far off its lows makes this regime hard for traders to ignore.
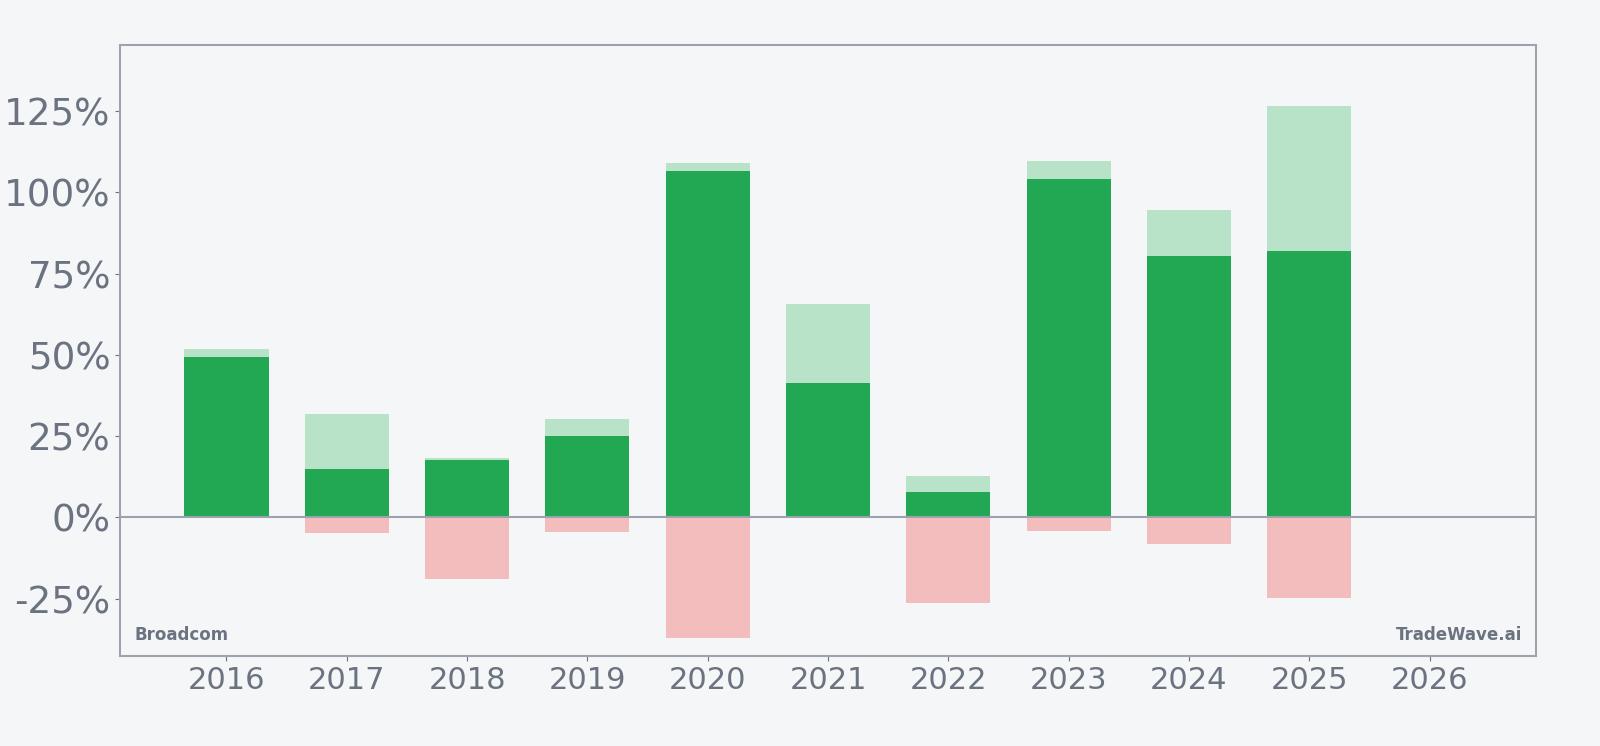
Yearly net and peak moves highlight upside persistence amid typical drawdowns.
Across the 10-year sample, the pattern is unambiguously aligned with the long side. Percent Profitable sits at 100%, with 10 winners and 0 losers, and the average gain of 52.93% means even the “typical” year has been a strong one for longs. The median profit of 45.36% shows that the record is not just about a single outlier year; half the sample delivered returns at or above that level.
Individual years show how powerful this window has been. In 2020, Broadcom logged a net return of 106.47% in the window, with a maximum favorable move of 108.86% from entry before giving back a small portion into the close. In 2023, the stock gained 104.18% with a peak run-up of 109.64%, while 2024 and 2025 still delivered net gains of 80.47% and 81.92% respectively despite already elevated starting prices.
The downside profile is more nuanced. Some years barely dipped at all, such as 2016 and 2021, where the worst intraperiod drawdowns were essentially flat. Others carried real air pockets: 2018 saw a maximum adverse move of about 18.92% from entry, 2020 experienced a 37.16% drawdown at one point, and 2022 and 2025 posted adverse excursions of 26.24% and 24.9% respectively. Those swings came even though every one of those years finished the window in the green.
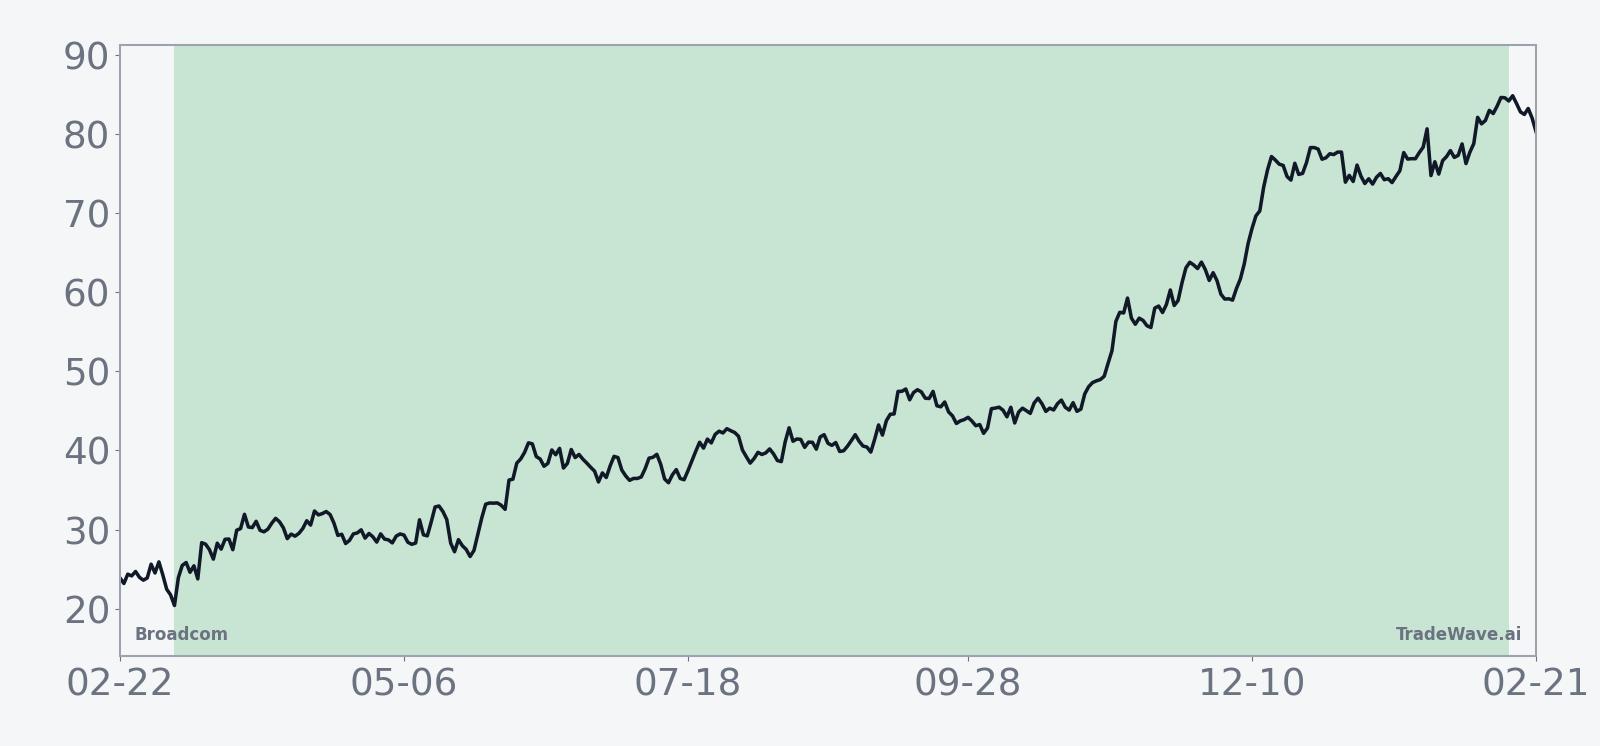
The 10-year average seasonal trend chart shows a pattern of early strength that tends to build over the first half of the window, followed by a second leg higher rather than a flat fade. That shape is consistent with the high TradeWave Ratio of 1.45, which indicates that price has typically traveled meaningfully in the upside direction within the window, not just drifted to a modest gain by the end.
The combined net, maximum favorable, and maximum adverse bars reinforce that message. In the strongest years, the maximum favorable excursion often pushed into triple-digit territory, while the worst drawdowns were materially smaller, though still uncomfortable for anyone trading with tight risk limits. In the softer years, upside was more modest but still positive, and the adverse excursions tended to cluster in the mid-teens to mid-20s range.
History does not guarantee future results; even in a window with no losing years so far, adverse excursions have at times exceeded 20%, and traders using this pattern still face meaningful drawdown risk.
Price and near-term drivers
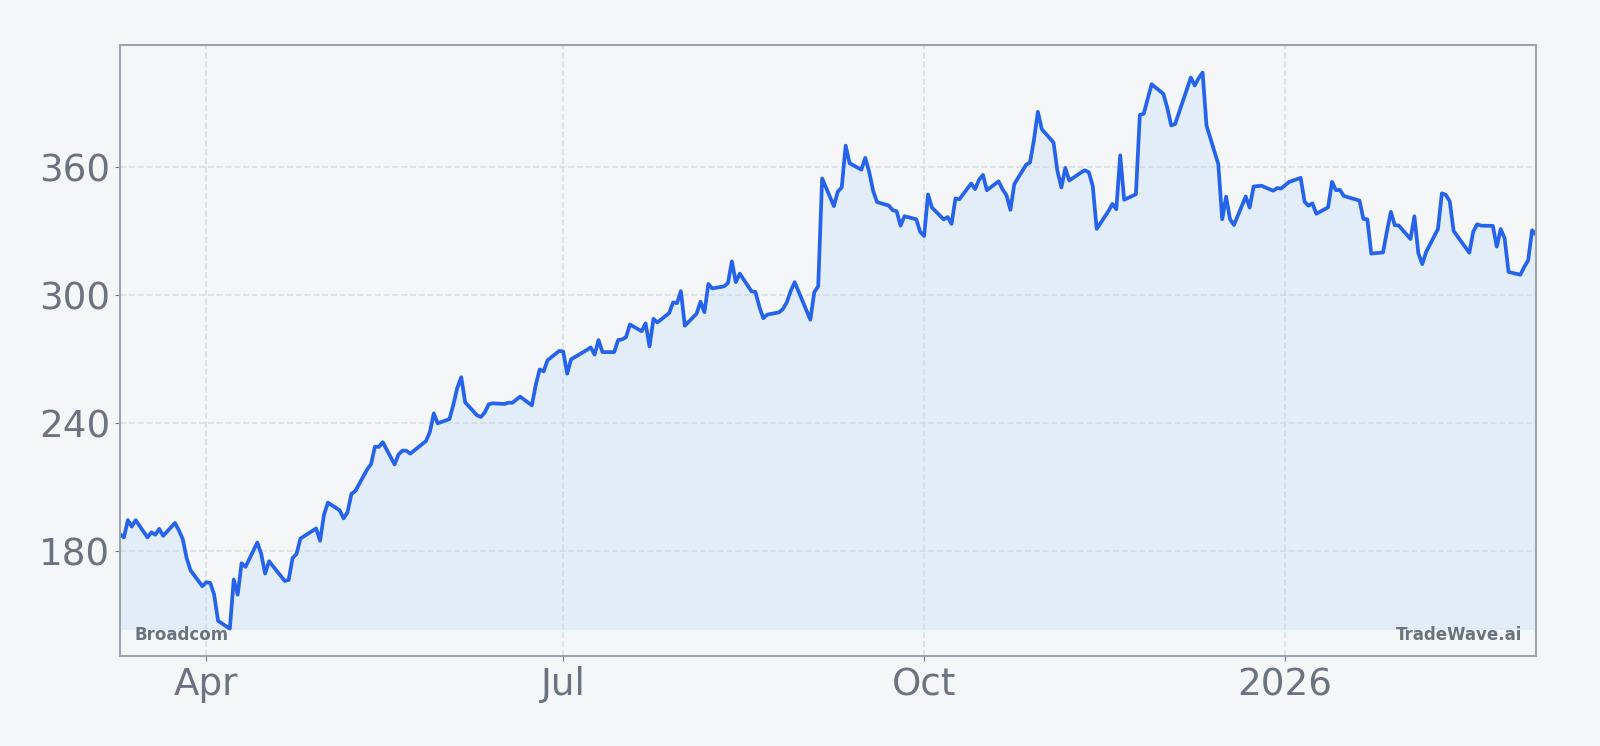
Broadcom closed Friday at $330.48, down 0.7% on the day, after trading between $327.40 and $343.51 on heavy volume of about 38.4 million shares. The stock sits about 20.0% below its 52-week high of $413.03 and roughly 142.2% above its 52-week low of $136.46, with a 6.43% gain over the past month and a 50-day moving average at $334.32 that it is currently trading just below.
In 2025, Broadcom’s story was dominated by AI. In October 2025, the company reported Q3 fiscal 2025 revenue of $15.9 billion, up 22% year over year, with AI revenue surging 63% and topping analyst expectations.[1][4] In December 2025, Broadcom followed with Q4 revenue of $18.0 billion, a 28% year-over-year jump driven by AI chip sales, even as investors focused on margin pressure and the sustainability of that growth.[5][6][7]
Partnerships have reinforced that narrative. In September 2025, Broadcom secured a $10 billion AI chip order that helped cement its role as a key supplier of custom silicon to hyperscale customers.[13] Later that year, the company announced a deal to provide custom chips and networking solutions to OpenAI, further anchoring its position in the AI infrastructure stack.[3]
Sector context has been supportive. Broadcom has been highlighted as an outperformer in semiconductors, with 28.0% revenue growth and operating margins around 39.0%, outpacing many peers that are still working through cyclical swings.[3] AI infrastructure has been the main engine: AI-related revenue growth in the 63% to 74% range has positioned Broadcom as one of the clearest beneficiaries of Big Tech’s push to diversify away from off-the-shelf accelerators and toward custom chips and networking solutions.[4][10][13]
Analysts have leaned into that story. In September 2025, Wall Street commentary framed Broadcom as a buy on the back of strong AI revenue growth and solid fundamentals, with a consensus rating of “Buy” and a price target around $372.33 from sources including Forbes and Seeking Alpha.[1][2][14] That target sits only modestly above the current price, reflecting how far the stock has already run over the past year rather than a lack of confidence in the business.
The chart below situates the latest move in its recent multi-month context.
Earnings and guidance backdrop
Broadcom heads into this new seasonal window with a powerful earnings backdrop. For fiscal 2025, the company delivered back-to-back quarters of record revenue, beating expectations on both the top and bottom line as AI demand accelerated.[1][4][5][6][7] Q3 fiscal 2025 earnings per share came in at $1.69 versus estimates of $1.66, while Q4 revenue of $18.0 billion topped consensus and underscored the scale of AI-driven demand.
Guidance has been equally aggressive. Management has projected that AI revenue will double to $8.2 billion in Q1 fiscal 2026 and reach about $45 billion for the full fiscal year, a trajectory that would keep Broadcom at the center of the AI infrastructure build-out.[1][5] That outlook has helped investors look past concerns about near-term margin compression as the company ramps capital-intensive projects and navigates pricing dynamics with large customers.
There is no confirmed date yet for the next earnings release, but the cadence of 2025 reports suggests that investors will be watching for updates on AI revenue mix, networking demand, and any signs of digestion in hyperscale spending. With the stock already well off its lows and the seasonal window historically favoring longs, the bar for earnings “beats” to move the stock meaningfully higher may be higher than it was a year ago.
Macro and sector context
Broadcom’s seasonal pattern is unfolding against a macro backdrop that still favors AI infrastructure spending. In December 2025, coverage from major outlets described the company as “firing on all cylinders,” pointing to strong demand for custom silicon and networking solutions as cloud providers race to expand AI capacity.[10] That demand has been reinforced by Big Tech’s push to diversify away from a single GPU supplier and toward custom chips that can be tuned for specific workloads.[13]
Within semiconductors, Broadcom has been framed as a relative winner. Comparative analysis in late 2025 highlighted its 28.0% revenue growth and 39.0% operating margin as among the best in its peer group, helped by a mix that leans heavily toward data center and networking rather than more cyclical PC or handset exposure.[3] AI infrastructure themes have only amplified that advantage, with AI revenue growth in the 63% to 74% range putting Broadcom in the same conversation as the highest-growth names in the space.[4][5]
Valuation and positioning
Valuation is harder to pin down precisely without a full set of multiples, but the available context suggests that Broadcom is priced as a premium AI infrastructure name rather than a cyclical chip stock. The consensus price target of $372.33 from sources including Forbes and Seeking Alpha sits modestly above the current $330.48 share price, reflecting both the stock’s strong run and the market’s expectation that AI revenue growth can continue at a high clip.[1][2][14]
In October 2025, Forbes highlighted that Broadcom’s stock had jumped 110% over the prior period, driven by AI demand and strong execution.[1] By December 2025, Seeking Alpha and other outlets were debating whether the market was “sweating the AI details,” focusing on how much of the future growth story was already embedded in the price.[2][5] That debate remains relevant as the new seasonal window opens with the stock still far above its 52-week low and only a moderate distance below its high.
According to historical data from TradeWave.ai, this long stretch on the calendar has behaved very differently from an average year for Broadcom. The next section looks at how that pattern has lined up with the company’s AI-driven run over the past decade.
What to watch in this window
The historical record for this 344-day window is striking: 10 winners, 0 losers, and average gains north of 50% for long positions. The key question for traders is not whether history will repeat, but how Broadcom behaves around a few concrete catalysts while this regime is in effect.
First, earnings. With management guiding to AI revenue of $8.2 billion in Q1 fiscal 2026 and $45 billion for the full year, each quarterly update will be a referendum on whether that ramp is on track.[1][5] Upside surprises on AI revenue or margins would be consistent with the historical pattern of strong performance in this window, while any sign of slowing orders or pricing pressure could test the stock’s ability to follow its seasonal script.
Second, levels. On the downside, traders will be watching how Broadcom behaves if it revisits its 50-day moving average around $334.32 or the recent intraday lows near $327.40. A break below those levels with expanding volume would echo the deeper intraperiod drawdowns seen in years like 2018, 2020, 2022, and 2025, when adverse moves of 18% to more than 30% occurred even as the window ultimately finished higher.
On the upside, the 52-week high around $413.03 is the obvious reference point. A sustained move back toward that area, especially if it comes alongside fresh AI contract wins or stronger-than-expected earnings, would look very similar to the high-MFE years in the seasonal record, where Broadcom’s peak run-ups exceeded 100% from entry.
Finally, macro and sector flows matter. Broadcom’s role as a key supplier of custom AI chips and networking gear means that any shift in hyperscale capex plans, regulatory scrutiny of AI spending, or competitive dynamics in accelerators could either reinforce or undercut the seasonal tendency.[3][4][10][13] If AI infrastructure budgets keep expanding and Broadcom continues to win large, multi-year deals, the historical pattern of strong performance in this window will look less like a quirk of the calendar and more like a reflection of how its business lines up with the cycle.
Add it up: Broadcom enters this 344-day stretch with a flawless seasonal record, a powerful AI earnings story, and a stock that is already well off its lows. Traders watching this window will be focused on whether earnings, AI demand, and price action around key levels confirm that history, or finally deliver the first real break in a decade-long pattern.
Sources
- [1] Forbes – “AVGO: Why Broadcom Stock Jumped 110%” (Oct 17, 2025)
- [2] Seeking Alpha – “Broadcom Stock: Poised To Surge To New Highs” (Jun 8, 2025)
- [3] Forbes – “Is AVGO Stock Beating Competition?” (Oct 30, 2025)
- [5] Seeking Alpha – “Broadcom: Market Sweating The AI Details” (Dec 15, 2025)
- [6] Yahoo Finance – “Broadcom Smashes Q4 Estimates” (Dec 12, 2025)
- [7] The Wall Street Journal – “Broadcom Beats Revenue and Profit Forecasts” (Dec 11, 2025)
- [10] CNBC – “Broadcom is firing on all cylinders” (Dec 8, 2025)
- [13] Reuters – “Broadcom shares rally on new AI deal” (Sep 5, 2025)
- [14] Seeking Alpha – “Broadcom Stock: Poised To Surge To New Highs” (analyst commentary, Jun 8, 2025)