KKR & Co. (KKR) Has Rallied in 10 Straight 145-Day Spring-Summer Windows
KKR & Co. is heading into a historically powerful 145-day spring–summer stretch just as the stock trades sharply below its recent peak after a steep pullback.

Key takeaways
- KKR & Co. has posted gains in this 145-day spring–summer window in 10 of 10 years, a 100% hit rate for long exposure.
- The upcoming window begins Mar 5, 2026 and historically has delivered an average profit of 17.23% for KKR.
- All 10 years in the sample were winners, with cumulative gains of 371% across those seasonal windows.
- Intraperiod swings have been large: the worst year saw a drawdown of 44.84% from entry before finishing higher.
- KKR closed at $87.68 on Mar 2, about 42.5% below its 52-week high and just 3.1% above its 52-week low, after a 6.3% daily drop.
- The pattern’s TradeWave Ratio of 2.4 and Sharpe ratio of 1.44 point to historically strong, but volatile, upside for longs.
According to historical data from TradeWave.ai, this specific spring–summer stretch has behaved very differently from an average calendar period for KKR. The next section walks through how that pattern has played out over the past decade and what it means as the 2026 window approaches.
Seasonal window
KKR & Co. has risen in 10 of 10 years during this 145-day spring–summer window, averaging 17.23% gains for long positions. The next iteration begins on Mar 5, 2026, with the stock coming off a sharp slide to $87.68, about 42.5% below its 52-week high of $152.44 and only about 3.1% above its 52-week low of $85.08.
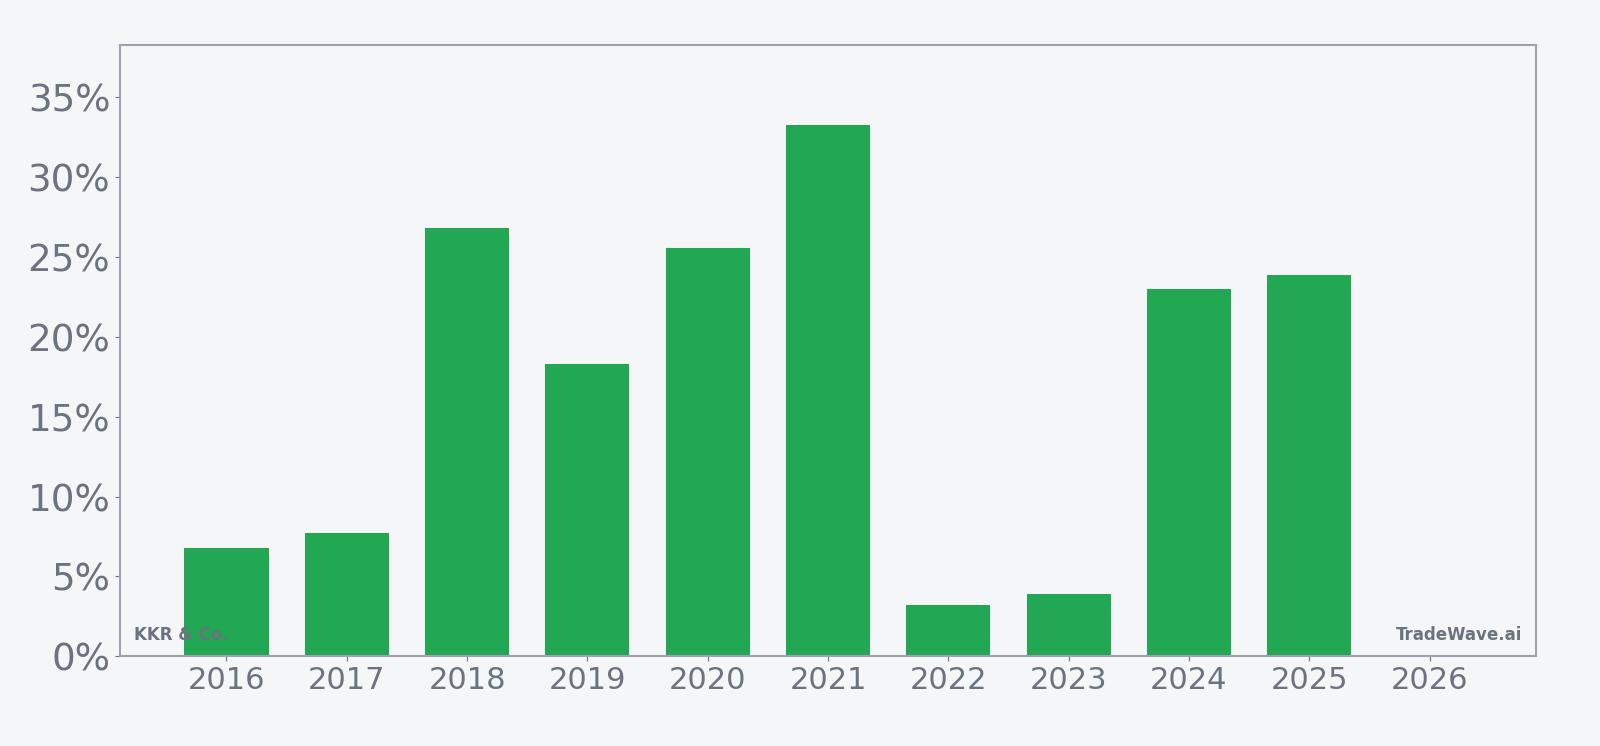
Historically, this has been a long-biased regime for KKR. The trade direction is long, and every one of the past 10 windows finished positive, with cumulative gains of 371% across those seasonal slices. Average profit of 17.23% means that, on average, a long held from the start to the end of the window added roughly that amount, while the median outcome of 20.62% shows that more than half the years landed above the average.
The distribution of outcomes is not just about steady single-digit moves. The strongest years, such as 2021 and 2025, delivered net returns of 33.25% and 23.86% respectively, while even the softest years like 2016 and 2022 still finished higher by 6.79% and 3.2%. That mix explains why the Sharpe ratio of 1.44 is relatively high for a single recurring window, even though the standard deviation of 10.9% shows that results have varied meaningfully from year to year.
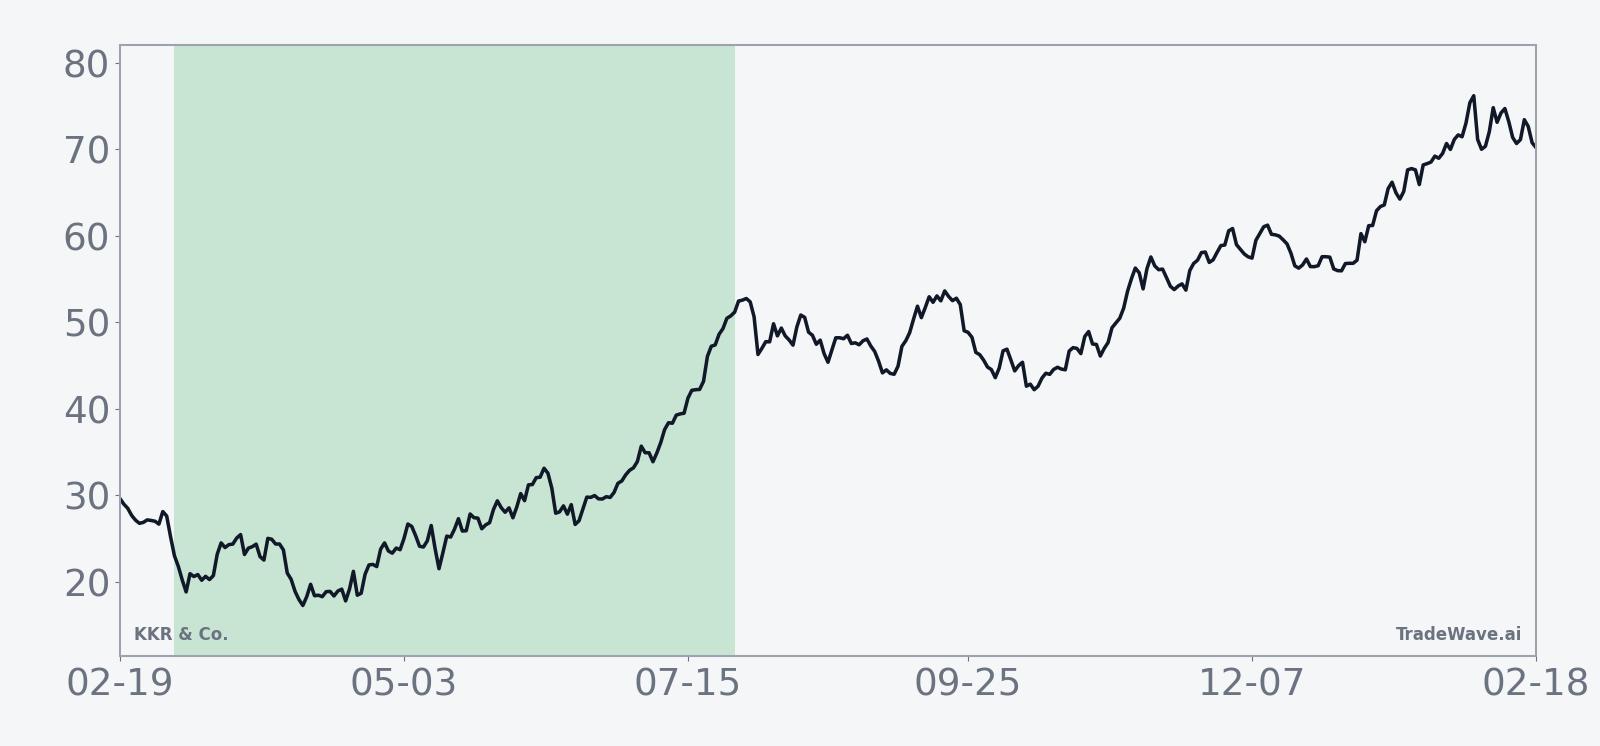
The historical seasonal trend chart shows gains tending to build in stages rather than in a straight line. In many years, KKR has seen an early push higher, a mid-window pause or pullback, and then a second leg of strength into the later part of the period. That pattern of stair-step advances fits with the firm’s deal and fundraising cadence, where news flow often clusters around mid-year updates.
Yearly net and peak moves highlight upside persistence amid typical drawdowns.
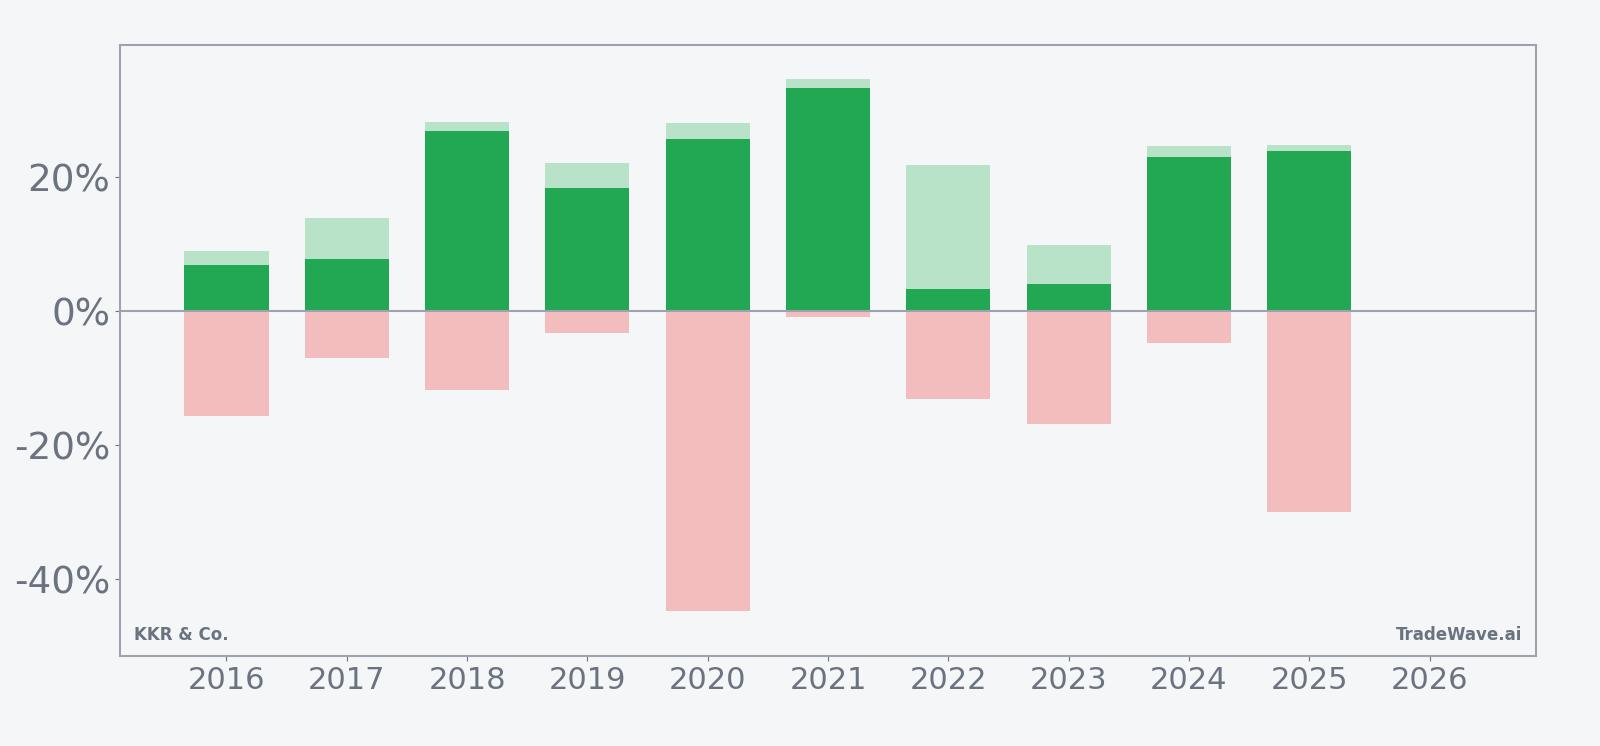
The combined net, maximum favorable move and maximum adverse move view shows why this window has been powerful but not comfortable. In 2020, for example, KKR ultimately finished the window up 25.55%, yet at one point it was down 44.84% from the entry before recovering. Several other years, including 2016, 2018 and 2023, also saw double-digit drawdowns inside windows that still ended green. Large maximum favorable excursions, such as 34.49% in 2021 and 27.97% in 2020, underline how far the stock has tended to run when the trend is working.
History does not guarantee future results; adverse excursions can be large even in winning windows, and past patterns may not repeat.
Price and near-term drivers
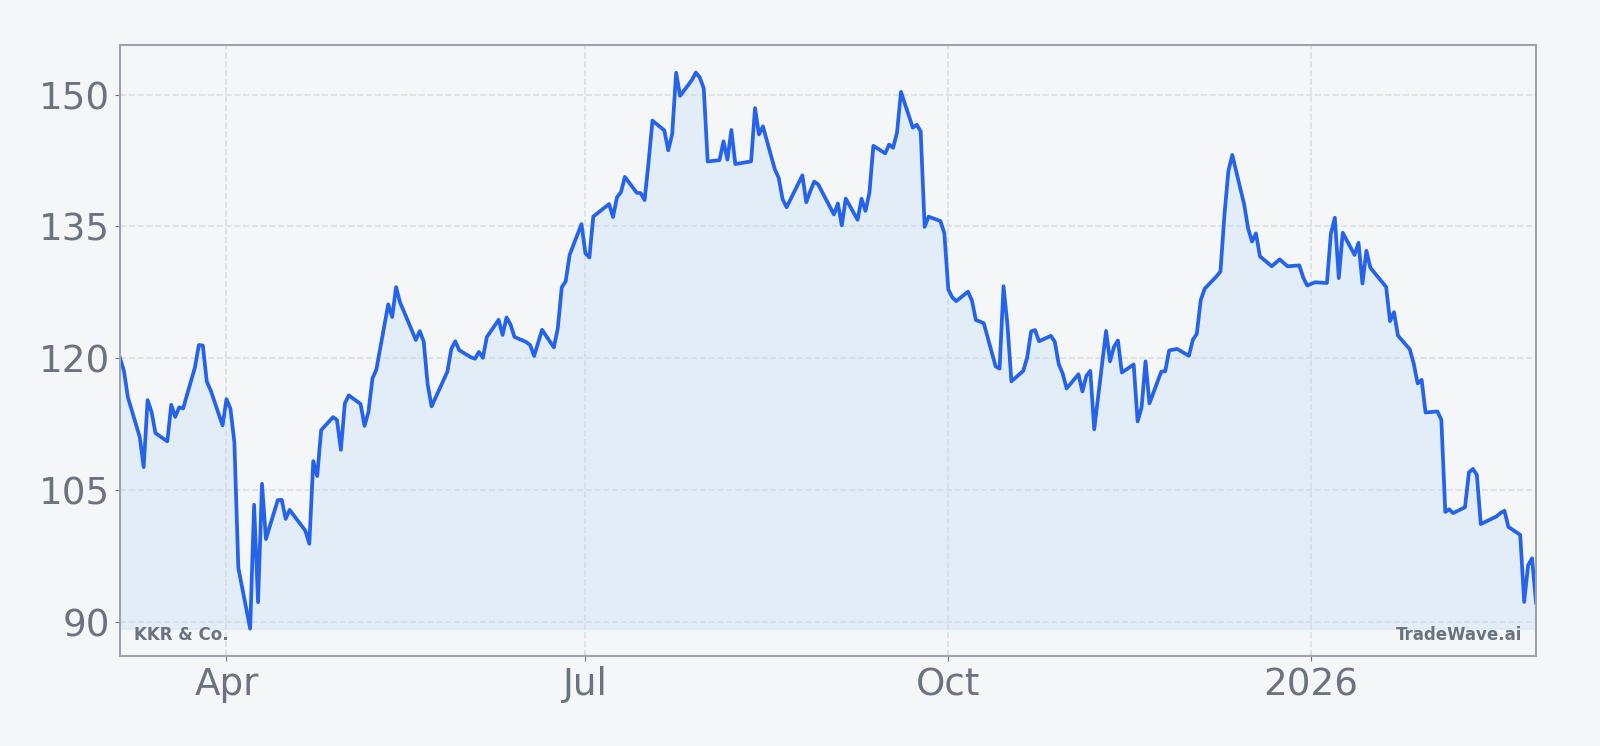
KKR shares closed at $87.68 on Mar 2, down 6.3% on the day and extending a rough month that has left the stock about 23.47% lower over the past 30 days. That slide has pushed KKR to roughly 42.5% below its 52-week high of $152.44 and only about 3.1% above its 52-week low of $85.08, with Monday’s session trading between an intraday high of $92.21 and a low of $86.35 on heavy volume of more than 20 million shares versus a 20-day average of about 10.6 million.
The chart below situates the latest move in its recent multi-month context.
From a fundamental backdrop, KKR enters this seasonal window with a track record of solid profit growth and expanding assets under management, even if the latest detailed figures date back to 2025. In July 2025, the firm reported quarterly profit of $472.4 million, or 50 cents a share, with assets under management climbing 14% to $686 billion as fundraising remained strong.[1] In November 2025, KKR followed up with adjusted net income of $1.27 billion, or $1.41 per share, beating analyst expectations of $1.17 billion and showing that fee-related earnings and investment income were both contributing to the bottom line.[2]
Deal activity and capital formation have also been central to the story. In July 2025, KKR was reported to be in talks to acquire ST Telemedia Global Data Centres in a transaction valued at more than $5 billion, underscoring its push into digital infrastructure.[3] Around the same time, the firm raised $6.5 billion for asset-backed financing strategies, drawing commitments from a broad base of investors and reinforcing its role as a major player in private credit.[4] Earlier in June 2025, KKR increased its conditional offer for German IT services firm Datagroup SE to up to 58 euros per share in an all-cash deal, another example of its willingness to pay up for platform assets in key sectors.[5]
Those moves fit a broader sector backdrop in which large alternative asset managers have been able to grow assets and fee streams despite choppy public markets. KKR’s rising assets under management and fundraising momentum in 2025 reflected strong investor appetite for private equity, infrastructure and private credit exposure, even as volatility in listed equities picked up.[1] That dynamic can cut both ways for the stock: higher fee-earning assets support earnings power, but mark-to-market swings in investment portfolios and changing rate expectations can drive sharp moves in the share price, as the recent pullback shows.
Earnings backdrop
KKR has not yet set a public date for its next earnings release, but the most recent detailed results from 2025 sketched out a business that was scaling across multiple fronts. In the second quarter of that year, KKR reported profit of $472.4 million, or 50 cents a share, compared with $667.9 million a year earlier, while adjusted per-share earnings came in at $1.18.[1] By the November 2025 quarter, adjusted net income had climbed to $1.27 billion, or $1.41 per share, topping consensus estimates and signaling that performance fees and investment income were rebounding alongside inflows.[2]
Street expectations for 2026 are not captured in the available data, but the 2025 trajectory suggests investors will be watching three levers closely as the next seasonal window opens. First is fee-related earnings, which depend on continued fundraising and deployment. Second is realized and unrealized investment income, which can swing with markets and deal exits. Third is the pace of new capital formation in areas like infrastructure, data centers and private credit, where KKR has been particularly active.[1][2][3][4][5]
Macro and sector context
KKR sits at the intersection of several macro forces: interest rates, credit spreads, equity valuations and institutional demand for alternative assets. In 2025, the firm’s ability to grow assets under management and raise multi-billion-dollar vehicles suggested that large allocators were still shifting capital toward private markets despite bouts of volatility in public equities.[1][4] For a stock like KKR, that backdrop can create a disconnect between near-term share price swings and the slower-moving fundamentals of fee-bearing capital.
Within the private equity and asset management sector, KKR’s fundraising and deal activity in 2025 positioned it as one of the more aggressive players in deploying capital into infrastructure, technology and asset-backed financing.[3][4][5] If that pace continues into 2026, the firm could see a growing base of management and performance fees over the next several years, even if quarterly results remain lumpy. For traders focused on the upcoming seasonal window, the key question is how those macro and sector currents intersect with a stock that has already sold off hard into early March.
Valuation and positioning
Traditional valuation markers such as forward price-to-earnings or consensus price targets are not available in the current dataset, but the technical picture offers some clues about positioning. KKR’s close at $87.68 sits well below its 50-day simple moving average of about $117.42, a gap of roughly 25%, which signals that the recent selloff has pushed the stock into a deeply overshot zone relative to its short-term trend. Average 20-day volume of around 10.6 million shares, compared with more than 20 million shares traded on Mar 2, points to elevated activity as the stock reprices.
That combination of a sharp drawdown, heavy volume and a price sitting near the bottom of its 52-week range often reflects a mix of forced selling, risk reduction and opportunistic buying. For a name like KKR, where fundamentals are tied to long-duration fee streams and private assets, such dislocations can set the stage for outsized moves when sentiment turns. The historical seasonal pattern suggests that, in prior years, that turn has often arrived in the spring–summer window that begins in early March.
What to watch as the window opens
The next 145 trading days, starting Mar 5, will test whether KKR’s 10-for-10 seasonal streak can survive a very different starting point. The stock is entering this window from a position of weakness, trading far below its 52-week high and under its 50-day moving average, rather than from strength as in several prior years. That makes the early weeks of the window especially important: in past cycles, strong years often saw an early push higher, while years with deeper intraperiod drawdowns tended to experience that pain sooner rather than later.
Traders watching this pattern will likely focus on three things. First, how KKR behaves around key technical levels such as the recent low near $85 and the 50-day moving average near $117. A quick reclaim of broken support and a move back toward the moving average would rhyme with the stronger historical years. Second, any updates on fundraising, deal activity or portfolio exits that could shift the earnings outlook, particularly in infrastructure, data centers and private credit where KKR has been active.[1][3][4][5] Third, the tone of the broader private equity and asset management sector, since risk appetite for alternatives can amplify or dampen stock-specific seasonality.
Add it up: KKR is heading into a window that has never produced a losing year in the past decade, with an average gain north of 17% and several instances of 20% to 30% rallies. At the same time, the historical record shows that those gains have often come with double-digit drawdowns along the way. How the stock trades in the first few weeks after Mar 5 will offer an early read on whether 2026 is shaping up to look more like the smoother years such as 2019 and 2024, or the more volatile but ultimately positive years like 2018 and 2020.
Sources
- [1] The Wall Street Journal, "KKR Posts Higher Revenue, Increases Assets Under Management" (Jul 31, 2025)
- [2] Reuters, "KKR's quarterly profit beats estimates on rising inflows" (Nov 7, 2025)
- [3] Reuters, "KKR in talks to buy ST Telemedia Global Data Centres, Bloomberg News reports" (Jul 26, 2025)
- [4] Reuters, "KKR raises $6.5 billion for asset-backed financing" (Jul 30, 2025)
- [5] Reuters, "KKR raises conditional offer for German IT services firm Datagroup" (Jun 1, 2025)