Progressive Corporation (PGR) Has Rallied in 10 of 10 Midterm Spring Windows
Progressive Corporation is about to enter a 93-day midterm-year stretch that has never produced a losing season in the past decade of cycles, even as the stock trades well below its 52-week high.

Key takeaways
- Progressive Corporation has posted gains in all 10 midterm-year windows that match this 93-day pattern, with an average profit of 11.33% for long exposure.
- The upcoming window begins Mar 2, 2026 and runs for roughly three months, covering the early part of the midterm election year when policy noise often rises.
- Percent Profitable stands at 100%, with 10 winners and 0 losers across the last 10 midterm election years in this slice of the calendar.
- Average winner gains of 11.33% come alongside a TradeWave Ratio of 1.77, indicating that price has typically traveled meaningfully in the trade direction within the window.
- Intraperiod drawdowns have varied, with some years seeing adverse moves of more than 15% before finishing higher, so timing and risk controls still matter.
- Shares closed Friday at $213.66, about 17.3% below their 52-week high of $258.44, leaving room on the chart if the historical midterm-year pattern repeats.
According to historical data from TradeWave.ai, this specific midterm-year stretch has behaved very differently from an average quarter for Progressive Corporation, and the next iteration starts Monday.
Seasonal window
Progressive Corporation has risen in all 10 midterm election years during this 93-day window, averaging 11.33% gains for long positions. The next window begins on Mar 2, 2026, with the stock last changing hands at $213.66, about 17.3% below its 52-week high of $258.44 and above its 52-week low of $176.74.
Grouping the data by the presidential election cycle matters here because property and casualty insurers often feel policy shifts in auto, healthcare and capital standards most acutely in midterm years, when Congress tends to revisit regulatory agendas. This pattern isolates the last 10 midterm election years and asks a simple question: what has typically happened to Progressive during this early-year stretch when Washington noise is high but the next presidential race is still two years away.
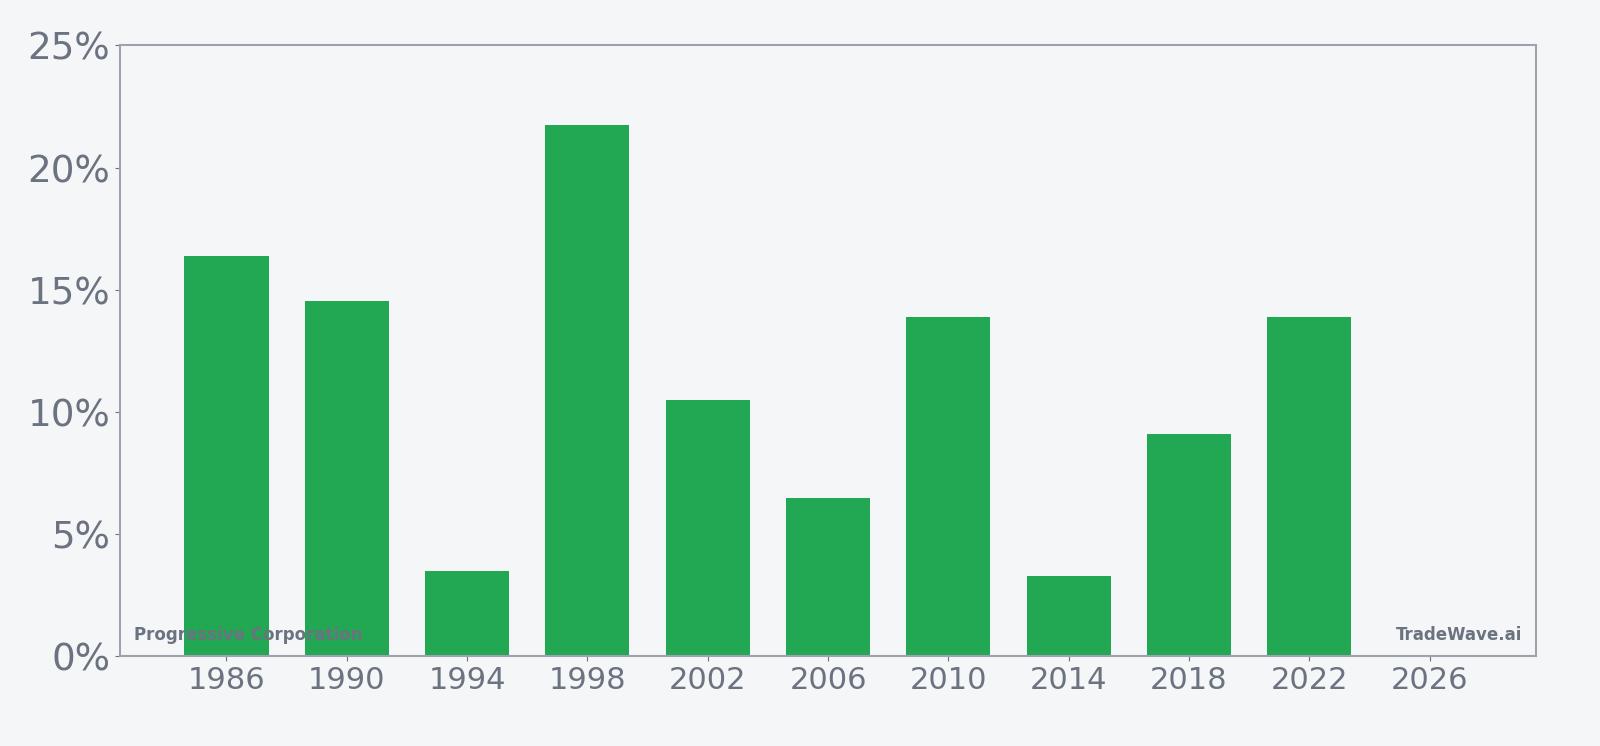
Historically this has been a straightforward long-biased setup. Percent Profitable is 100%, with 10 winners and 0 losers, and the average profit of 11.33% means that even the softer years still finished in the green for long exposure. Median profit of 12.18% sits slightly above the average, which hints that the distribution of outcomes has leaned toward solid double-digit gains rather than being skewed by a single outlier year.
The per-year table shows how that plays out in practice. The strongest year in the sample was 1998, when Progressive gained 21.76% during the window, with a maximum favorable move of 26.58% and almost no adverse excursion at all. At the other end of the spectrum sits 1994, which still finished up 3.49% but saw a maximum adverse move of 17.65% before recovering, a reminder that even “all green” windows can feel rough in real time.
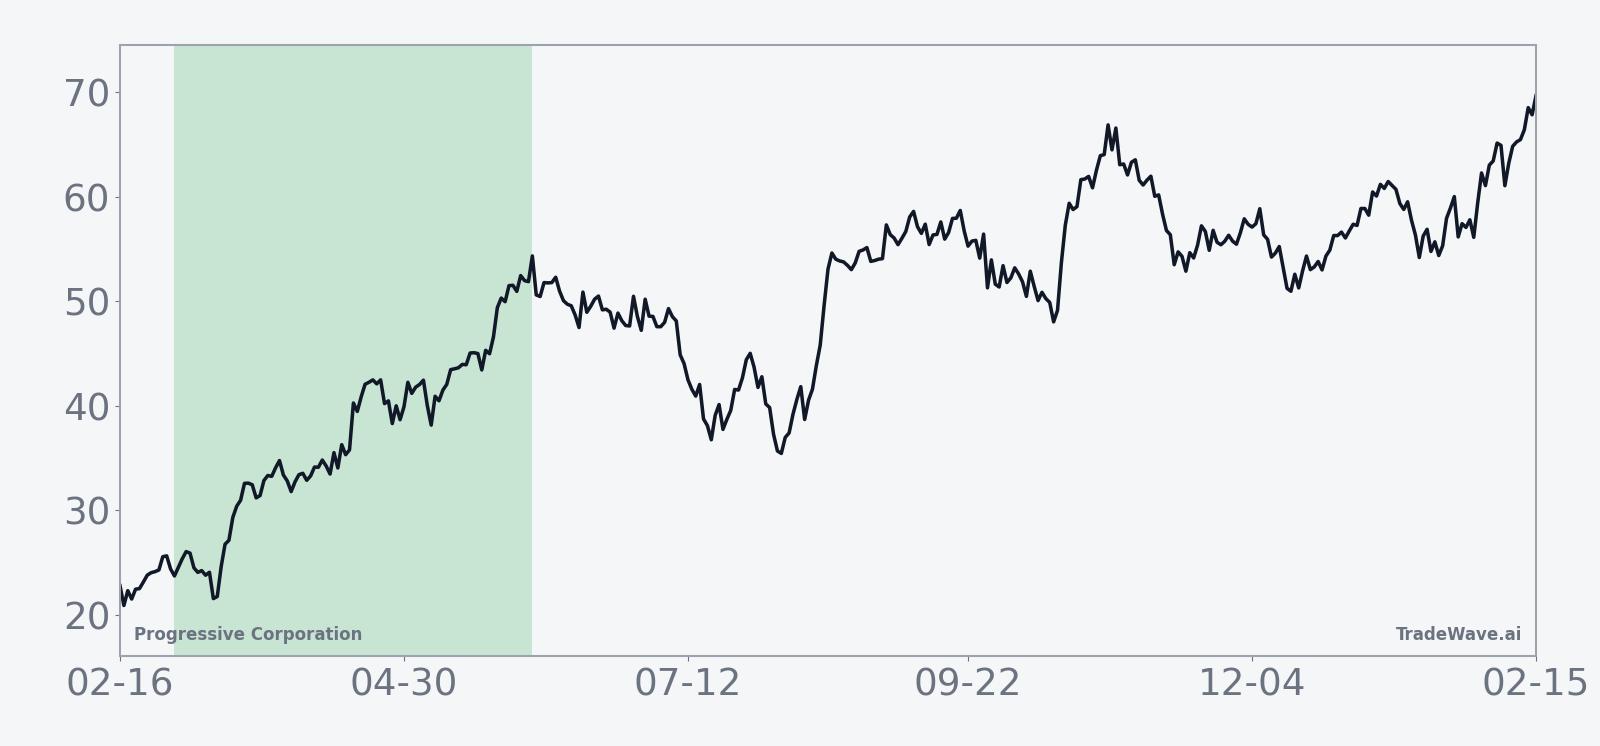
The historical seasonal trend chart suggests that gains have tended to build steadily rather than arriving in a single burst. In many of the past midterm years, the stock has pushed higher early in the window, consolidated, then added another leg of strength into the back half, which fits with a pattern of investors digesting early-year macro headlines before refocusing on company fundamentals.
A closer look at yearly net returns alongside best and worst intraperiod swings shows how much room the stock has typically had to move inside the window.
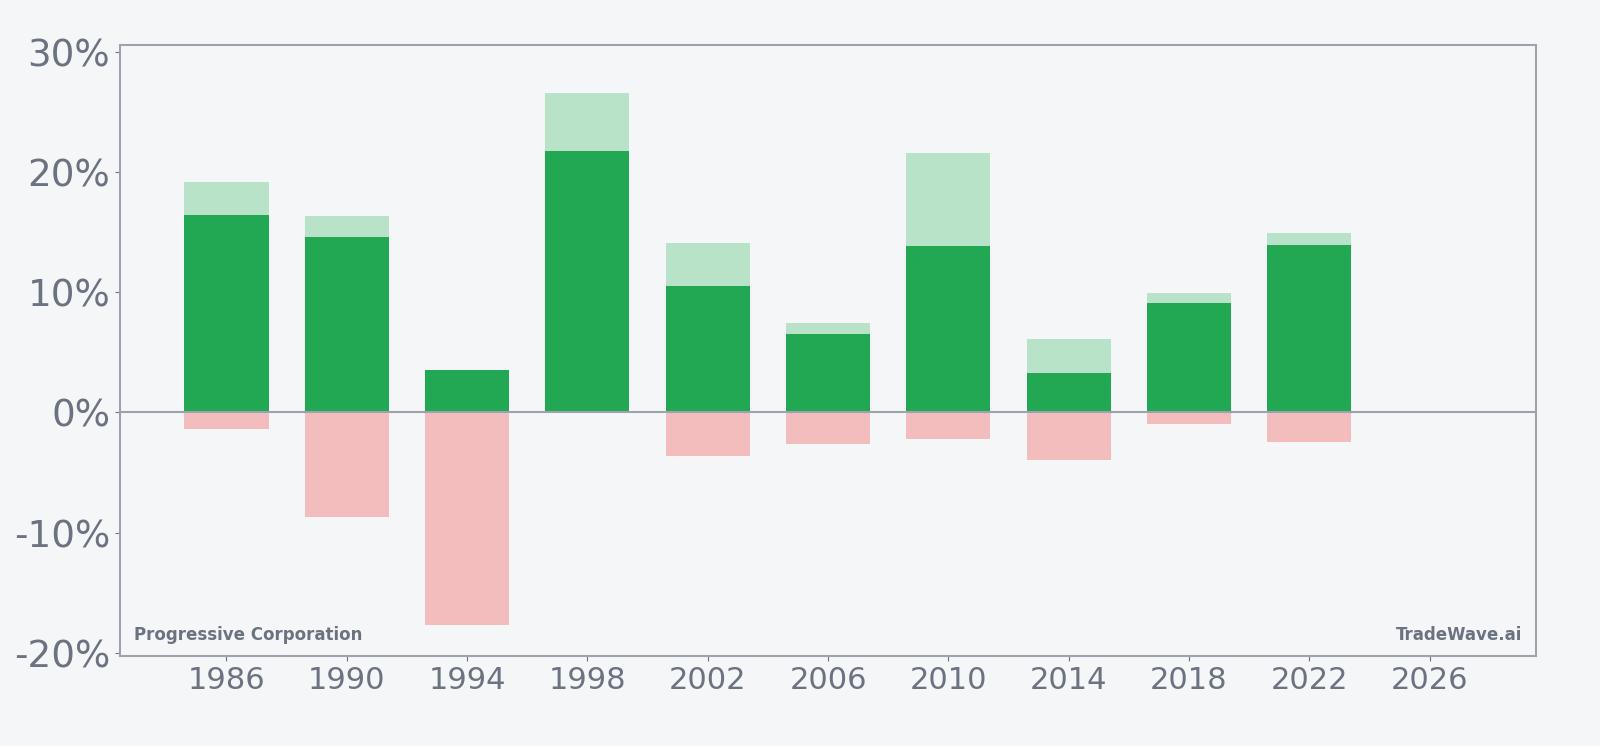
The combined net, maximum favorable move and maximum adverse move bars underline that this has been a high-conviction but not low-volatility pattern. In several years, maximum favorable excursions ran into the mid-teens or higher, while adverse moves often stayed in the low single digits, which is consistent with a long-friendly window. The exception is 1994, where the worst drawdown was deep before the stock clawed back to a modest gain, a template for how even a “winning” season can test patience.
History does not guarantee future results, and adverse excursions can still be large even in windows where every historical year finished higher.
Price and near-term drivers
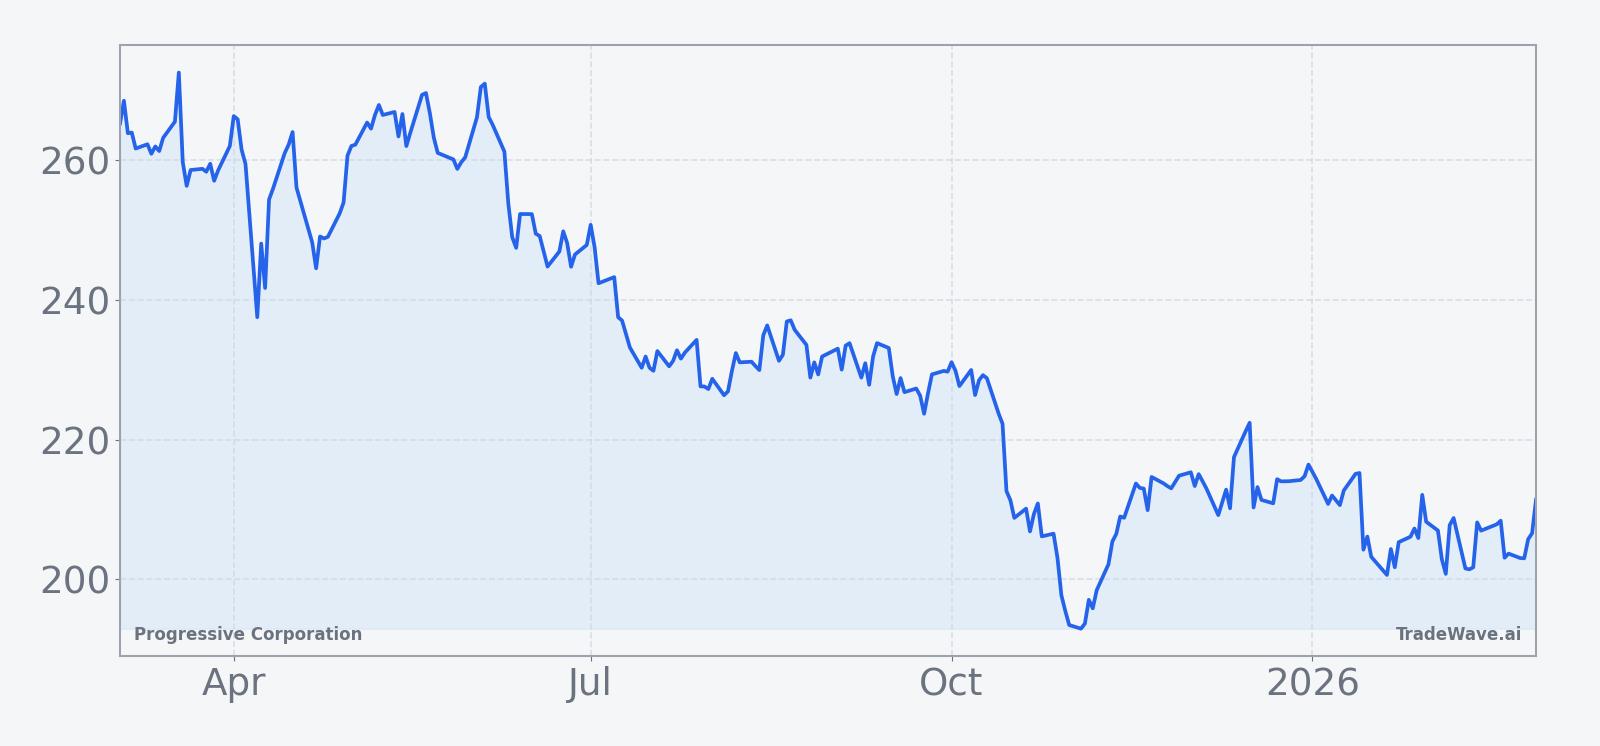
Progressive closed Friday at $213.66, up 0.9% on the day, after trading between $211.03 and $214.37 on volume slightly below its 20-day average of about 3.39 million shares. The stock sits well above its 50-day moving average of $205.71 but remains about 17.3% below its 52-week high of $258.44, leaving it in a consolidation zone rather than at stretched levels.
Fundamentally the company is coming off a strong run of results. In January 2025, Progressive reported an 18% increase in net premiums to $6.481 billion, a 59% jump in net income to $1.117 billion and a 61% surge in EPS, reflecting both firm pricing and solid retention in its core auto and property lines.[1] That profitability rebound followed a period of industry-wide pressure from inflation in repair and medical costs, and it helped reset expectations for how quickly large personal-lines carriers could reprice their books.
Analyst views have been mixed across that arc. In February 2025, Morgan Stanley raised its price target to $317 and projected 2025 earnings of $16.60 per share, citing an improved underwriting environment and easing regulatory headwinds.[1] By October 2025, the same firm had shifted to an underweight rating with a $214 target, pointing to concerns about market performance and valuation after a strong run.[1] With the stock now trading almost exactly in line with that later target, the market has effectively met those more cautious expectations ahead of the new seasonal window.
The chart below situates the latest move in its recent multi-month context.
Macro and policy backdrop
The upcoming window lands in the early part of the midterm election year, a phase that often brings more noise around insurance regulation, auto safety standards and healthcare policy. For a carrier like Progressive, that can translate into headline risk around capital requirements, rate approvals and claims inflation, even if the underlying business trends remain steady. Historically, the company has navigated those periods well in this specific slice of the calendar, which is what the seasonal pattern is capturing.
At the same time, the broader rate environment remains central for insurers. Higher yields on fixed-income portfolios can support investment income, but they also interact with equity valuations and consumer credit conditions. The historical midterm-year pattern for Progressive suggests that, in prior cycles, investors have eventually looked through early-year policy jitters and focused on earnings power as the year progressed, rewarding the stock during this March-to-summer stretch.
What to watch as the window opens
For traders tracking this pattern, the first checkpoint is how Progressive behaves as the window opens on Mar 2. In prior midterm years, stronger seasons often featured early follow-through rather than long delays, with the stock starting to grind higher within the first few weeks of the window. A firm tone above the 50-day moving average and a push back toward the $230–$240 area would be consistent with that historical script, while a quick break back toward the high $190s would mark a clear deviation.
Policy and earnings headlines will matter just as much as the tape. Any fresh commentary on auto insurance pricing, claims severity or regulatory scrutiny could either reinforce or challenge the idea that Progressive is in a fundamentally stronger position than it was heading into the last midterm cycle. Investors will also be watching for updated guidance on premium growth and combined ratios, given how central those metrics were to the bullish reassessment in early 2025.[1]
Inside the window, behavior around drawdowns is another tell. Historically, even the weaker years in this pattern have seen the stock recover from mid-window dips to finish higher, but 1994 showed that those dips can be sharp before the rebound. If Progressive sells off hard on a headline and then quickly finds buyers, that would rhyme with the historical maximum adverse move profile. A sustained breakdown that fails to attract support would be a clear sign that this midterm-year season is diverging from the last 10.
Finally, the interaction between Progressive’s stock and the broader financials and insurance complex will be important. The company is a key component of major insurance and financials indices, so a strong or weak showing in this historically favorable window could influence sentiment across the group. If the stock can rebuild momentum from a level that is still well below its 52-week high, the combination of supportive seasonality and improving fundamentals could keep it in focus for both sector specialists and macro investors looking for midterm-year plays.