Warner Bros. Discovery (WBD) Has Dropped in 10 of 11 Years in This 83-Day Stretch
Warner Bros. Discovery is trading just below a 52-week high as it sits in an 83-day stretch that has historically rewarded short sellers, adding another layer of risk to a stock already in play for deals and restructuring.

Key takeaways
- From early March over an 83-day span, Warner Bros. Discovery has moved in favor of short positions in 10 of the past 11 years, with Percent Profitable at 91% for this window.
- The pattern is short-directed, with average gains of 15.16% in winning years and a 15% average outcome across all years, pointing to a historically powerful downside bias.
- The window, which began Mar 1 and runs roughly into late May, has seen a cumulative 336% return for the short side over the 10-year sample.
- Intraperiod swings have been large, with several years showing double-digit peak moves in both favorable and adverse directions, underscoring high volatility risk for anyone leaning against the pattern.
- Today WBD trades at 28.50, up 1.2% on the day and about 5.0% below its 52-week high of 30.00, leaving room for either a squeeze or a reversal as the seasonal window unfolds.
- Deal speculation, revenue pressure and streaming competition frame the fundamental story, while this historically weak stretch for the stock adds a quant-driven caution flag for bulls.[3][4]
According to historical data from TradeWave.ai, this particular March-to-late-May stretch in Warner Bros. Discovery has behaved very differently from an average quarter, and the current cycle is already inside that regime.
Seasonal window
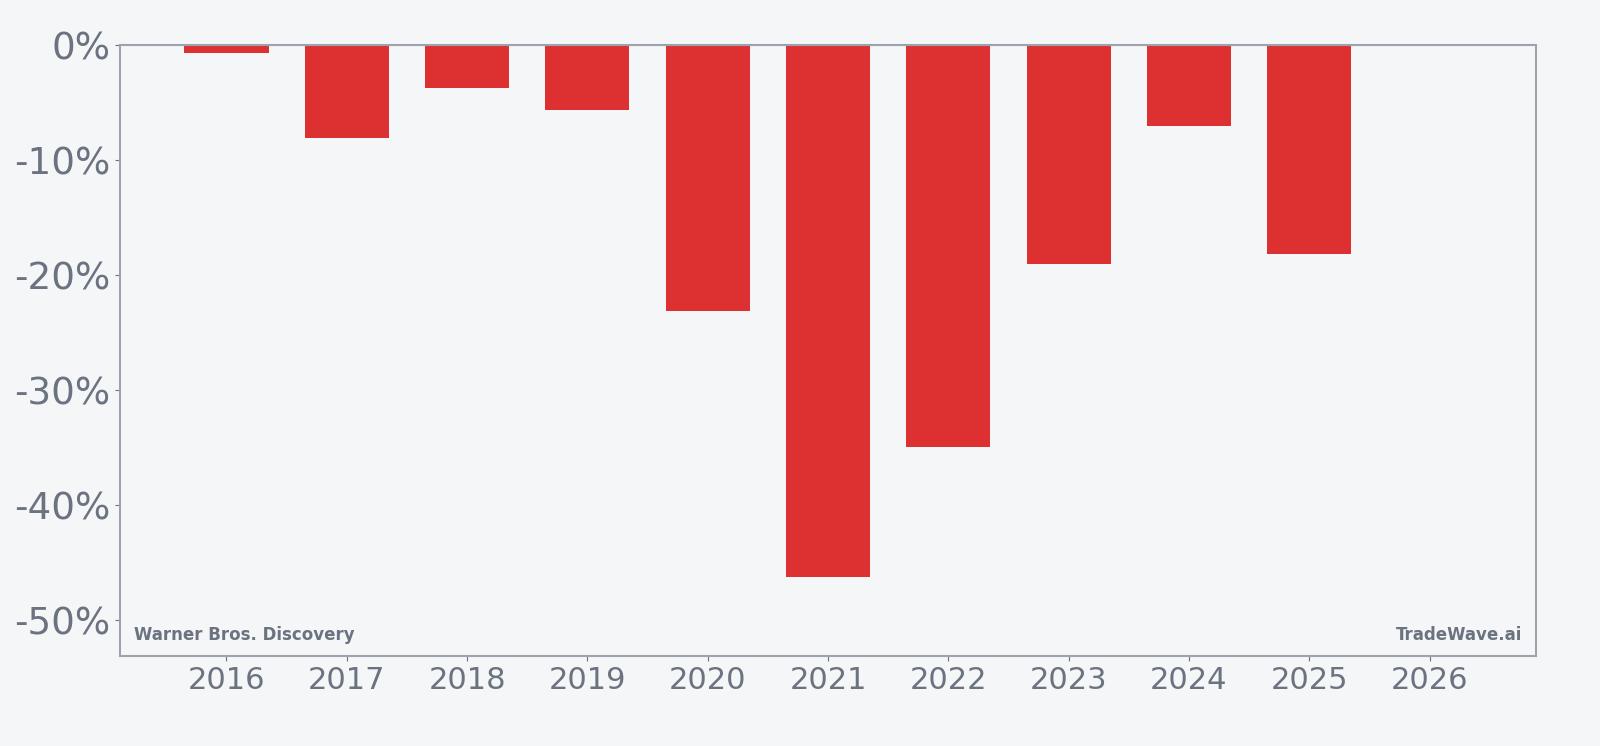
Warner Bros. Discovery has delivered short-side gains in 10 of the last 11 iterations of this 83-day window, with average winning moves of 15.16% and a 15% average outcome across all years. The latest window began on Mar 1 with the stock at 28.50, about 5.0% below its 52-week high of 30.00 and up 3.49% over the past month, so traders are starting from elevated levels rather than a beaten-down base.
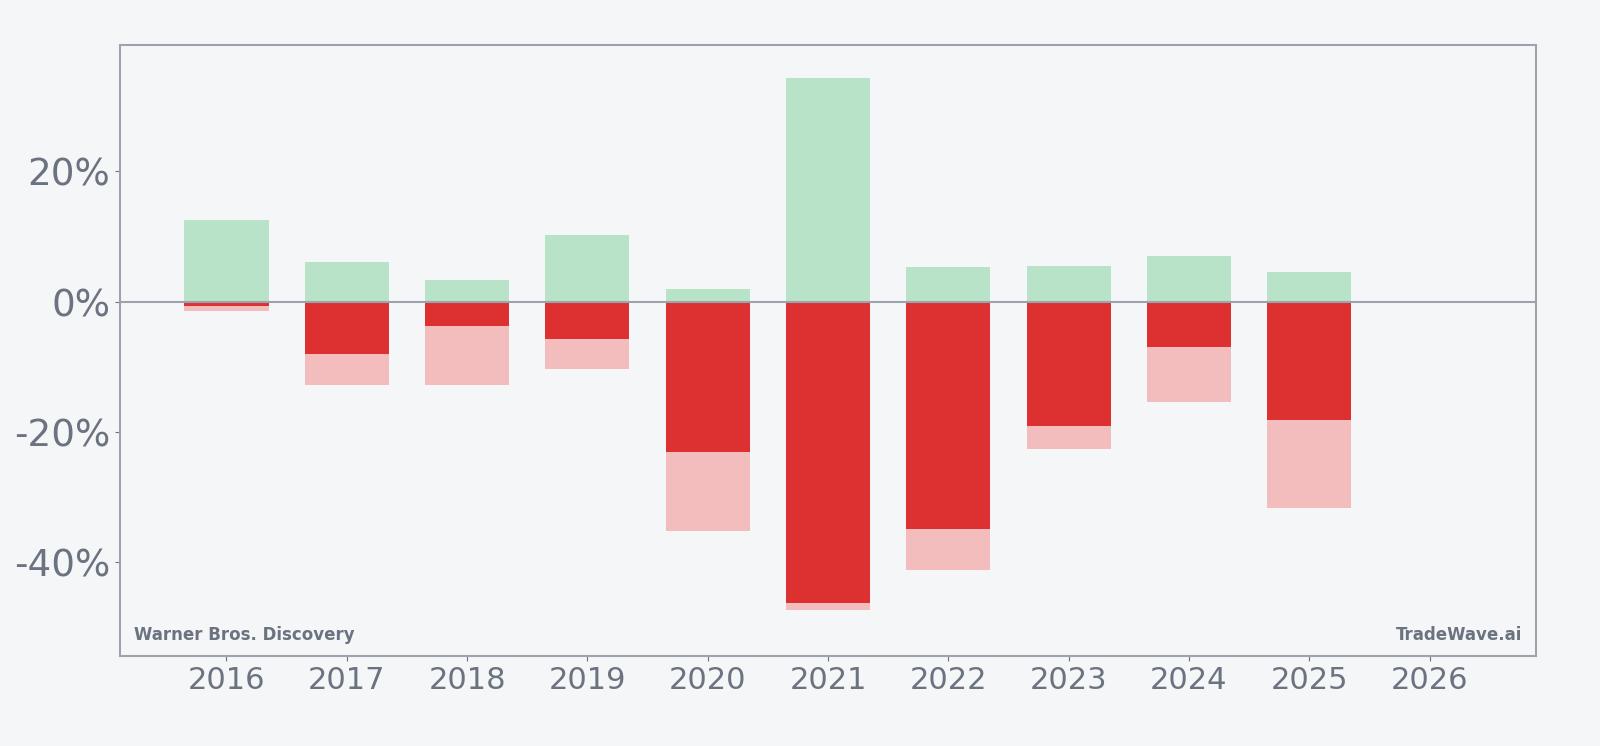
Stacked bars of net return, peak favorable move and worst drawdown show how often this window has delivered deep downside for the stock and how rough the ride has been along the way.
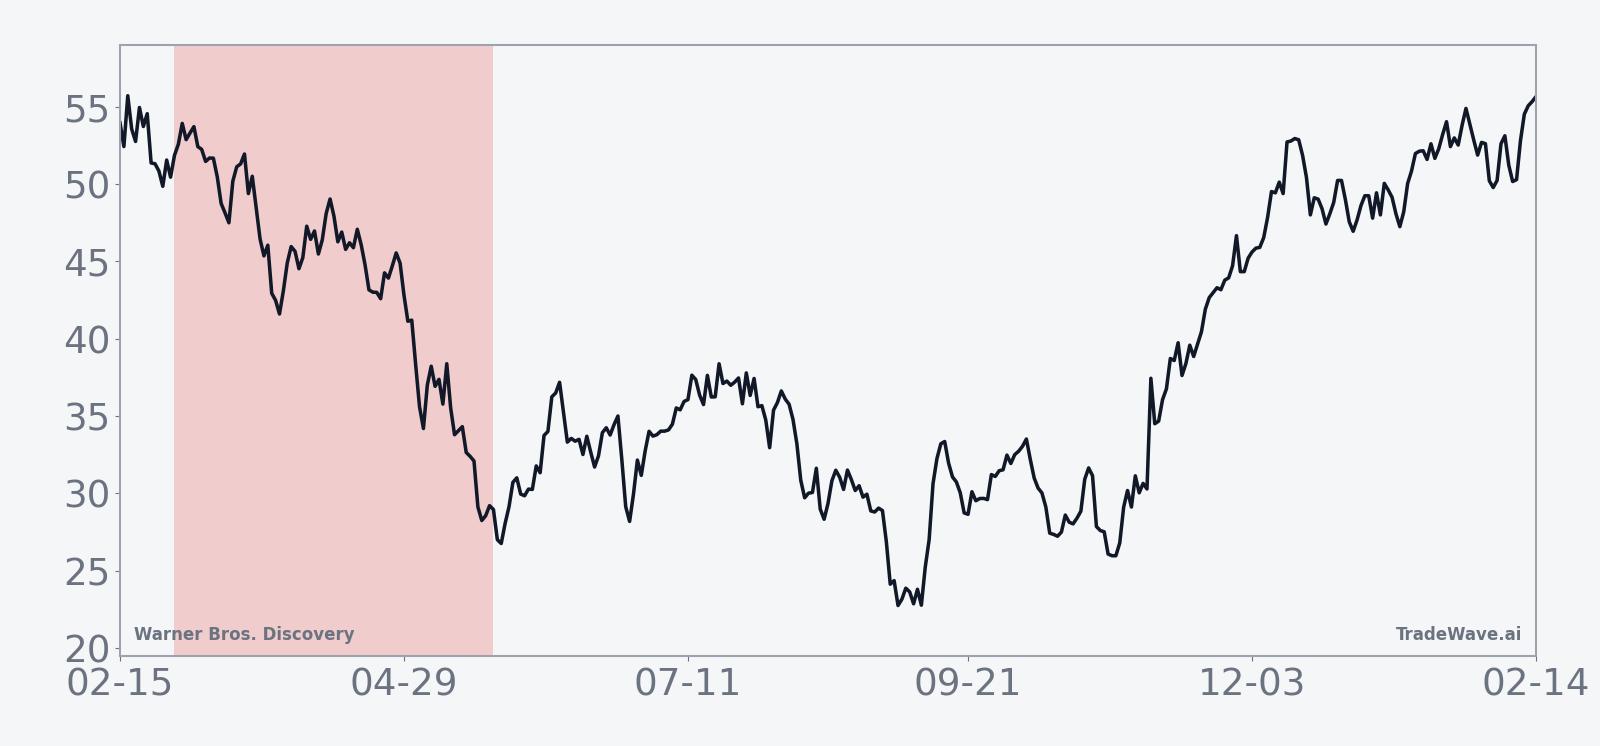
For a short-directed pattern, negative net returns are the “good” years, and this window has delivered a long string of them. The standout example is 2021, when a short entered around 58.18 would have finished the window with a 46.24% gain as the stock slid to 31.28, even after enduring a 34.31% maximum favorable move for longs at one point and a 47.39% worst drawdown for anyone short at the wrong moment. On the other side of the spectrum, 2017 is the lone losing year for shorts in the sample, with an 8.10% net loss and a 12.76% worst adverse excursion, a reminder that even a strong pattern can flip when the tape changes.
The maximum favorable move and maximum adverse move profile is what makes this window stand out. In several years, including 2020, 2021 and 2022, the stock’s worst drawdown from the short entry has pushed beyond 30%, while the best point-to-peak move in favor of shorts has also reached into the double digits. That combination points to a high-variance environment where the direction has usually resolved lower for the stock by the end of the window, but the path has been choppy and often violent.
The ten-year seasonal trend chart shows that, on average, the bulk of the short-side gains have tended to accrue in the middle third of the window rather than immediately after entry. Early days often feature countertrend rallies against the short, followed by a more persistent drift lower into the back half of the period. The cumulative return line slopes steadily in favor of shorts across the full 83 days, which is consistent with the 336% cumulative return figure for the pattern.
Viewed through the lens of the TradeWave Ratio of 1.26, this window has historically seen the stock travel meaningfully in the trade direction relative to typical noise. That is another way of saying that when WBD has broken lower during this stretch, it has often done so with conviction rather than a slow grind. For traders, the message is less about certainty and more about character: this is a period where the stock has tended to trend, not chop, and that trend has usually been down.
History does not guarantee future results; adverse excursions can be large even in winning windows, and this pattern has repeatedly shown that short positions can face sharp squeezes before the seasonal tendency reasserts itself or fails.
Price and near-term drivers
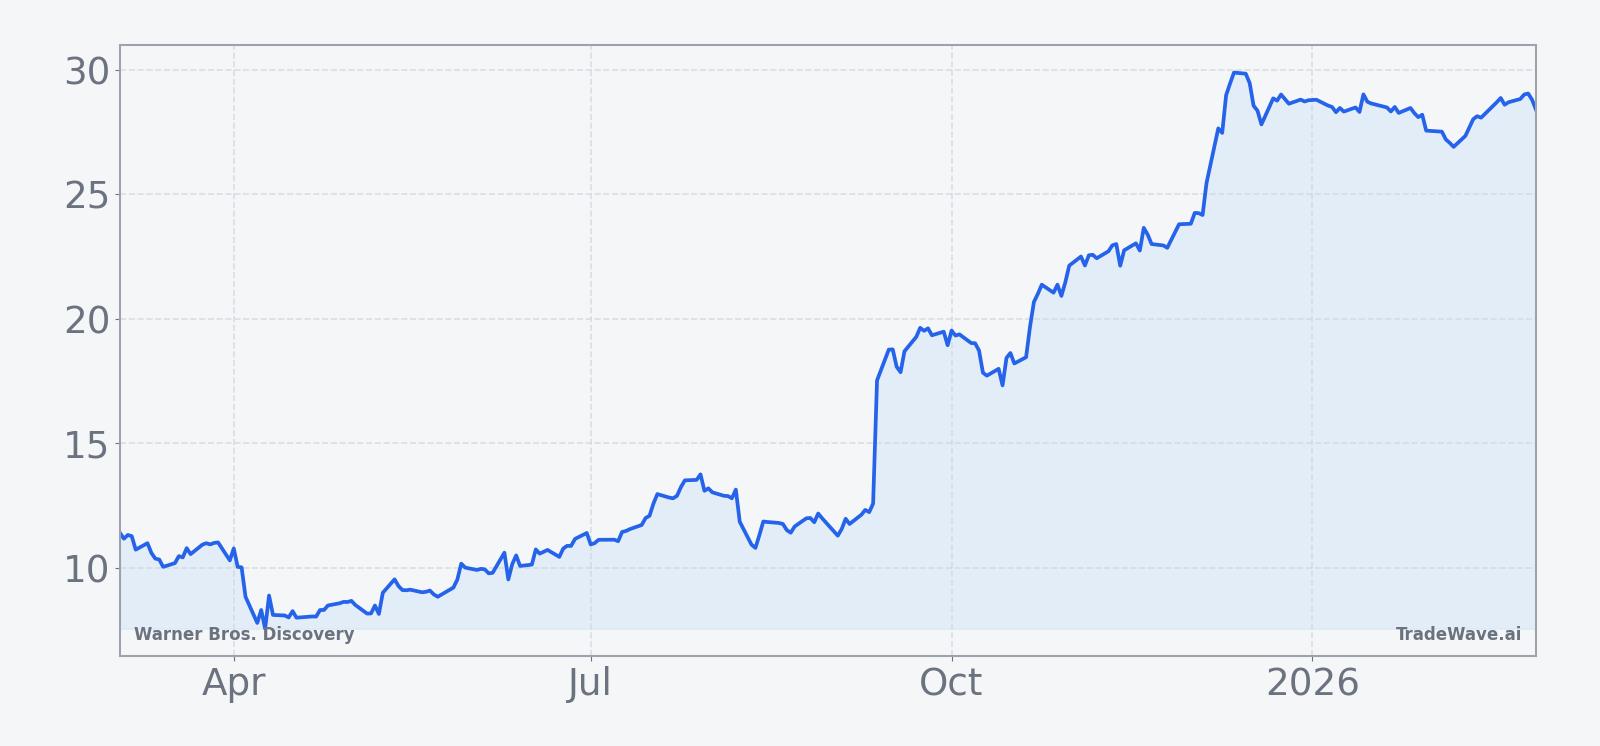
Warner Bros. Discovery closed Monday at 28.50, up 0.33 on the day for a 1.17% gain, after trading between 28.01 and 28.50 on volume of about 33.8 million shares. That leaves the stock roughly 5.0% below its 52-week high of 30.00 and far above its 52-week low of 7.52, with a 3.49% gain over the past month and trading slightly above its 50-day moving average of 28.31 on heavier-than-normal volume versus a 20-day average of about 26.1 million shares.
The fundamental backdrop is anything but quiet. On Feb 26, Reuters reported that Warner Bros. Discovery’s quarterly revenue fell 6% to 9.81 billion dollars, with weakness in traditional TV and film offsetting solid studio performance, while deal talks and strategic options took center stage.[4] The company has been exploring potential transactions, including a possible sale or split, as it tries to navigate cord-cutting, streaming competition and a heavy debt load.[4][12] In January, Seeking Alpha highlighted that Paramount Skydance extended a tender offer for Warner Bros. Discovery, underscoring how the stock has become a live takeover and restructuring story rather than a simple earnings play.[3]
Those strategic discussions sit on top of a mixed earnings record. In Q3 2025, Warner Bros. Discovery posted a loss of 6 cents per share on 9.05 billion dollars in revenue, missing estimates as cable TV declines offset strong studio results.[1] Earlier, in Q2 2025, CNBC reported that the film studios segment delivered a 55% revenue jump to 3.8 billion dollars and boosted adjusted EBITDA to 863 million dollars, helped by box office hits such as “A Minecraft Movie.”[2] Management has guided for at least 2.4 billion dollars in adjusted EBITDA from studios for the full year, with a longer-term goal above 3 billion dollars, effectively betting that content and franchises can carry the load while legacy TV shrinks.[1][2][4]
Sector-wide, the story is similar. Cord-cutting continues to erode cable revenue across media and entertainment, while streaming growth is uneven and capital-intensive.[1] Reuters has detailed how Warner Bros. Discovery is weighing an outright sale and how Netflix has explored bids for parts of the business, moves that could reshape the competitive landscape if they materialize.[12][13] For equity traders, that mix of structural headwinds, potential M&A and a stock trading near the top of its one-year range creates a setup where any surprise in deal headlines or earnings can trigger outsized moves in either direction.
The chart below situates the latest move in its recent multi-month context.
What to watch in this window
For the current 83-day stretch, the key test is whether Warner Bros. Discovery behaves anything like its own history. A stock that has usually broken lower during this period is starting from a relatively strong spot on the chart, with price near a 52-week high and above its 50-day moving average. If the seasonal pattern is going to show up again, traders would expect to see failed rallies toward the 30 level, heavier selling on bad news and a tendency for intraday bounces to fade rather than stick.
Earnings timing is less of a near-term driver than usual, since the next formal report date has not yet been set, but the company’s guidance around studio EBITDA and any updates on streaming profitability will still matter when they arrive.[1][2][4] In the meantime, deal headlines are likely to dominate. Watch for concrete developments around the Paramount Skydance tender offer, any renewed chatter about a full sale, and whether Netflix or other bidders re-emerge for specific assets.[3][12][13] A firm bid or a credible breakup plan could overwhelm seasonal tendencies, while stalled talks or a pulled offer could leave the stock more exposed to the historical downside bias.
On the tape, the levels to watch are straightforward. The 30.00 area is the obvious resistance line given its status as the 52-week high, while the 50-day moving average near 28.31 is the first support marker for bulls trying to defend the recent uptrend. A decisive break below that moving average on rising volume would look more like prior years in this window, when weakness tended to build as the days wore on. Conversely, a sustained push to new highs with shallow pullbacks would be a clear sign that this cycle is diverging from the pattern.
Add it up: a stock in play for strategic change, trading near the top of its range, has entered a calendar stretch that has historically favored shorts with large, volatile moves. Whether that history repeats or not, anyone trading Warner Bros. Discovery over the next few months should be prepared for a bumpier ride than a typical quarter and keep one eye on both the headlines and the calendar.
Sources
- [1] Reuters, "Warner Bros Discovery posts bigger-than-expected loss ahead of potential sale or split," Nov 6, 2025.
- [2] CNBC, "Warner Bros. Discovery film studios lift second-quarter results," Aug 7, 2025.
- [3] Seeking Alpha, "Paramount Skydance to extend Warner Bros. tender offer - report," Jan 21, 2026.
- [4] Reuters, "Warner Bros posts 6% fall in quarterly revenue, deal talks in focus," Feb 26, 2026.
- [12] Reuters, "Warner Bros Discovery ponders outright sale," Oct 21, 2025.
- [13] Reuters, "Exclusive: Netflix taps bank to explore bid for Warner Bros Discovery," Oct 30, 2025.