S&P 500 SPDR (SPY) Has Rallied in 10 of 10 Years in This 166-Day Seasonal Window
S&P 500 SPDR is trading well below its 52-week high just as a 166-day stretch that has never been negative in the past decade comes back into focus for investors balancing flows, macro risk and seasonality.

Key takeaways
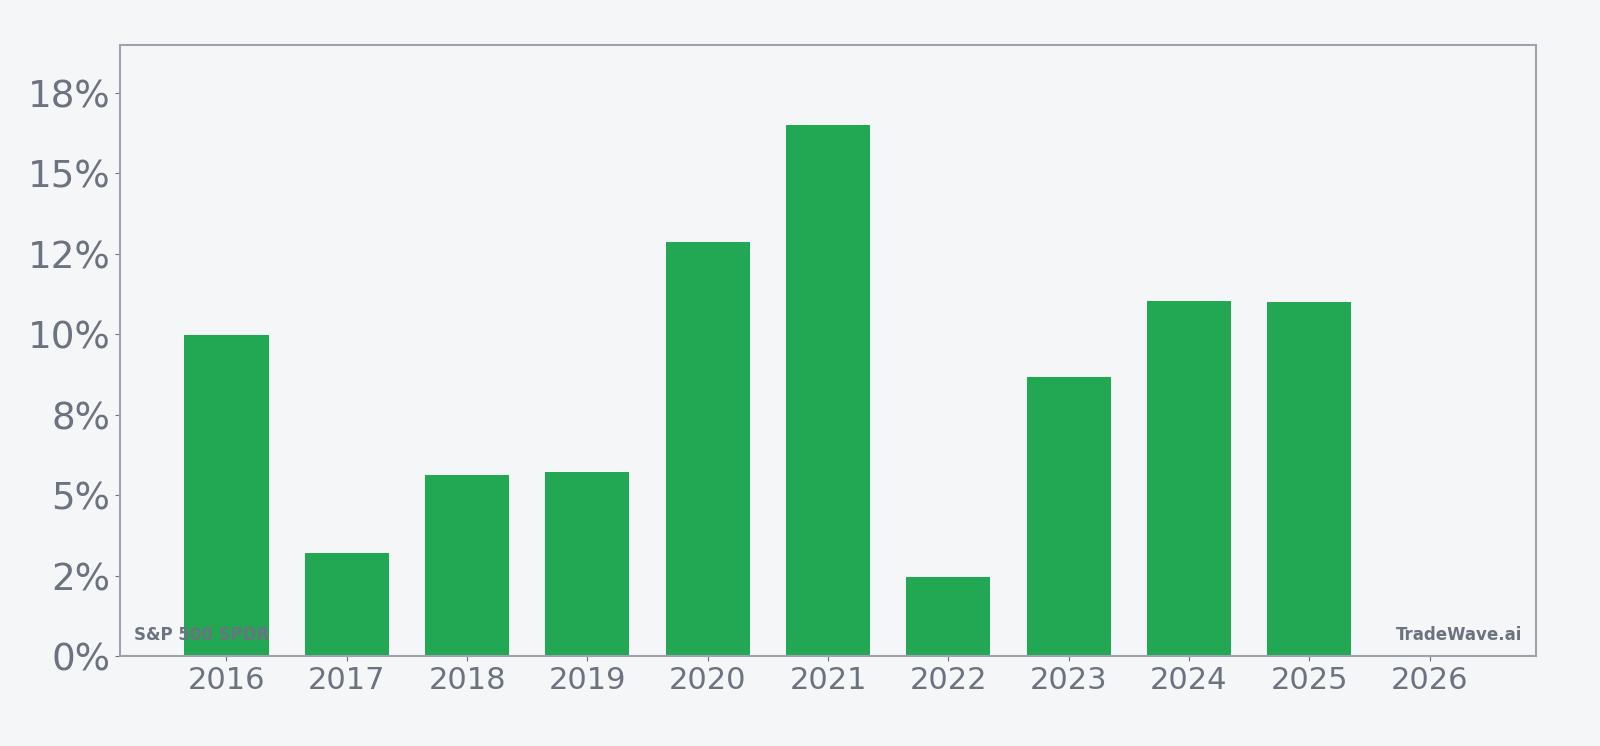
- S&P 500 SPDR has posted gains in this 166-day window in 10 of 10 years, a 100% win rate for a long bias.
- The window starts on Mar 5 and runs roughly through late August, with average gains of 8.71% across the decade.
- All 10 years were winners, but intraperiod drawdowns have been meaningful, including a worst adverse move of -27.41% in 2020.
- The TradeWave Ratio of 2.59 points to sizable trend travel in the trade direction within the window, while a Sharpe ratio of 1.55 signals strong risk-adjusted results.
- SPY trades about 7.6% below its 52-week high, leaving room for upside if the pattern repeats, but macro risks from recession signals and geopolitics remain in play.[1][2][3]
According to historical data from TradeWave.ai, this part of the calendar has behaved very differently from an average six-month stretch for the S&P 500 SPDR. The next section walks through how that pattern has played out over the past decade and what it means for the current cycle.
Seasonal window
S&P 500 SPDR has risen in 10 of 10 years during this 166-day window, averaging 8.71% gains for a long bias. The latest iteration began on Mar 5 with SPY around 645, roughly 7.6% below its 52-week high of 697.84 and well above its 52-week low near 473.50.[1]

The historical seasonal average shows SPY tending to grind higher through much of the window, with gains building gradually rather than in a single burst. Trend metrics tilt modestly long, with the pattern spending about 60% of the time in an upswing and 40% in shorter countertrend phases, which fits a stair-step advance rather than a straight line.
Year-by-year net returns and intraperiod swings fill in how much upside and downside traders have had to sit through.
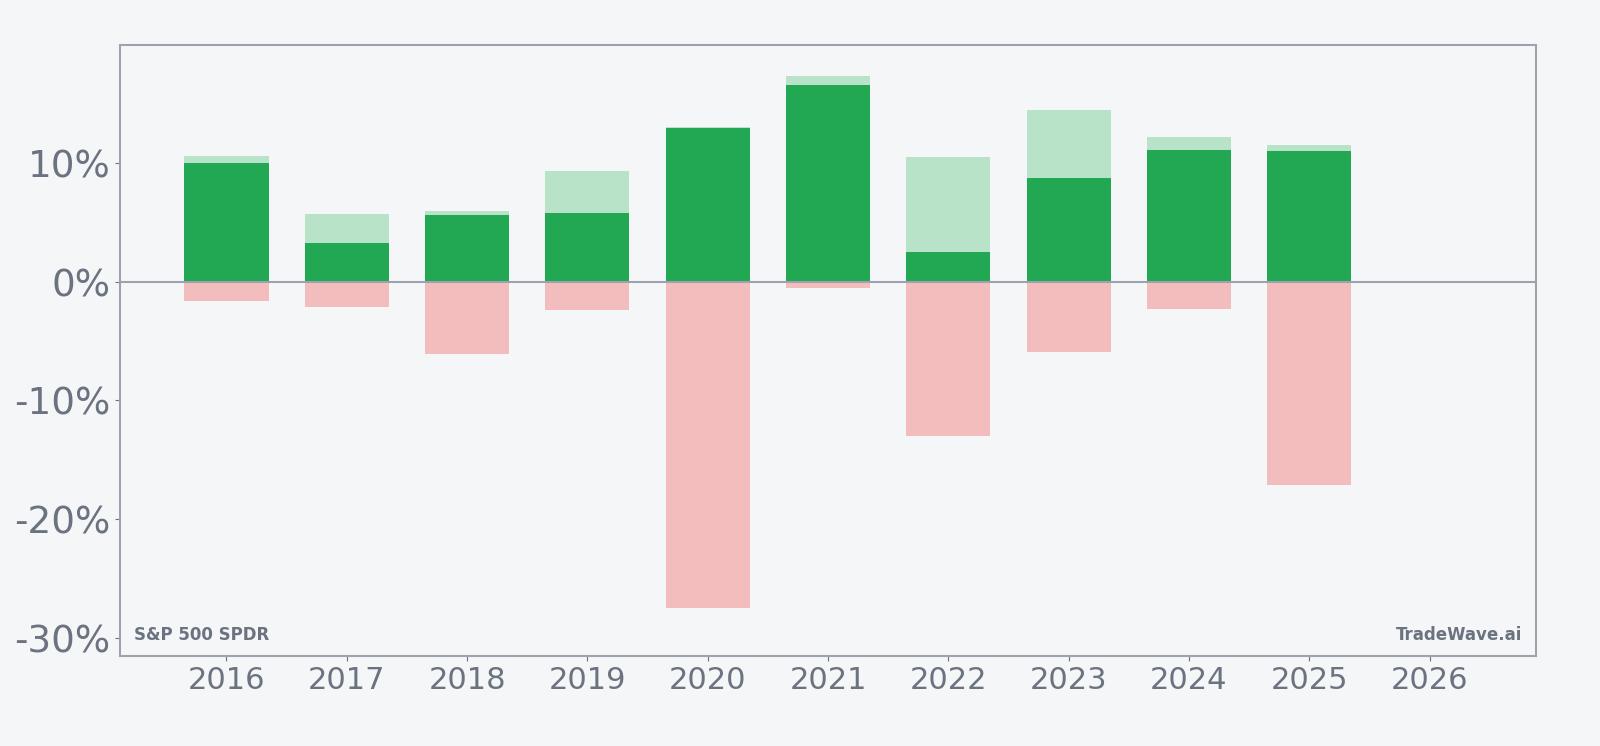
Across the decade, every single year finished positive in this window, but the ride has not been smooth. The strongest net gain came in 2021, when SPY added 16.51% with a peak run-up of 17.31% and only a shallow worst drawdown of -0.58%. At the other end of the spectrum, 2017 delivered a modest 3.21% net gain, while 2020 and 2025 combined double-digit final returns of 12.87% and 10.99% with deep adverse moves of -27.41% and -17.12% along the way, showing how quickly volatility can bite even in winning years.
The maximum favorable excursions in most years sit in the low double digits, which lines up with the 8.71% average profit and a TradeWave Ratio of 2.59 that signals meaningful travel in the trade direction inside the window. At the same time, the maximum adverse excursions range from mild pullbacks of around -1.6% in 2016 to that -27.41% shock in 2020, underscoring that macro shocks can overwhelm even a strong seasonal tailwind. The Sharpe ratio of 1.55 on end-of-window outcomes reflects how consistently those gains have outweighed the volatility when measured from entry to exit.
Put together, the pattern is unusually clean for a broad-market ETF: 10 winners, zero losers, and a triple-digit cumulative gain of 128% across the decade. The catch is that several of those wins required investors to tolerate double-digit drawdowns inside the window before the trend reasserted itself.
History does not guarantee future results; adverse excursions can be large even in winning windows, and traders should size risk with the possibility of deep intraperiod drawdowns in mind.
Price and near-term drivers
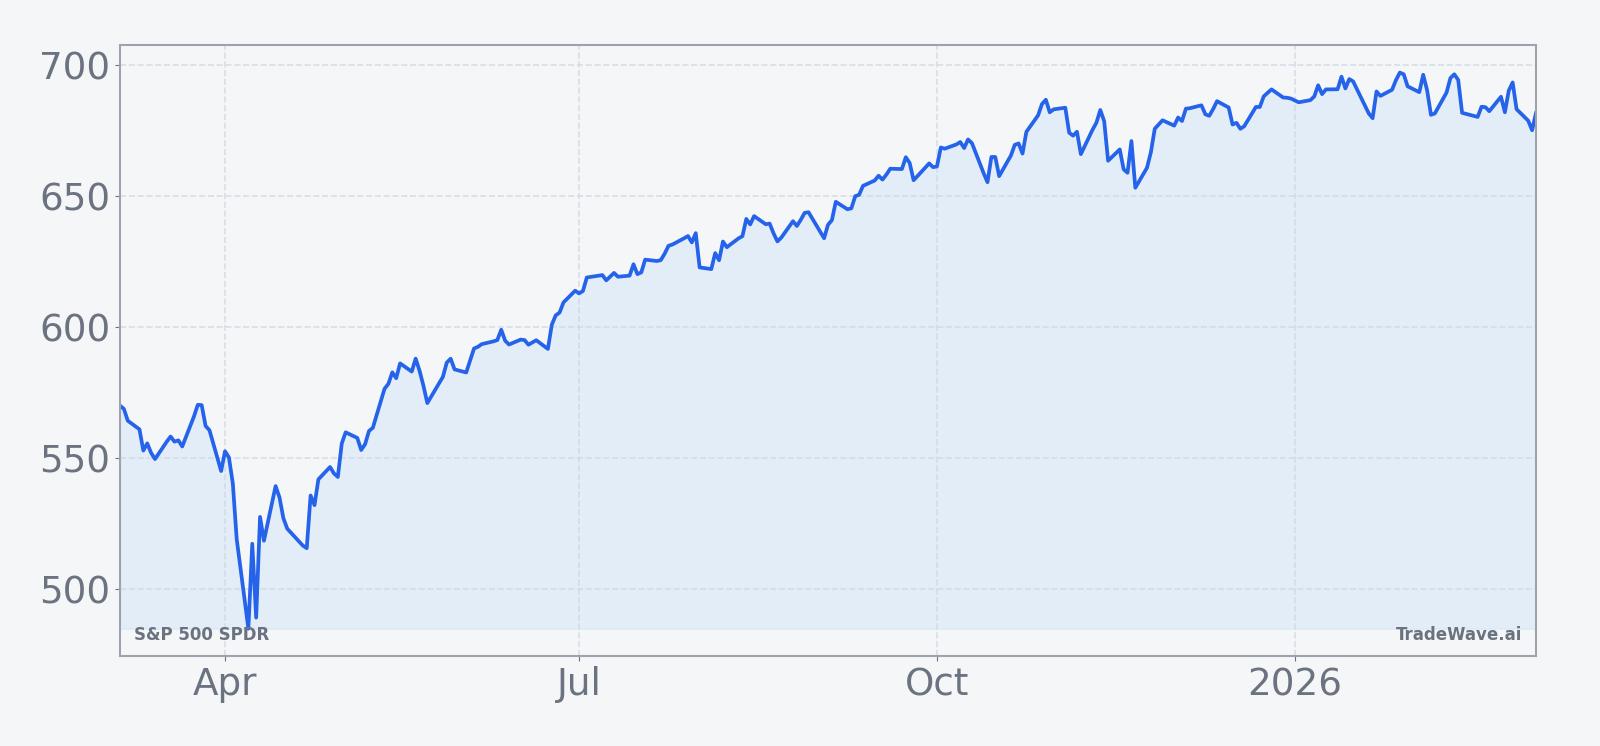
S&P 500 SPDR last traded at 645.31, up 1.54% on the day and sitting about 7.6% below its 52-week high of 697.84, while still well above its 52-week low near 473.50.[1] The ETF’s one-month return of -0.88% and a 50-day moving average around 687.36 show that price has slipped below a key trend gauge, even as the latest bounce hints at dip-buying interest against a backdrop of heavy 20-day average volume near 86 million shares.[1]
Flows data for SPY are not the story this time so much as the macro tape it represents. In 2025, investors navigated a mix of weaker jobs data, tariff threats and rising recession chatter, with some analysts flagging that a softer labor market and falling rates could mark an inflection point for risk assets.[3] By October 2025, commentary around the S&P 500 had shifted toward a clear bullish bias tempered by warnings that elevated valuations and geopolitical risks left the market vulnerable to sharp swings rather than a smooth melt-up.[2]
Those same themes still hang over the new seasonal window. Recession indicators built around layoffs and leading economic indexes pointed to a U.S. downturn in late 2025, even as expectations for Federal Reserve rate cuts supported the idea of a slower, more grinding bull market rather than a runaway rally.[1][2] For SPY holders, that mix of policy support and macro risk maps neatly onto the historical pattern: the ETF has usually found a way to finish this window higher, but several years have featured sharp mid-window air pockets before the uptrend resumed.
The chart below situates the latest move in its recent multi-month context.
Macro backdrop and what SPY actually owns
SPY is the flagship ETF tracking the S&P 500, giving investors a one-ticket way to own large-cap U.S. equities across sectors. That makes its seasonal behavior a proxy not just for one fund but for the entire U.S. stock market’s risk appetite. When SPY rallies, it usually reflects broad strength in megacap tech, financials, industrials and consumer names, and when it stumbles, the pain tends to be market-wide.
Macro narratives around SPY in 2025 revolved around three themes: the path of Fed policy, the risk of recession and the impact of geopolitical and trade shocks.[1][2] Rate cuts were framed as supportive for equities but with more muted upside than earlier cycles, given starting valuations and already-strong prior gains.[1] At the same time, tariff deadlines and currency-market stress signaled that policy missteps could spill quickly into equity volatility, a risk that showed up in several of the deeper intraperiod drawdowns inside the seasonal window in past years.[3]
Because SPY is market-cap weighted, its behavior is heavily influenced by a handful of mega-cap stocks. That concentration can amplify both the upside and the downside inside a seasonal regime. When those leaders are in sync with the historical pattern, the window can deliver smooth gains like 2021’s 16.51% advance. When they are out of step or hit by idiosyncratic shocks, the path can look more like 2020 or 2025, with large swings that still resolve higher by the end of the period.
What to watch in this window
For traders and long-term investors alike, the key question is how SPY behaves relative to its own history as this 166-day stretch unfolds. The first checkpoint is whether the ETF can reclaim and hold its 50-day moving average near 687 in the early part of the window, which would align price action with the long-biased seasonal tendency.[1] A sustained move back toward the 52-week high around 698 would fit the historical script of mid-year strength, while a deeper slide toward the low-600s or below would echo the more volatile years in the sample.
Macro catalysts will likely decide which path SPY takes. Watch upcoming data on jobs and growth for confirmation or rejection of the late-2025 recession signals, along with any fresh headlines on tariffs or geopolitical flashpoints that could trigger the kind of sharp adverse excursions seen in 2020 and 2025.[1][3] If those shocks stay contained and Fed policy remains supportive, the historical pattern suggests the market has room to grind higher over the next several months, even if the ride is choppy.
Finally, monitor flows and leadership inside the index. Persistent buying in SPY and strength in its largest constituents would reinforce the long-biased seasonal backdrop. On the other hand, heavy outflows from broad equity ETFs or a breakdown in megacap leaders would be an early sign that this could be one of the more volatile iterations of an otherwise strong window. The history is clear: this stretch has favored the bulls for a decade, but the path to those gains has often run straight through pockets of discomfort.