Newmont (NEM) Holds Full-Year Guidance, Unveils $3 Billion Share Buyback on Gold Strength
Newmont is nearing a spring stretch that has delivered consistent gains in the past, even as the stock trades lower and insider selling underscores the need to balance upside potential with risk.

Key takeaways
- Newmont’s upcoming 40-day window starting Mar 4 has historically been a strong period for the stock, with a long trade direction.
- Across the past 10 years, this window was profitable in 100% of cases, with 10 winners and 0 losers.
- Average profit in winning years was 13.16%, with a 238% cumulative gain over the sample.
- The TradeWave Ratio of 2.07 indicates that price has typically traveled meaningfully in the long direction within the window.
- Historical best-case moves have been sizable, but adverse excursions within the window have at times been sharp, particularly in 2020.
- Today’s pullback and a pattern of insider selling mean traders will be weighing this bullish seasonal backdrop against governance and positioning risks.
According to historical data from TradeWave.ai, this late-winter stretch has shown a distinct pattern for Newmont that stands out from the rest of the year. The following section looks at how that pattern has behaved over the past decade and how it frames the upcoming 40-day window.
Seasonal window
This seasonal window begins on Mar 4, 2026 and spans 40 trading days, and it has historically been a strong stretch for Newmont with a clear long bias. Newmont last closed at $122.13, down 2.6% on the day, leaving traders to weigh a soft tape against a period that has often delivered double-digit gains in prior years.
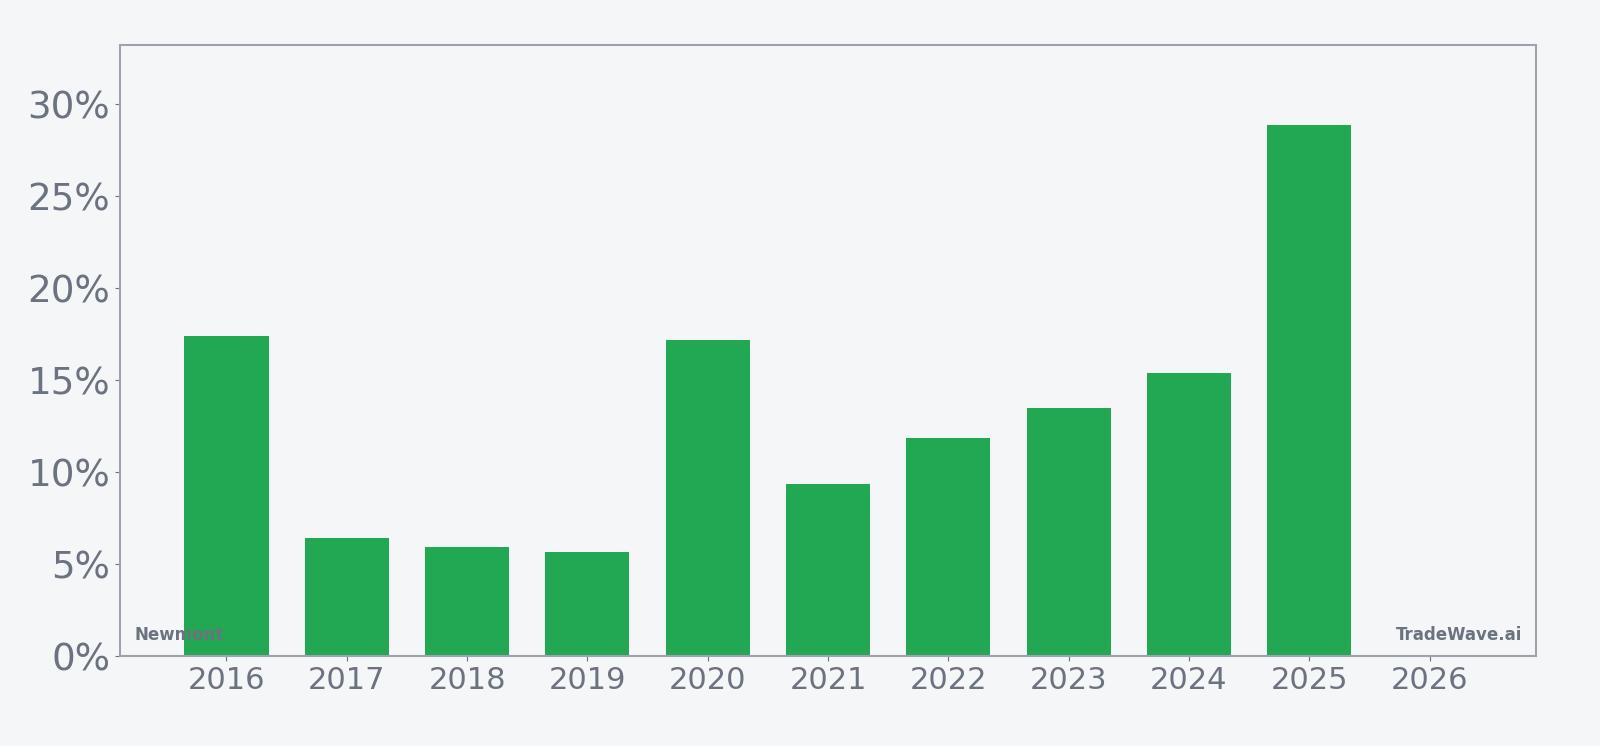
Across the past 10 years, every instance of this 40-day window finished higher, with Newmont posting a 100% profitable record and an average gain of 13.16%. The median outcome of 12.67% and a 238% cumulative return over the sample underline how consistently the pattern has leaned in favor of the long side.
The strongest year in the sample was 2025, when Newmont rose 28.89% between the entry and exit dates, while the softest outcome was 2019, which still delivered a 5.65% net gain over the window. In 2020, the stock advanced 17.2% over the period, but that year also featured the deepest intraperiod drawdown, highlighting that even winning windows can involve significant volatility.
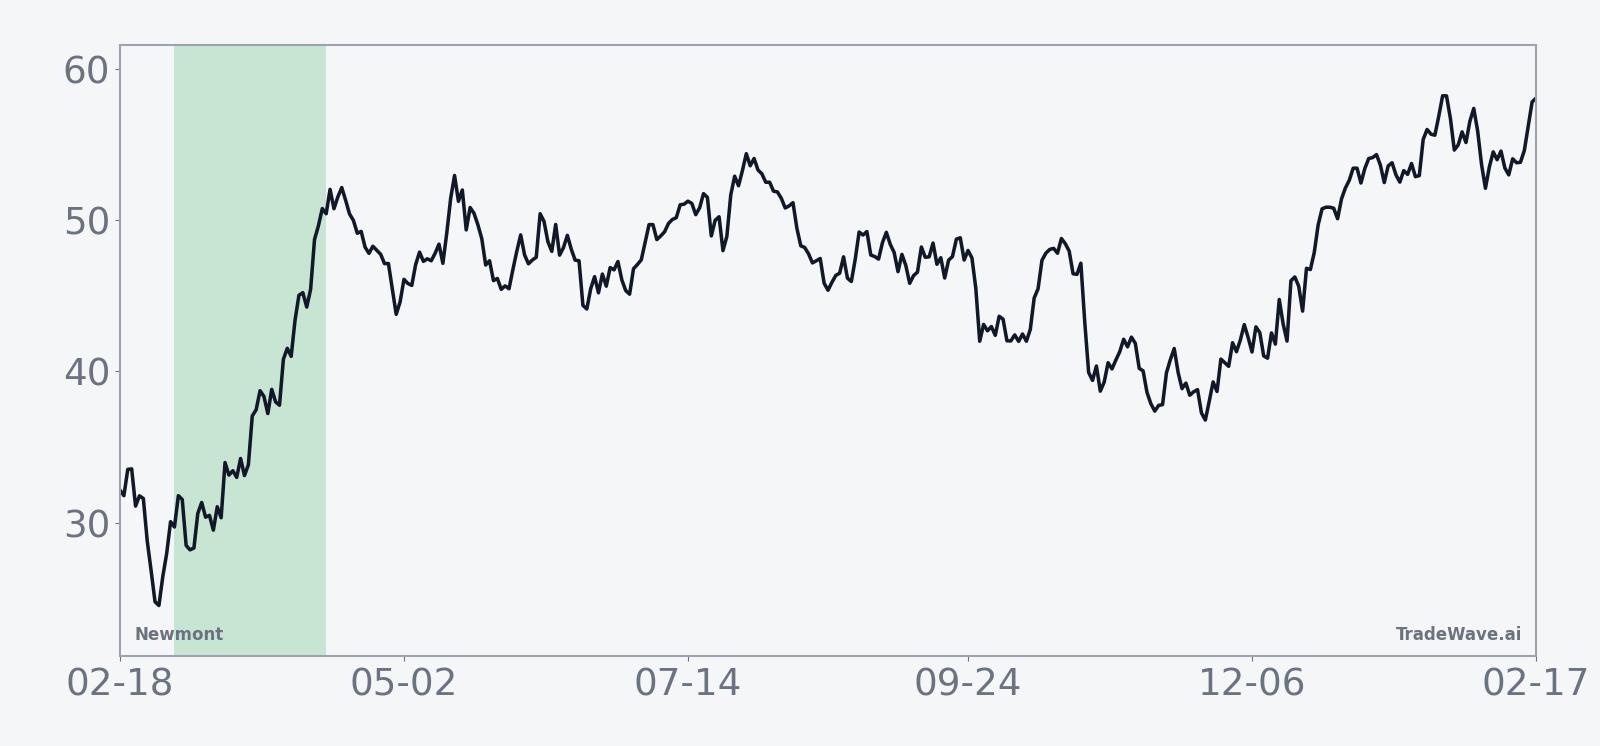
The historical seasonal trend chart suggests that gains in this window have tended to build steadily rather than arriving in a single burst, with the average path grinding higher through most of the 40 days. That profile points to a pattern where rallies often persist across the window, even if individual years show different day-to-day paths.
A combined view of net returns and intraperiod swings shows how upside and downside have interacted in each year.
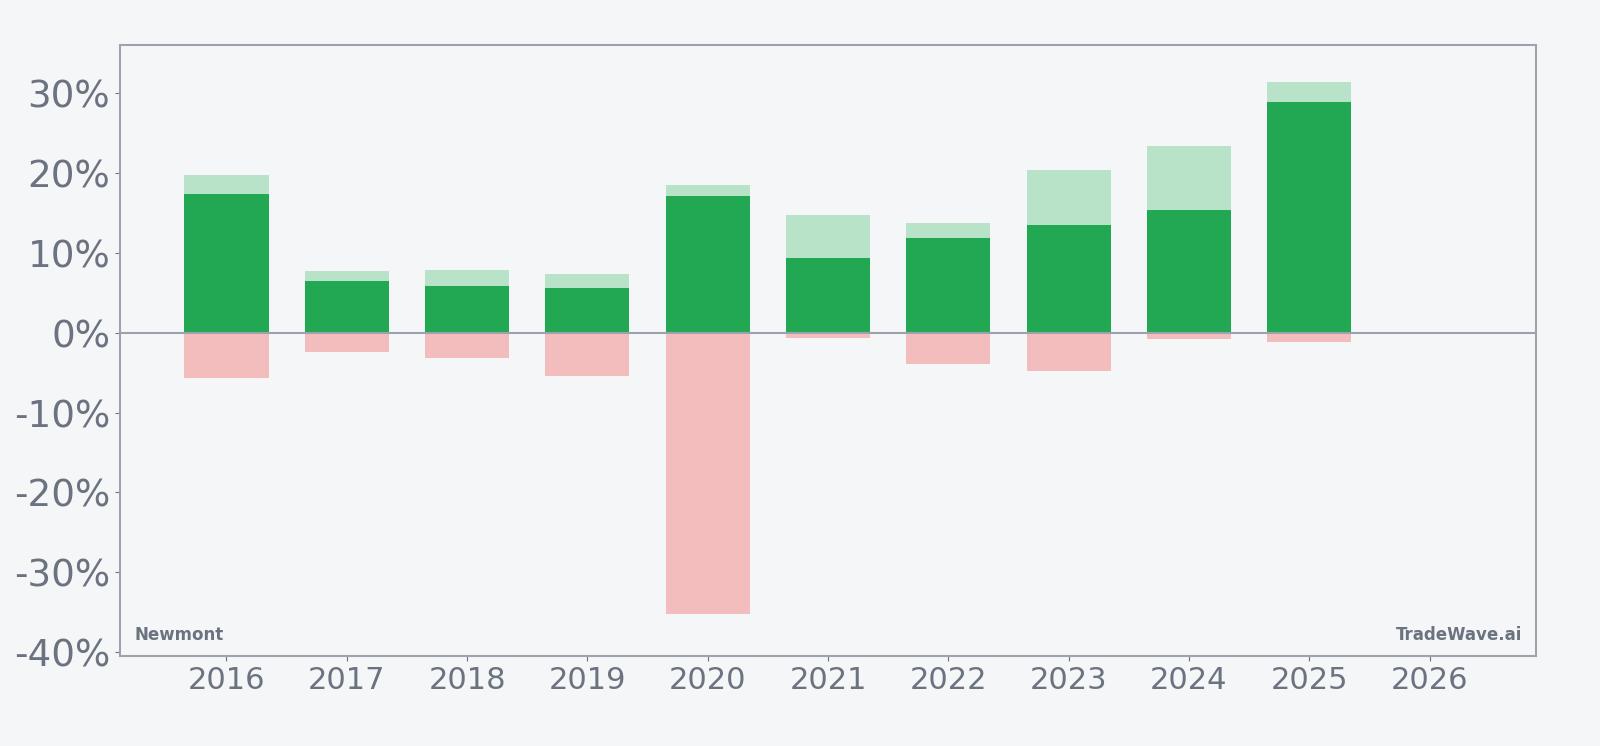
The bar chart combining net results with peak favorable and worst adverse moves shows that in strong years such as 2024 and 2025, Newmont’s maximum favorable excursion reached above 20% while the worst intraperiod pullbacks stayed relatively contained, whereas 2020 stands out with a deep adverse move of about -35.29% before finishing higher. That mix of sizable upside potential and occasional sharp drawdowns is reflected in the TradeWave Ratio of 2.07 and a Sharpe ratio of 1.79, indicating historically attractive risk-adjusted returns but not a smooth ride in every instance.
History does not guarantee future results; adverse excursions (MAE) can be large even in winning windows.
Taken together, the historical pattern defines the quantitative seasonal backdrop for the upcoming period.
Price and near-term drivers
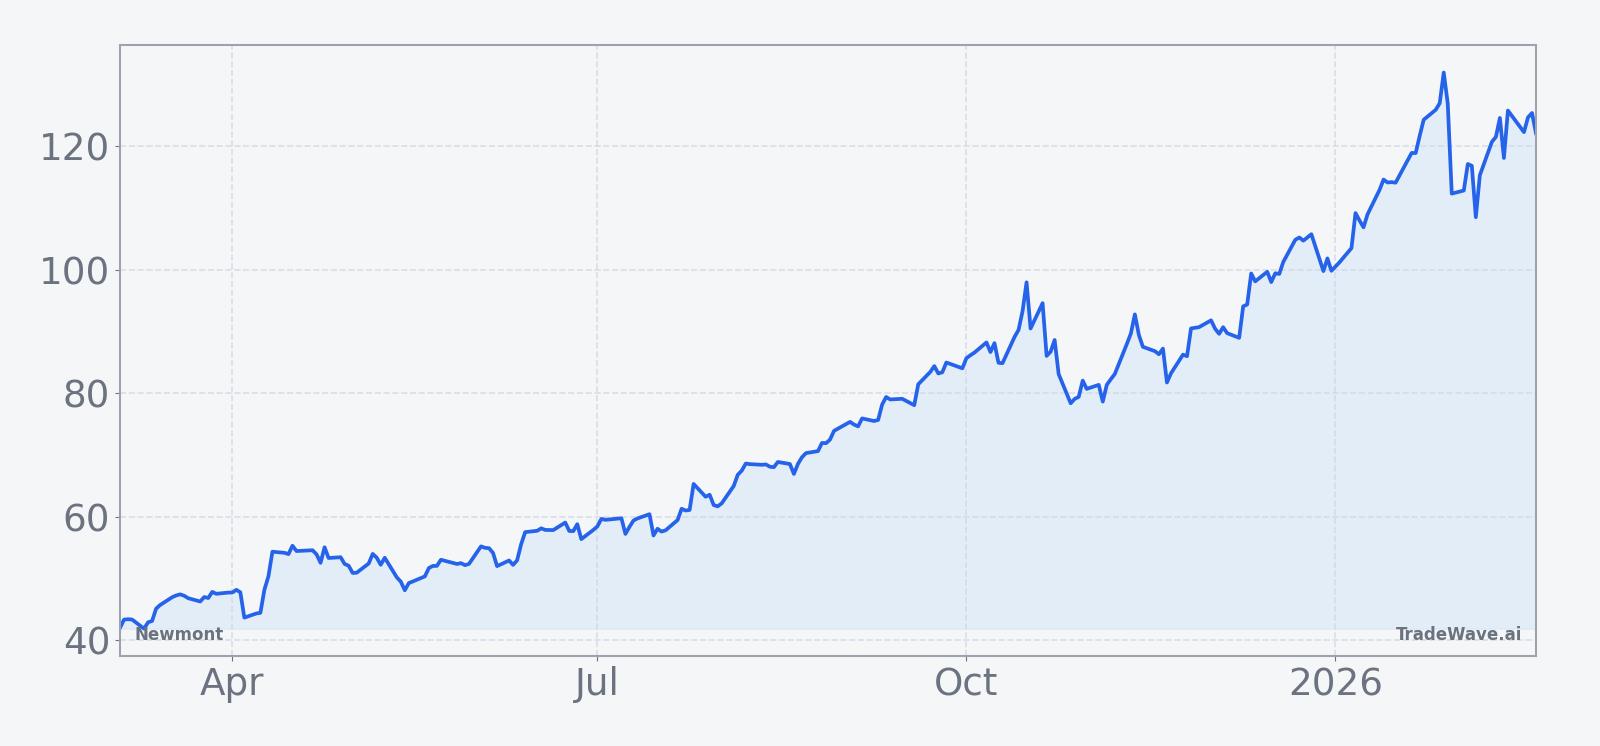
Newmont shares last changed hands at $122.13, down 2.6% on the day, as the stock continues to trade without a clear reference to its 52-week extremes or year-to-date performance in the available data. The move comes against a backdrop where gold prices have been supported by geopolitical tensions and tariff uncertainty, factors that have historically bolstered profitability for major miners.
In July 2025, Newmont reported second-quarter adjusted earnings per share of $1.43, topping an estimated $1.18 as a rally in bullion prices lifted margins and pushed the stock higher in extended trading.[3] The company kept its annual outlook unchanged at that time and announced a $3 billion share repurchase program, signaling confidence in its balance sheet and cash generation capacity.[3]
Sector data from August 2025 showed Newmont operating with gross margins of 44.9% and net margins of 30.5%, levels that compared favorably with industry medians and underscored its position as one of the more profitable names in global metals and mining.[2] That profitability profile has helped the stock act as a leveraged play on gold prices, with earnings and cash flow sensitive to moves in the underlying commodity.
Analyst coverage compiled in mid-2025 reflected an “Outperform” consensus rating on Newmont, with a consensus price target of $71.67 from GuruFocus at that time.[1] While that target sits well below the current share price, the historical snapshot highlights how analyst frameworks have had to adjust to both higher bullion prices and corporate actions such as buybacks and portfolio reshaping.
Insider activity has been another consideration for governance-focused investors. In December 2025, director Bruce Brook sold 2,080 shares of Newmont, leaving him with 32,709 shares, and data over the prior year showed 0 insider buys against 25 insider sells.[4] That pattern does not speak directly to near-term performance, but it adds a note of caution for traders weighing a historically bullish seasonal window against signals from the boardroom.
The chart below situates the latest move in its recent multi-month context.
Earnings backdrop
Newmont’s most recent detailed earnings snapshot in the available record is the second quarter of 2025, when the company beat profit expectations on the back of stronger bullion prices and operational leverage.[3] Management chose to keep full-year guidance unchanged while layering in a sizable share repurchase authorization, a combination that suggested confidence in the existing plan rather than a shift in strategy.
The next earnings date is not specified in the current dataset, but the company’s cadence typically keeps investors focused on how realized gold prices, cost inflation and project execution feed through to margins. With the upcoming seasonal window historically favoring the long side, traders will be watching whether any future earnings releases fall inside that 40-day span and whether they reinforce or challenge the pattern.
Macro and sector context
Newmont’s fortunes remain closely tied to the macro environment for gold. In July 2025, uncertainty over U.S. tariffs and geopolitical concerns helped push bullion prices to record highs, a backdrop that directly supported the company’s earnings beat and underscored its leverage to safe-haven flows.[3] That dynamic can cut both ways, as easing tensions or shifting interest-rate expectations can quickly alter the appeal of gold and, by extension, gold miners.
Within the broader metals and mining sector, Newmont has stood out for its margin profile, with gross and net margins that exceeded industry medians in mid-2025.[2] Those metrics give the company more room to absorb cost pressures or grade variability than many smaller peers, but they also mean that investors often demand disciplined capital allocation and consistent returns on invested capital.
Valuation and positioning
Valuation markers such as forward earnings multiples and dividend yield are not detailed in the current dataset, but the GuruFocus snapshot from mid-2025 framed Newmont as an “Outperform” name with a defined upside case at lower price levels.[1] Since then, the stock has moved substantially, and the combination of a higher share price, strong margins and a large buyback authorization has likely reshaped how investors think about risk and reward.
Positioning signals are mixed. The pattern of insider selling over the 12 months through December 2025 may temper enthusiasm for some investors, even as the historical seasonal window points to a period that has repeatedly rewarded long exposure.[4] How those forces resolve could determine whether the upcoming 40-day stretch follows the established pattern or diverges from it.
What to watch as the window approaches
As the Mar 4 start date nears, traders will be watching several markers to gauge whether Newmont is tracking its historical seasonal script. One focus will be the behavior of gold prices and macro headlines around tariffs and geopolitical risk, given their outsized influence on the company’s earnings power.[3] Sustained strength in bullion would align with the long-biased seasonal pattern, while a sharp reversal could test it.
Price action around key technical levels on the daily chart will also matter, particularly whether Newmont can stabilize after the latest pullback and build a base heading into the window. A pattern of higher lows and improving volume would be more consistent with prior strong years in the sample, whereas continued choppiness or heavy selling could signal a tougher backdrop even if the historical statistics remain favorable.
Insider activity is another variable to monitor. The earlier stretch of 0 insider buys and 25 insider sells culminating in the December 2025 sale by director Bruce Brook highlighted a cautious tone from those closest to the company’s operations.[4] A shift toward more balanced or supportive insider behavior would sit more comfortably alongside a bullish seasonal window, while continued net selling could reinforce governance and sentiment concerns.
Finally, any upcoming earnings or operational updates that fall inside or just ahead of the 40-day span could act as catalysts that either amplify or blunt the historical pattern. Traders will be looking to see whether Newmont’s execution, capital allocation and exposure to gold prices continue to support the kind of outcomes that have defined this window over the past decade, or whether 2026 marks a departure from that playbook.
Sources
- [1] GuruFocus, “Newmont (NEM) Surpasses Q2 Profit Expectations on Bullion Gains”, Jul 27, 2025.
- [2] GuruFocus, “Newmont (NEM) Sells Entire Stake in Orosur Mining for $5.55M”, Aug 1, 2025.
- [3] Reuters, “Gold miner Newmont's quarterly profit beats estimates as bullion rallies”, Jul 24, 2025.
- [4] GuruFocus, “Insider Sell: Bruce Brook Sells Shares of Newmont Corp (NEM)”, Dec 4, 2025.