Stronger Medicare Payments and Sector Rotation Drive Flows Into S&P 500 Healthcare Sector SPDR (XLV)
S&P 500 Healthcare Sector SPDR is heading toward a 49-day seasonal stretch that has delivered both strong rallies and notable drawdowns in past years, giving healthcare investors a nuanced backdrop as 2026 policy and growth debates unfold.

Key takeaways
- A 49-day seasonal window for S&P 500 Healthcare Sector SPDR begins on Mar 18, based on six years of history.
- The pattern is aligned with a long trade direction, with 50% of years profitable across 3 winners and 3 losers.
- Winning years have shown an Avg Profit of 10.82%, while Avg Profit - All, including losing years, is 3%.
- Individual years have ranged from a gain of 19.55% in 2020 to a loss of 5.56% in 2025, underscoring variability.
- Maximum favorable moves have at times exceeded 20%, but adverse excursions have reached double digits in weaker years.
- The mixed record suggests a constructive but not one-sided seasonal backdrop for healthcare exposure in early spring.
According to historical data from TradeWave.ai, the coming weeks line up with a distinct seasonal pattern for XLV that has alternated between strong advances and meaningful setbacks in prior years.
Seasonal window
This seasonal window begins on Mar 18, 2026 and spans 49 trading days. Historically, during this period, S&P 500 Healthcare Sector SPDR has shown a constructive but uneven tendency, with some years delivering strong gains and others posting notable losses. With current price and 52-week context unavailable, investors are approaching this window without a clear technical reference point, which puts more weight on understanding how the ETF has behaved in this stretch before.
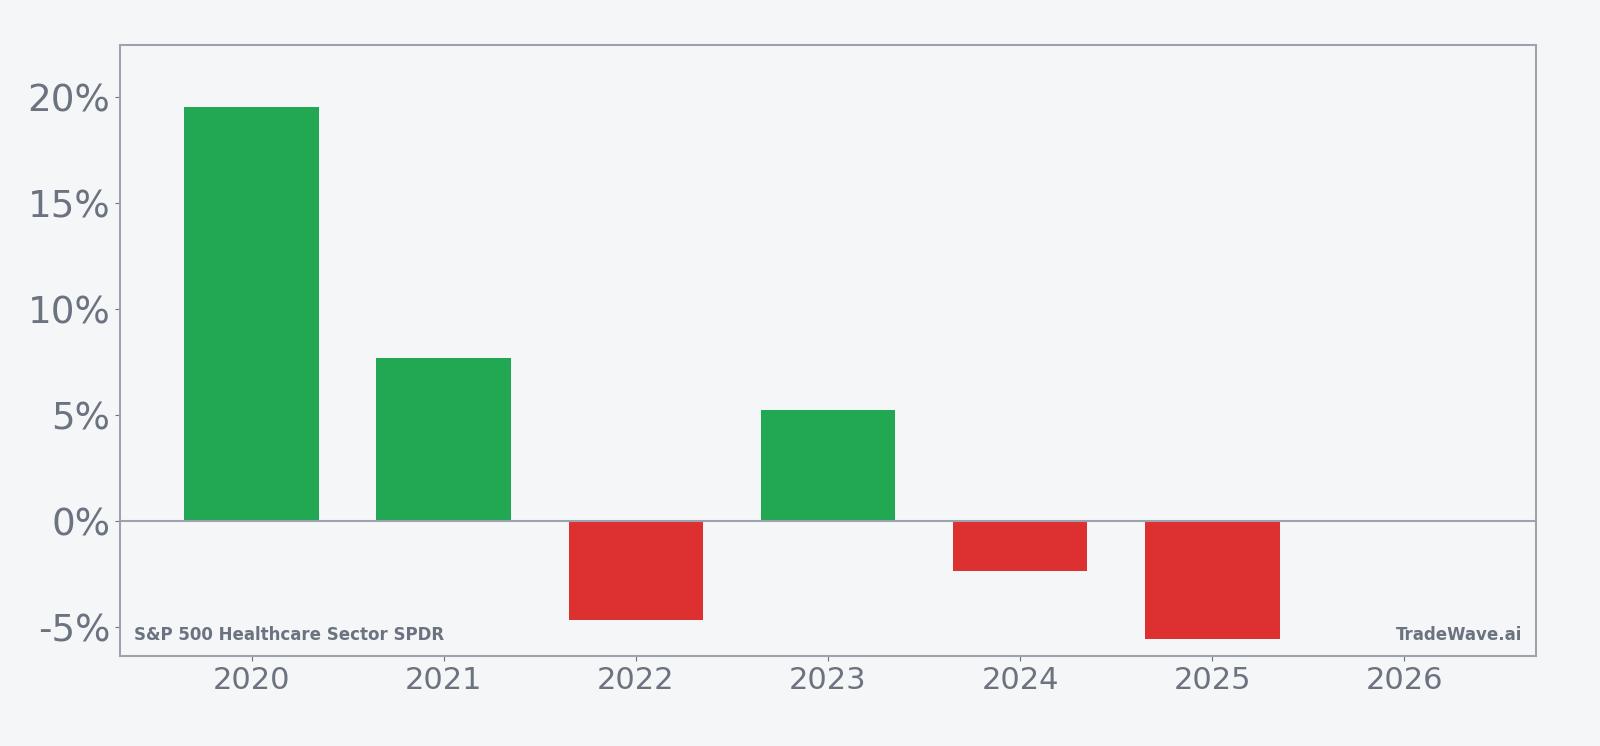
Across the six-year sample, the long trade direction has produced three winning years and three losing years, so the Percent Profitable of 50% reflects a genuinely mixed record rather than a one-sided edge. Average gains in the winning years are sizable at 10.82%, but when the three losing years are included, Avg Profit - All drops to 3%, which highlights how setbacks in weaker years have meaningfully diluted the overall outcome.
The per-year breakdown underscores this dispersion. In 2020, XLV gained 19.55% over the window, with a maximum favorable move of 22.37% and a maximum adverse move of -12.0%, illustrating that even a strong year involved a double-digit drawdown at some point. By contrast, 2025 delivered a net loss of 5.56%, with only 0.9% at best in the investor’s favor and a maximum adverse move of -11.36%, showing how quickly the trade could move against a long position in a weaker tape.
The historical seasonal trend chart for this window, based on the six-year average, points to a generally upward-sloping profile that is punctuated by pullbacks rather than a smooth climb. In stronger years such as 2020 and 2021, gains tended to build steadily through the middle of the window, while softer years like 2022 and 2025 saw early or mid-window drawdowns that were not fully recovered by the end.
Year-by-year net results and intraperiod swings help frame how far XLV has tended to travel in both directions during this stretch.
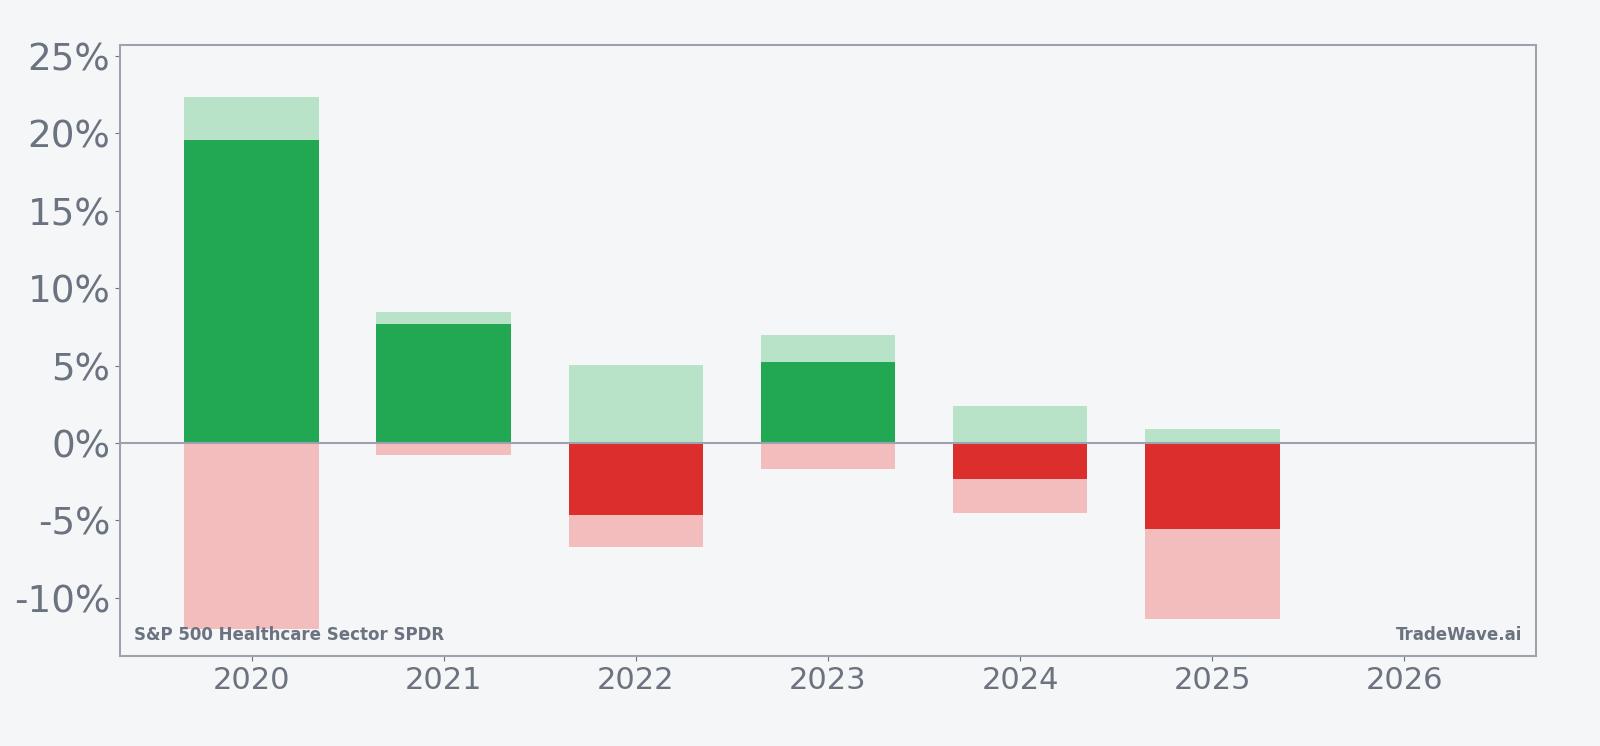
The combined net, MFE and MAE profile shows that in most years XLV has experienced meaningful swings in both directions during this window. Large positive maximum favorable moves, particularly in 2020 and 2023, indicate that rallies can extend well beyond the final net gain, while sizeable maximum adverse moves in 2020, 2022, 2024 and 2025 highlight that double-digit drawdowns have not been unusual even when the end result was modest. Taken together, the historical pattern defines the quantitative seasonal backdrop for the upcoming period.
History does not guarantee future results, and maximum adverse excursions can be large even in winning windows.
Price and near-term drivers
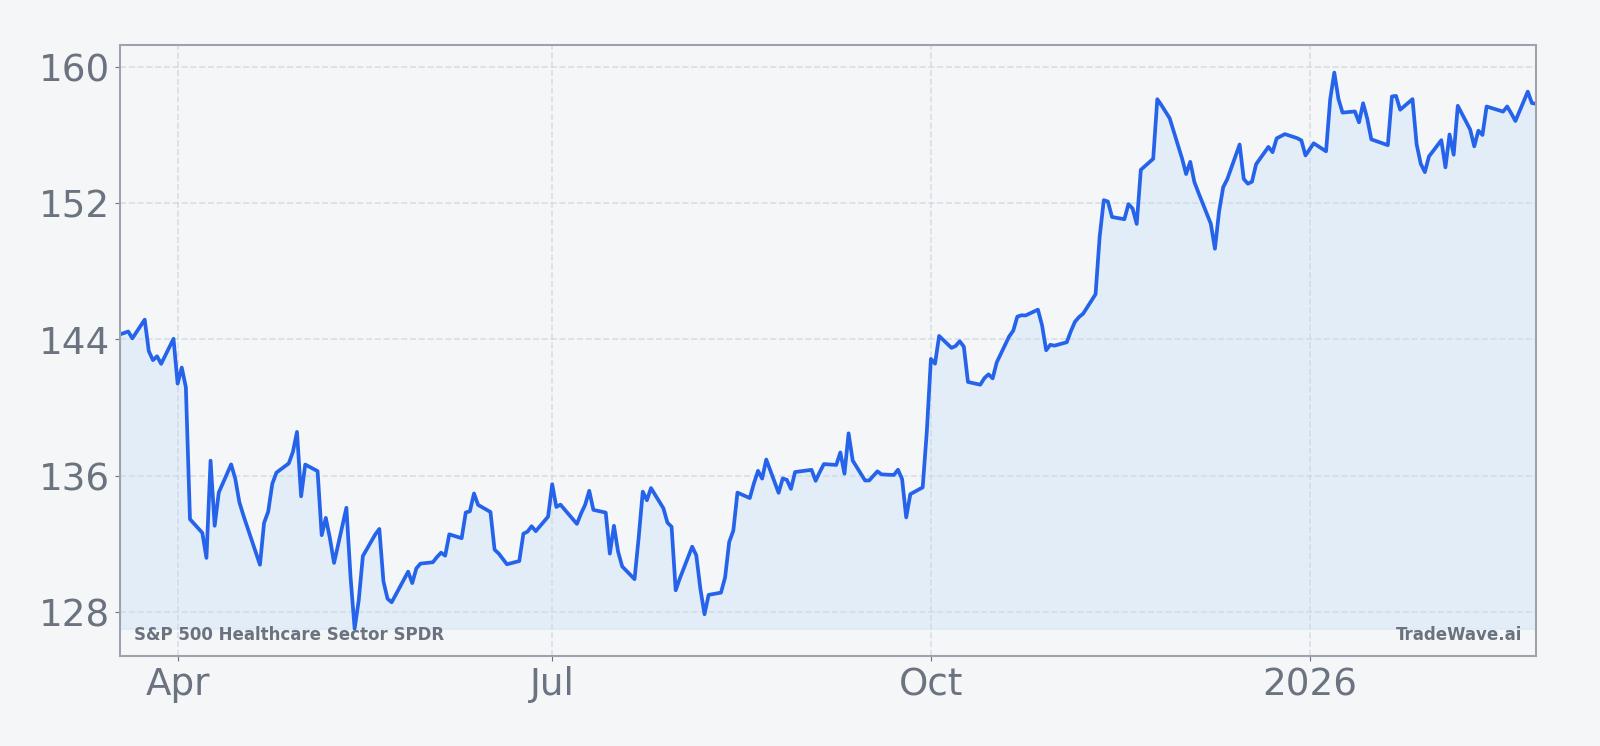
Real-time pricing, volume and flow data for S&P 500 Healthcare Sector SPDR are not available for Feb 26, 2026 in this dataset, so investors are heading into the March seasonal window without a precise read on today’s move or its distance from 52-week extremes. That lack of short-term context makes it more important to understand how the ETF has behaved around policy shifts and sector rotations in the recent past.
In Nov 2025, healthcare was among the strongest-performing S&P 500 sectors, with XLV up about 25% from its August low and leading the index over one- and three-month horizons, although some analysts warned that the sector looked overbought and vulnerable to a pause or pullback.[1] Earlier in 2025, a 5.06% increase in 2026 Medicare Advantage payment rates supported health insurance stocks and helped underpin the broader healthcare complex, offering a policy tailwind that could continue to influence sentiment as the new rates approach implementation.[11]
Those episodes illustrate how XLV can respond both to macro risk appetite and to specific regulatory decisions, with policy news sometimes offsetting or amplifying broader market trends. In Aug 2025, for example, healthcare’s strength came as the S&P 500 and Nasdaq hovered near record highs on expectations for a Federal Reserve rate cut, reinforcing the idea that the sector can participate fully in cyclical rallies when monetary conditions appear set to ease.[4]
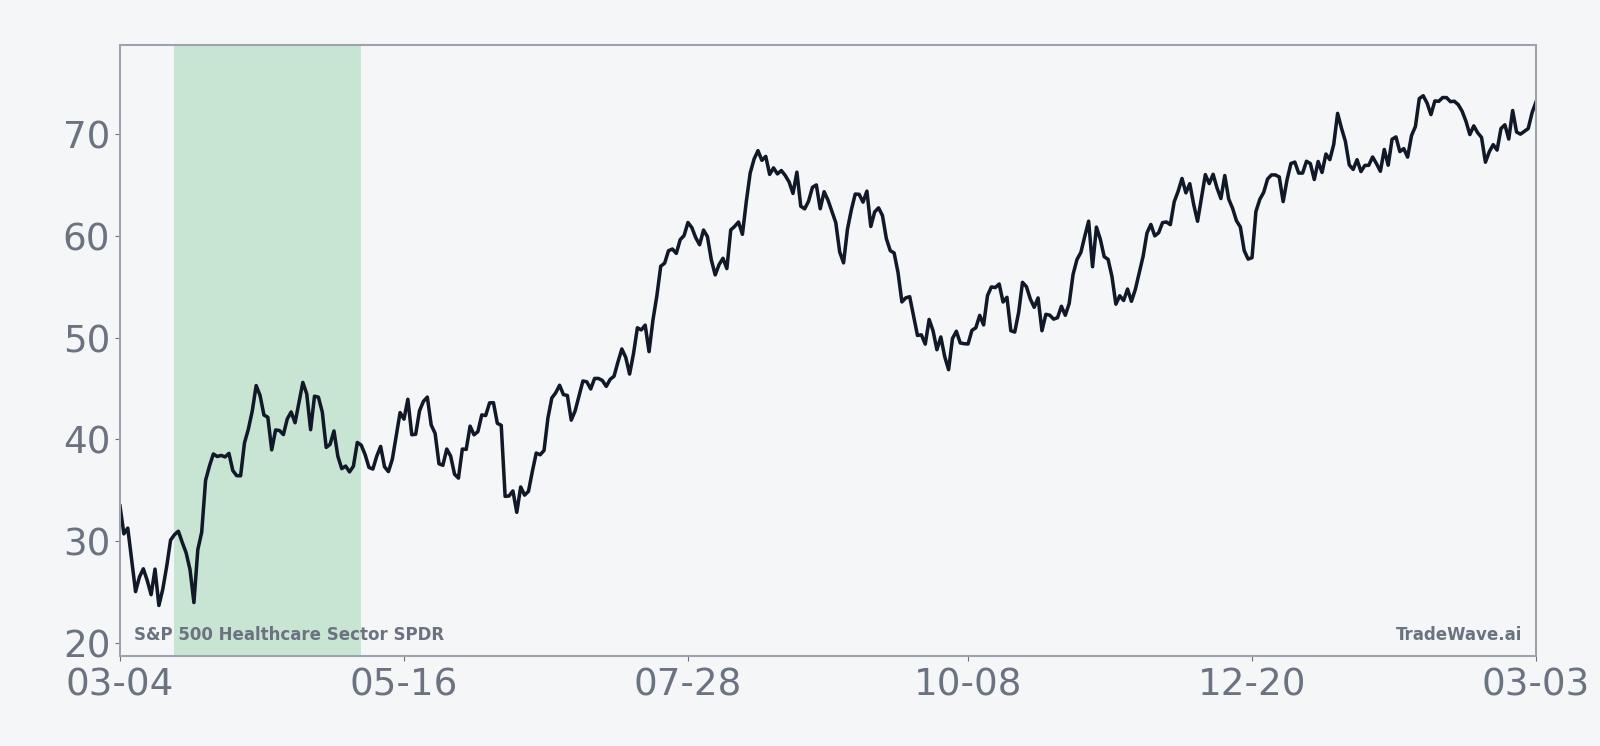
The chart below situates XLV’s recent path over the past year, providing a visual backdrop for the upcoming seasonal window.
Macro backdrop and sector exposure
S&P 500 Healthcare Sector SPDR is designed to track the healthcare constituents of the S&P 500, giving investors broad exposure to pharmaceuticals, biotechnology, medical devices, healthcare providers and insurers in a single ETF wrapper. That construction means XLV’s performance often reflects a blend of defensive characteristics and growth optionality, depending on which subsectors are in favor.
In 2025, healthcare’s leadership phase coincided with a broader equity rally and growing expectations for lower interest rates, which tend to support longer-duration growth assets such as biotech and high-innovation medical technology.[1] At the same time, the sector’s defensive reputation can attract flows when investors seek earnings stability in the face of macro uncertainty, giving XLV a dual role in portfolios as both a risk-on and risk-mitigation tool depending on the environment.
Policy remains a central driver. The 2025 announcement of higher Medicare Advantage reimbursement rates for 2026 eased some concerns about margin pressure for managed-care companies, which are a meaningful weight in XLV.[11] Future headlines around drug pricing, reimbursement frameworks and election-year healthcare proposals could all intersect with the upcoming seasonal window, potentially reinforcing or counteracting the historical pattern.
What to watch as the window approaches
With the 49-day seasonal window set to begin on Mar 18, investors in S&P 500 Healthcare Sector SPDR will be watching how flows, policy news and broader risk sentiment line up against the mixed but generally constructive historical backdrop. The six-year record shows that while half of the years have been profitable for a long stance, adverse moves within the window have at times been large, so the path of returns may matter as much as the final outcome.
Key items to monitor include any renewed signs of sector leadership or fatigue relative to the broader S&P 500, especially if healthcare begins to diverge meaningfully from the index. Policy developments around Medicare reimbursement, drug pricing or election-related healthcare proposals could also act as catalysts, particularly if they land early in the window when historical patterns suggest volatility can build.
From a technical perspective, traders may focus on how XLV behaves around prior swing highs and lows on the one-year chart, using those levels to gauge whether any early drawdowns resemble the deeper adverse excursions seen in weaker historical years or the shallower pullbacks that preceded strong recoveries. Follow-through in sector rotation, either toward or away from healthcare, will help determine whether the upcoming window aligns more closely with the strong years like 2020 and 2023 or the softer outcomes seen in 2022, 2024 and 2025.
Ultimately, the historical pattern suggests that this spring window has often been an active period for XLV rather than a quiet sideways stretch. Investors who track how real-time price action, macro headlines and sector flows evolve as Mar 18 approaches will be better positioned to interpret whether the ETF is starting to trace one of its historically stronger seasonal paths or repeating the more challenging profiles seen in its losing years.
Sources
- [1] CNBC, "This gold miner ETF can give a blueprint on whether the health care rally can go on. Here's why", Nov 26, 2025
- [4] Reuters, "S&P 500, Nasdaq hover near record highs on September rate cut hopes", Aug 13, 2025
- [11] Reuters, "Health insurance stocks rise on 'best case scenario' Medicare payment rates", Apr 8, 2025