S&P 500 Near Records as Investors Rotate Into S&P 500 Healthcare Sector SPDR (XLV)
S&P 500 Healthcare Sector SPDR is approaching a 49-day historical window that has delivered modest average gains but frequent drawdowns, just as investors reassess the sector’s role in a maturing market cycle.

Key takeaways
- A 49-day seasonal window for S&P 500 Healthcare Sector SPDR begins on Mar 18, 2026, with a long trade direction over the six-year lookback.
- The pattern has been profitable in 50% of years, with 3 winners and 3 losers, underscoring a balanced but uncertain track record.
- Winning years have shown an average profit of 10.82%, while including all years reduces the average outcome to 3%, reflecting the drag from losing periods.
- Historical maximum favorable moves have been sizable, but adverse excursions have also been deep in some years, pointing to a high-variance environment within the window.
- A TradeWave Ratio of 0.93 and a Sharpe ratio of 0.29 indicate that while the window has offered meaningful swings in the trade direction, risk-adjusted results have been moderate.
- Investors watching XLV’s role as a defensive sector anchor should be aware that this upcoming window has alternated between strong rallies and notable pullbacks in prior years.
According to historical data from TradeWave.ai, the next several weeks for S&P 500 Healthcare Sector SPDR line up with a recurring seasonal pattern that has produced both strong advances and sharp setbacks in past years.
Seasonal window
This seasonal window begins on Mar 18, 2026 and spans 49 trading days. Historically, during this period, S&P 500 Healthcare Sector SPDR has shown a modestly positive but uneven tendency, with strong gains in some years offset by meaningful losses in others. With current price and flow data limited, the pattern serves more as a roadmap for potential volatility than a precise guide to direction, especially given the sector’s shifting role in broader equity markets in recent years.[1][3]
Across the six-year sample, the long trade direction has produced 3 winning years and 3 losing years, so the Percent Profitable of 50% reflects a coin-flip hit rate rather than a dominant edge. The distinction between the 10.82% Avg Profit in winning years and the 3% Avg Profit - All, which includes every year in the sample, shows how a handful of negative seasons have pulled down the overall outcome. In other words, when the pattern works, it has tended to work meaningfully, but the losing years have been large enough to matter.
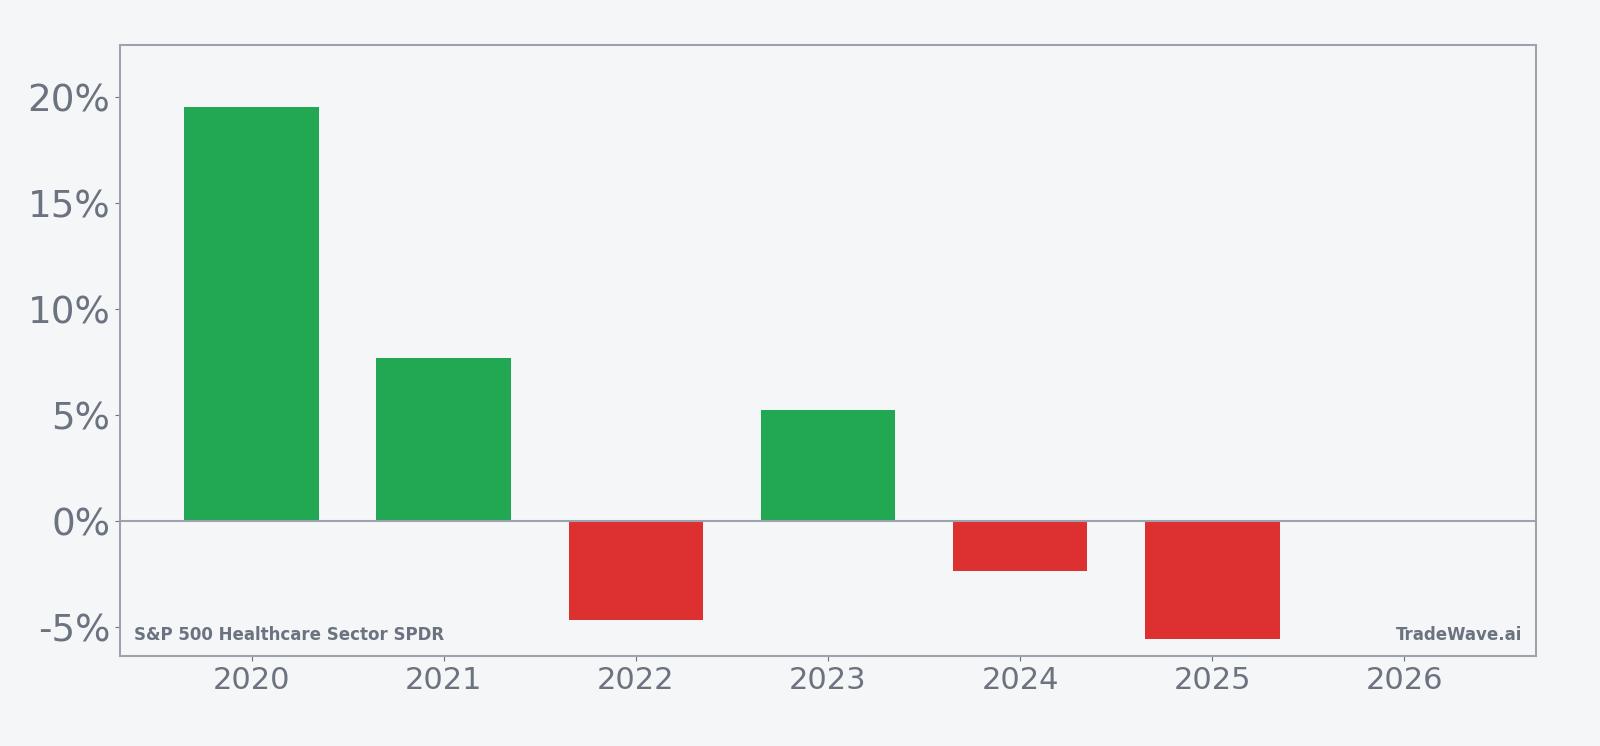
The per-year breakdown underscores this dispersion. In 2020, XLV gained 19.55% over the window, with a maximum favorable move of 22.37% and a maximum adverse move of -12.0%, illustrating both strong upside and deep intraperiod drawdowns in the same season. By contrast, 2025 delivered a net loss of -5.56%, with only 0.9% at best in the trade direction and a worst drawdown of -11.36%, highlighting how the same calendar stretch can behave very differently depending on the broader backdrop.
The historical maximum favorable excursion and maximum adverse excursion profile points to a high-variance environment rather than a smooth grind higher. In stronger years such as 2020 and 2021, XLV’s best point-to-peak moves within the window reached 8% to more than 20%, while the worst intraperiod declines often ran into mid-single to low-double digits. That combination suggests that even when the long pattern ultimately finishes positive, investors have had to tolerate sizable swings along the way.
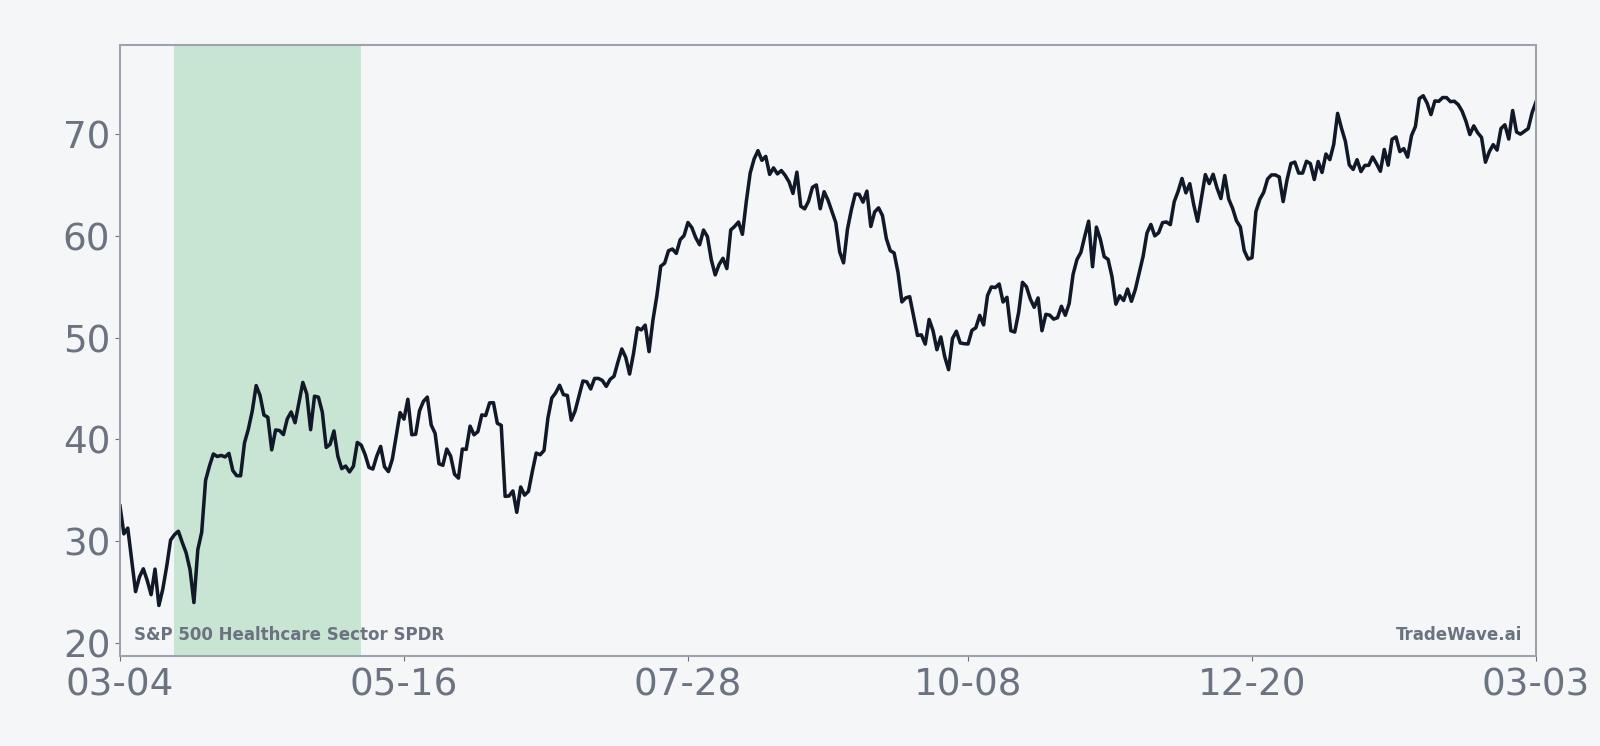
The 6-year average seasonal trend chart smooths out those individual paths and shows a generally upward-sloping profile, consistent with the long trade direction and positive all-years average. The typical pattern has tended to build gains gradually rather than in a single burst, with some choppiness early in the window before strength consolidates later in the period.
A combined view of net returns with peak favorable and worst adverse moves highlights how upside potential and downside risk have coexisted in this window.
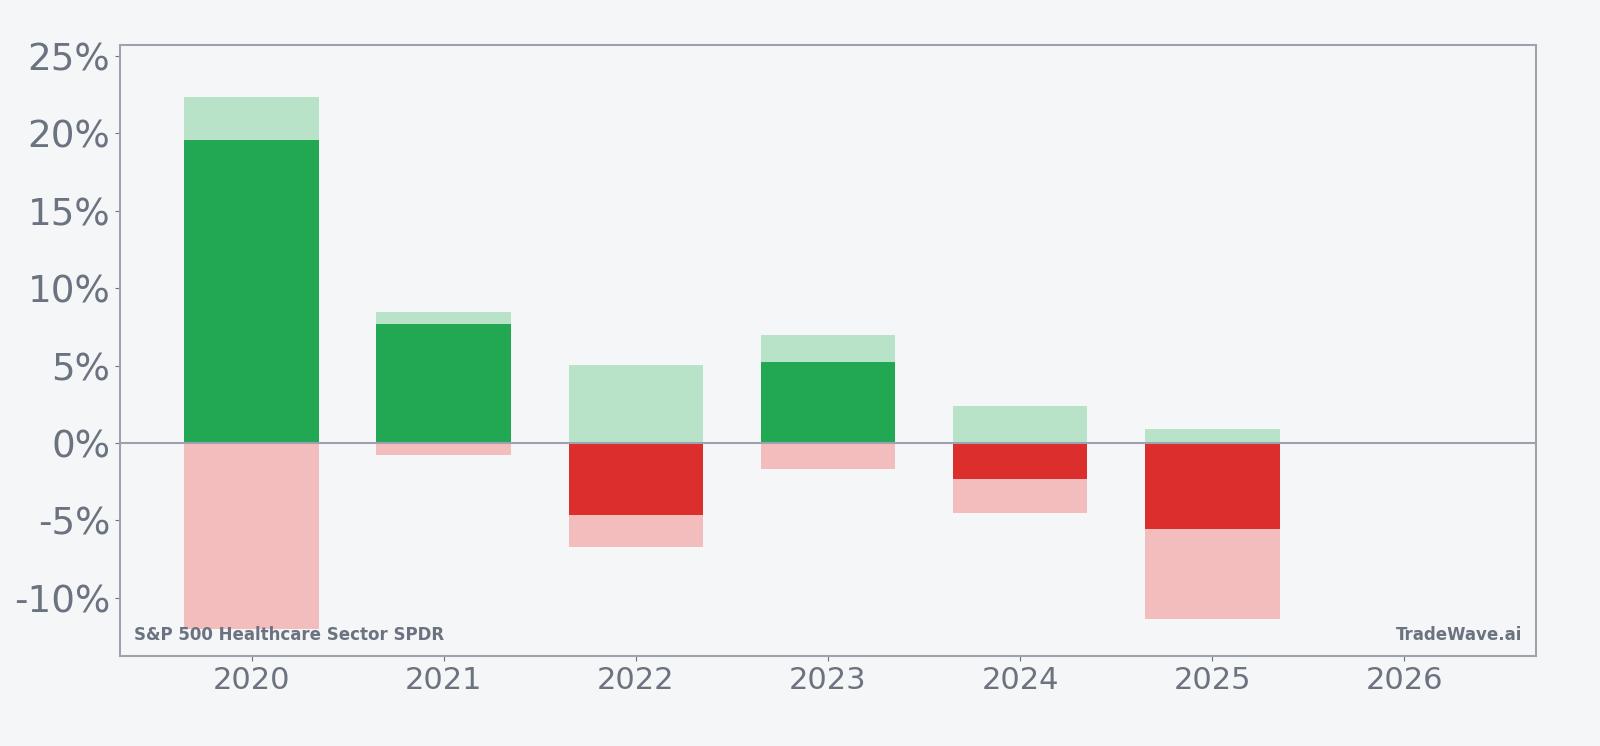
The stacked net, maximum favorable, and maximum adverse bars make that trade-off clear: in years like 2020, the window delivered both a large positive finish and a double-digit intraperiod decline, while in weaker years such as 2022 and 2025, downside excursions dominated and the pattern ended in the red. Taken together, the historical pattern defines the quantitative seasonal backdrop for the upcoming period.
History does not guarantee future results, and adverse excursions can be large even in winning windows.
Price and near-term drivers
Real-time pricing and flow data for S&P 500 Healthcare Sector SPDR on Feb 26, 2026 are limited in this dataset, but the ETF’s recent history has been shaped by a powerful rally off a 2024–25 pullback and a broader rebound in healthcare stocks. In Nov 2025, coverage of the sector highlighted that XLV had risen 25% from its August low and was leading S&P 500 sector performance over one- and three-month horizons, suggesting that investors had rotated back into healthcare after a period of underperformance.[1]
That resurgence followed several years in which XLV had been in a steady uptrend before the 2024–25 setback, leaving the fund in what analysts described as a renewed phase of strength but with overbought conditions that could invite near-term pullbacks.[1] For investors looking ahead to the March seasonal window, this backdrop matters because it frames whether the pattern is likely to intersect with a momentum-driven advance, a consolidation phase, or a corrective move.
Macro conditions have also been supportive for risk assets more broadly. In Aug 2025, the S&P 500 and Nasdaq were reported to be hovering near record highs as traders anticipated potential Federal Reserve rate cuts in September, a backdrop that typically benefits defensive growth sectors such as healthcare by lowering discount rates on future earnings while keeping demand expectations intact.[3] If those expectations evolve into an actual easing cycle, the sector’s traditional role as a defensive ballast could be tested against renewed appetite for higher-beta areas of the market.
Policy and regulation remain another key driver for XLV’s underlying holdings. In Apr 2025, a 5.06% increase in Medicare Advantage payment rates for 2026 was described as a “best case scenario” for health insurance stocks, providing relief to a group that had faced reimbursement and cost pressures earlier in the cycle.[11] Such regulatory tailwinds can help stabilize earnings expectations for major constituents of the ETF, potentially cushioning the impact of any volatility that emerges during the upcoming seasonal window.
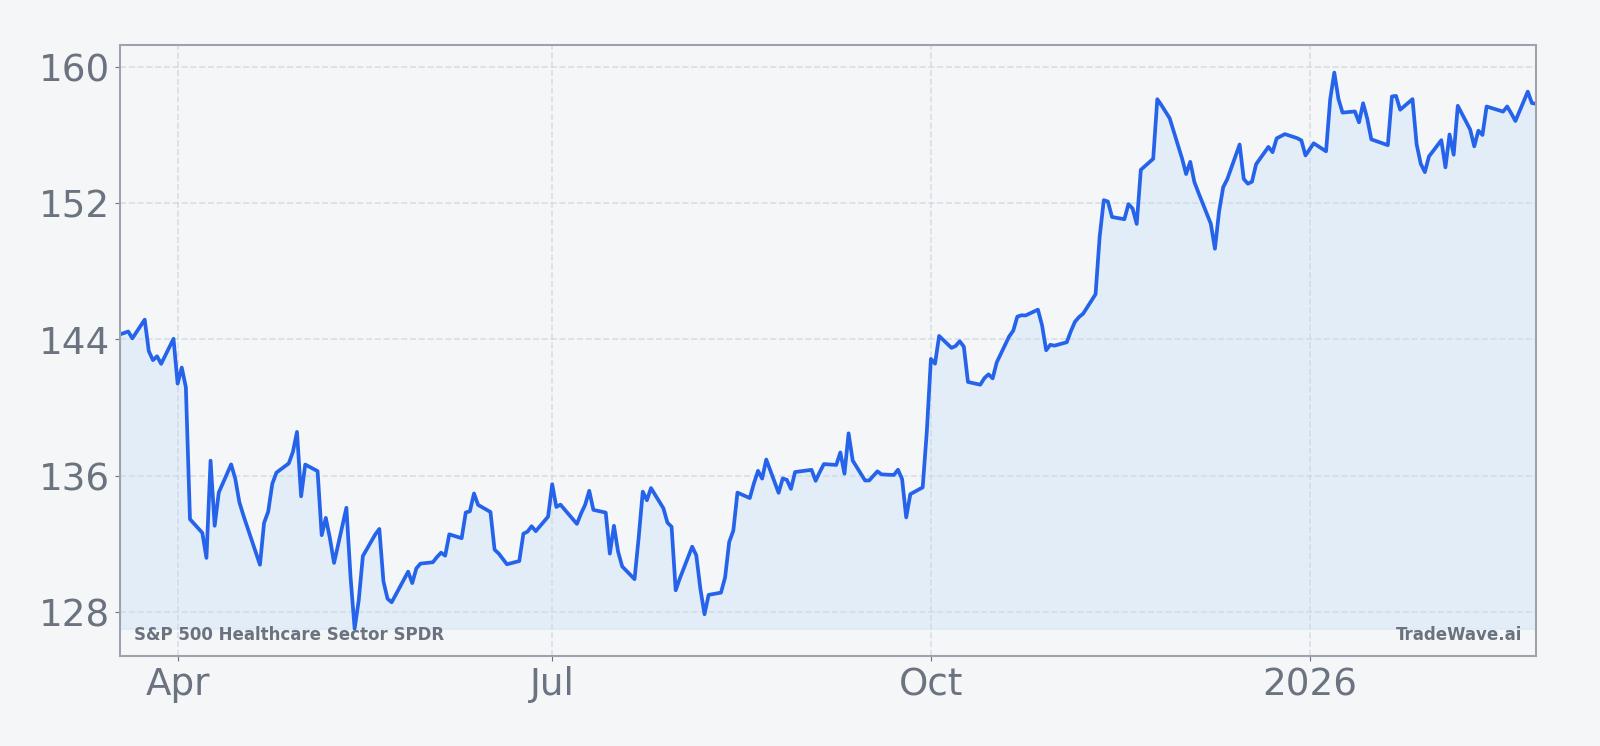
The chart below situates the latest moves in XLV within its recent 12-month trading range.
Sector exposure and macro themes
S&P 500 Healthcare Sector SPDR tracks the healthcare constituents of the S&P 500, giving investors broad exposure to pharmaceuticals, biotechnology, medical devices, health insurers, and healthcare services companies. That mix has historically positioned XLV as a defensive growth vehicle, balancing relatively stable demand for healthcare services with innovation-driven upside in areas such as biotech and medical technology.
In 2025, healthcare stocks were reported to have led S&P 500 sector gains with a 1.4% rise on a single session, reflecting a recovery after being “beaten down” earlier in the year.[3] This kind of catch-up behavior is important when thinking about seasonality, because a sector that is rebounding from a period of underperformance can respond differently to a historically mixed window than one that is already extended after a long rally.
At the same time, the sector’s sensitivity to policy decisions, reimbursement frameworks, and demographic trends means that macro and regulatory headlines can quickly override historical patterns. The Medicare Advantage rate increase for 2026, for example, directly affects earnings visibility for large managed-care names inside XLV, which in turn influences the ETF’s overall volatility profile.[11] Investors weighing the seasonal window will need to keep one eye on Washington and another on the Federal Reserve.
What to watch as the window approaches
With the 49-day seasonal window set to begin on Mar 18, 2026, the key takeaway from the historical data is that XLV has tended to experience meaningful swings in both directions, even when the final outcome has been positive. The long trade direction, 50% Percent Profitable rate, and 10.82% average gain in winning years suggest that the period has offered upside opportunities, but the presence of three losing years and double-digit intraperiod drawdowns in some seasons underline the need for caution.
In practical terms, investors may want to monitor three broad areas as the window nears. First, watch how XLV trades relative to the broader S&P 500: if healthcare continues to act as a leadership group, a historically mixed but slightly positive seasonal backdrop could reinforce that strength, whereas renewed lagging behavior might make the negative years in the sample more relevant. Second, keep an eye on macro catalysts such as Federal Reserve communications and economic data that could shift expectations for rate cuts, since changes in the discount-rate outlook have been a key driver of sector performance in the past.[3]
Third, track policy developments around Medicare and broader healthcare regulation, particularly any follow-through to the 2026 Medicare Advantage payment framework that was seen as supportive for insurers.[11] Sharp moves in large managed-care names or major pharmaceutical holdings can quickly influence XLV’s path inside the window, especially in a period that has historically featured sizable maximum favorable and adverse excursions. How the ETF behaves around these catalysts will help confirm whether the upcoming stretch is aligning with the stronger historical years or echoing the more challenging ones.
Ultimately, the seasonal pattern for S&P 500 Healthcare Sector SPDR provides a quantitative backdrop rather than a forecast. The history suggests that this March-to-May stretch has often mattered for the sector, but the way it interacts with current macro conditions, regulatory headlines, and investor positioning will determine whether 2026 joins the list of strong seasonal years or the losing side of the ledger.
Sources
- CNBC, “This gold miner ETF can give a blueprint on whether the health care rally can go on. Here's why” (Nov 26, 2025)
- Reuters, “S&P 500, Nasdaq hover near record highs on September rate cut hopes” (Aug 13, 2025)
- Reuters, “Health insurance stocks rise on 'best case scenario' Medicare payment rates” (Apr 8, 2025)