Strong Sector Run Puts S&P 500 Healthcare Sector SPDR (XLV) at Risk of Near-Term Pullback
S&P 500 Healthcare Sector SPDR is heading toward a 49-day seasonal stretch with a historically positive but uneven profile, just as investors reassess sector strength, policy support and recent volatility.

Key takeaways
- XLV’s upcoming 49-day window starting Mar 18 has a long trade direction with a historically positive but inconsistent pattern across the past six years.
- The window has been profitable in 50% of years, with 3 winners and 3 losers, and winning years have shown an average gain of 10.82% while the all-years average is 3%.
- Historical data show sizable swings inside the window, including years with double-digit rallies and years with notable drawdowns, underscoring elevated intraperiod volatility.
- The pattern’s TradeWave Ratio of 0.93 and Sharpe ratio of 0.29 point to meaningful directional moves but only modest risk-adjusted results.
- Recent sector strength and policy tailwinds provide a supportive backdrop, yet the mixed seasonal record suggests investors should be prepared for both upside bursts and sharp pullbacks.
According to historical data from TradeWave.ai, the coming 49-day stretch for XLV has displayed a distinct seasonal character in prior years. The next section looks at how that pattern has behaved and what it may imply for the backdrop investors are about to enter.
Seasonal window
This seasonal window begins on Mar 18, 2026 and spans 49 trading days, and historically it has been a moderately constructive but uneven stretch for S&P 500 Healthcare Sector SPDR. With current price data unavailable, investors are heading into this period without a precise read on where XLV sits versus its 52-week range, which puts more weight on the historical pattern as a reference point.
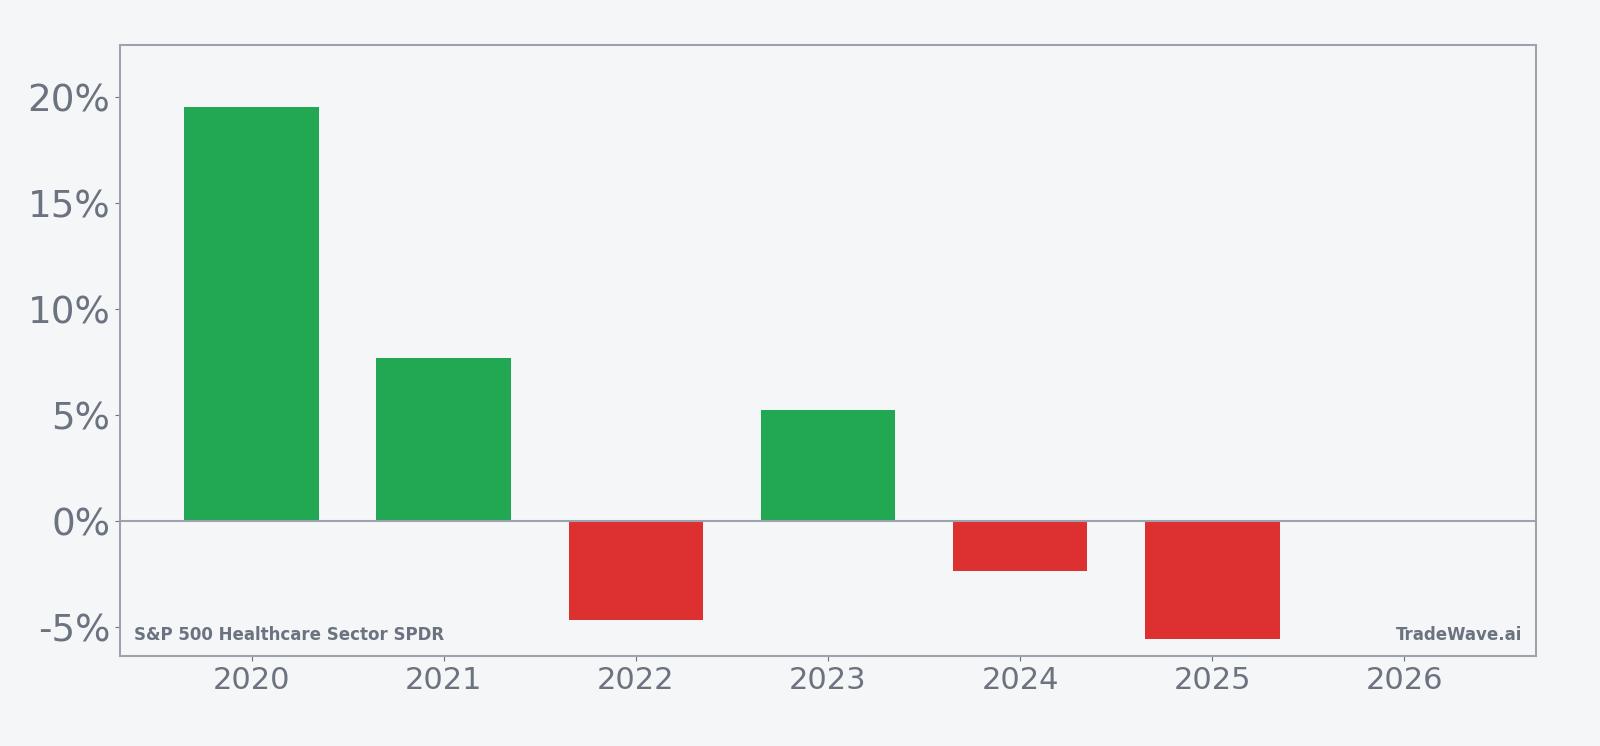
Across the six-year sample, the trade direction for this pattern is long, meaning the historical analysis focuses on upside behavior during the window. The window has been profitable in 50% of years, with 3 winners and 3 losers, so investors have seen as many positive outcomes as negative ones over this stretch. In the winning years, XLV posted an average gain of 10.82%, while including all years, winners and losers together, the average outcome drops to 3%, which reflects the drag from down years.
The per-year breakdown shows how uneven those outcomes have been. In 2020, XLV gained 19.55% over the window, with a maximum favorable move of 22.37% from the entry price and a maximum adverse move of -12.0%, illustrating a year with both a powerful rally and a deep intraperiod drawdown. By contrast, 2025 delivered a net loss of -5.56%, with a limited peak run-up of 0.9% and a worst drawdown of -11.36%, underscoring that the same calendar stretch can behave very differently from year to year.
The historical maximum favorable excursion, or best point-to-peak move within the window, has often been sizable in the stronger years, suggesting that when XLV trends higher in this period it can do so quickly. At the same time, the maximum adverse excursion, or worst drawdown from the entry, has also been meaningful in several years, indicating that downside volatility has been a recurring feature even when the final result was positive. The combination of a TradeWave Ratio of 0.93 and a Sharpe ratio of 0.29 points to a window where price tends to move a fair distance in the trade direction, but the risk-adjusted payoff has been only modest because of that volatility.
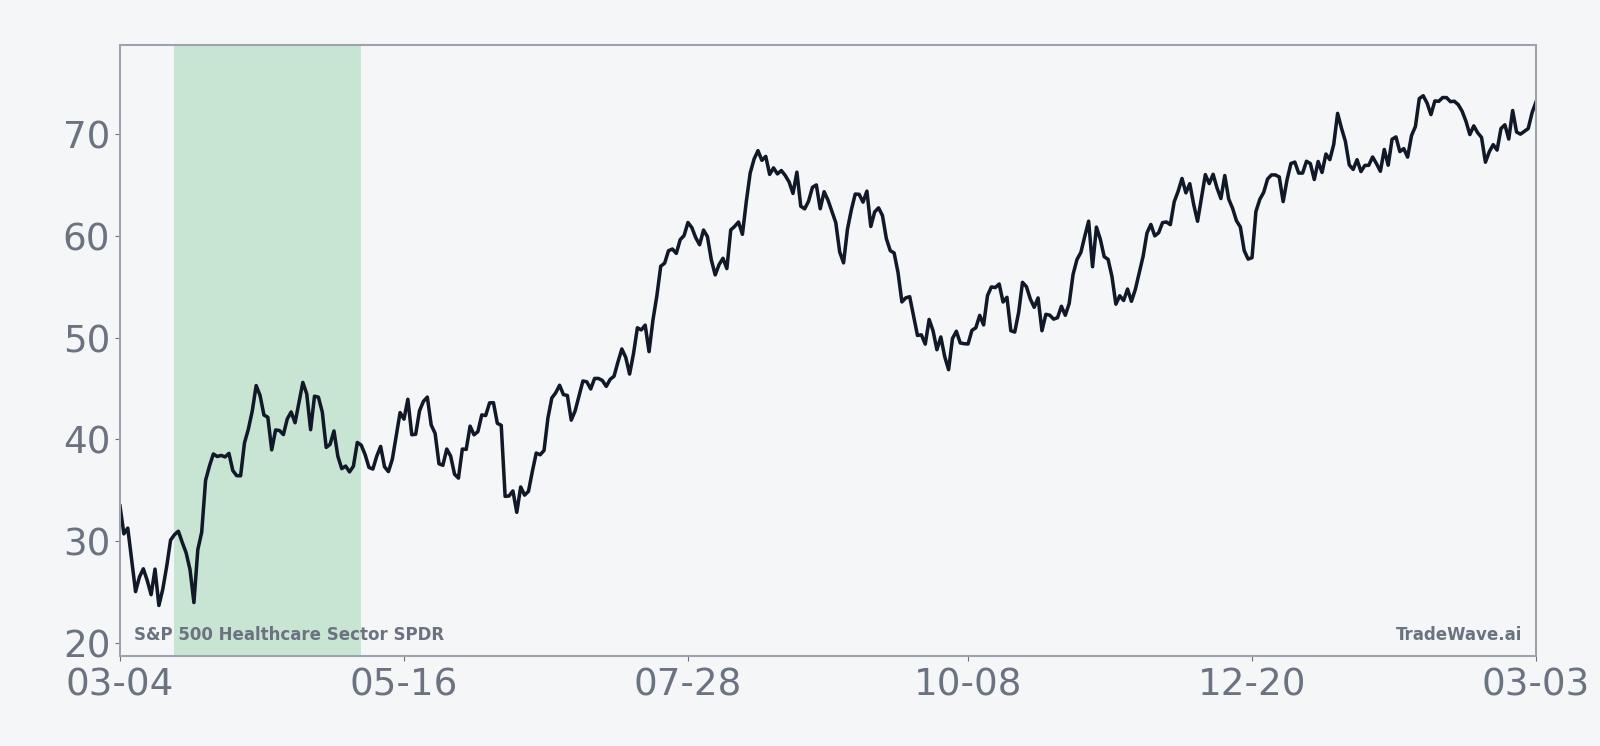
The historical seasonal trend chart smooths those individual years into an average path, which tilts upward over the 49 days but with periods of consolidation and pullback along the way. The pattern suggests that gains, when they occur, have tended to build over the full window rather than arriving in a single straight-line move, and that choppiness has been part of the typical experience.
A closer look at yearly net results alongside peak rallies and worst drawdowns highlights how that average masks a wide range of outcomes.
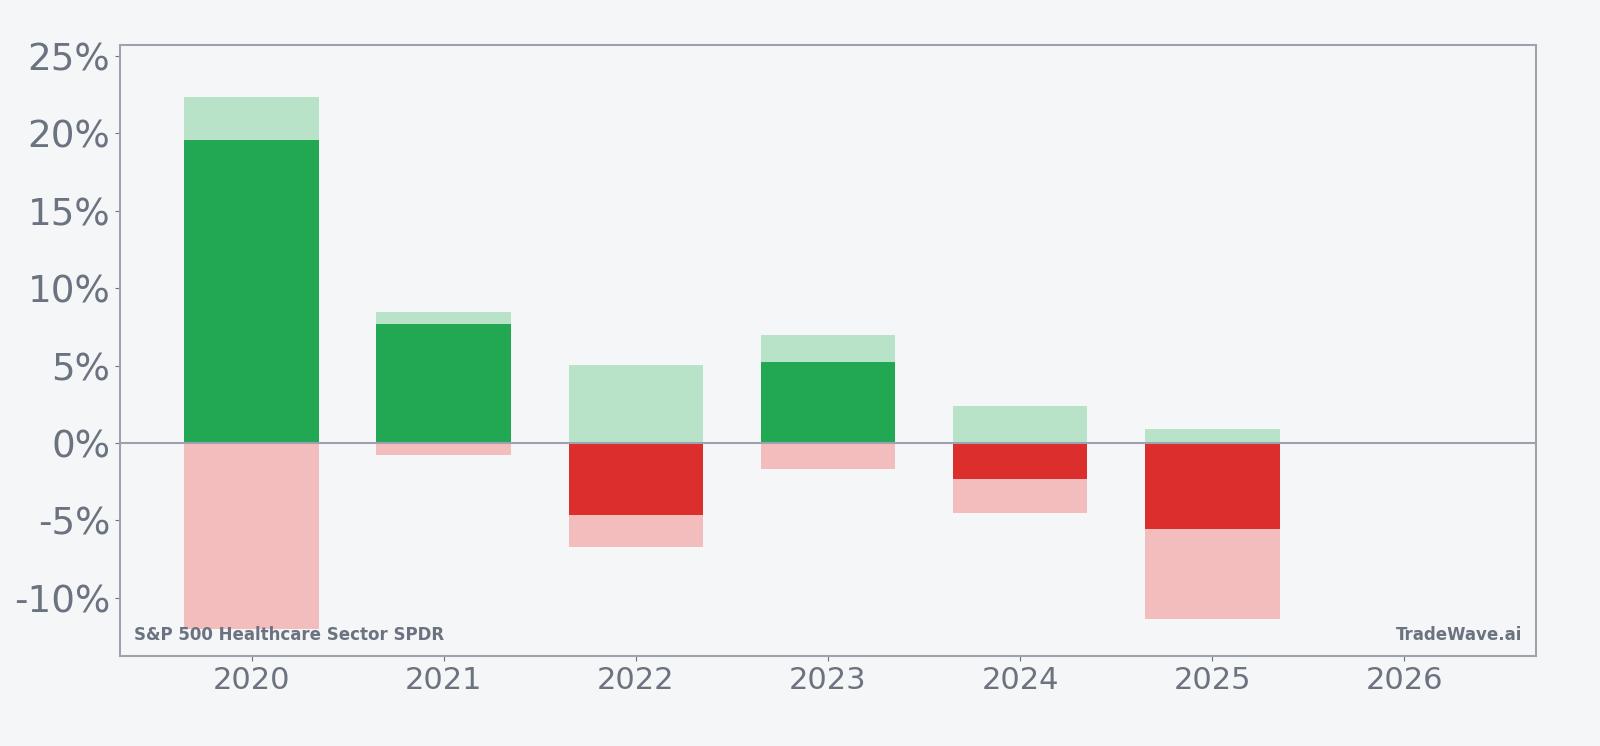
The combined net, peak favorable and worst drawdown bars show that even in years with solid gains, such as 2020 and 2021, XLV experienced meaningful downside swings before finishing higher, while losing years like 2022, 2024 and 2025 saw adverse moves that either matched or exceeded the eventual decline. Taken together, the historical pattern defines the quantitative seasonal backdrop for the period investors are about to enter.
History does not guarantee future results, and adverse excursions can be large even in winning windows.
Price and near-term drivers
Real-time pricing and flow data for S&P 500 Healthcare Sector SPDR are not available for Feb 26, 2026 in this dataset, but the ETF enters this seasonal setup after a period in which healthcare has reasserted itself as a leadership group within the S&P 500. In Nov 2025, sector analysis highlighted XLV’s 25% advance from its August low and its position among the strongest S&P 500 sectors over one- and three-month horizons, while also flagging stretched conditions that could invite consolidation or pullbacks.[1]
That earlier surge reflected a combination of defensive demand for healthcare earnings and renewed interest in large-cap drugmakers, medical device companies and managed care stocks. The move also came against a broader equity backdrop where the S&P 500 and Nasdaq were trading near record levels in Aug 2025 as investors focused on the prospect of Federal Reserve rate cuts, a macro environment that tends to support long-duration growth sectors such as healthcare.[4] Although those conditions are dated, they frame the kind of macro mix that has recently accompanied strong XLV performance.
Policy has been another important driver. On Apr 8, 2025, regulators approved a 5.06% increase in 2026 Medicare Advantage payment rates, a decision described as a “best case scenario” for health insurers and one that lifted health insurance stocks on the day.[11] That ruling improved visibility for a key profit pool inside XLV’s portfolio and helped underpin sentiment toward the broader healthcare complex, even as investors continued to monitor political rhetoric around drug pricing and reimbursement.
Stock-specific stories have also shaped the sector narrative. On Jan 12, 2026, analysts initiated coverage of Medline with bullish ratings following its high-profile IPO, underscoring continued appetite for new healthcare listings and the market’s willingness to assign premium valuations to perceived category leaders.[7] Earlier in Feb 2026, McKesson shares surged 17% in a single session after a strong update, highlighting how individual healthcare names can deliver outsized moves that ripple through sector ETFs like XLV.[14]
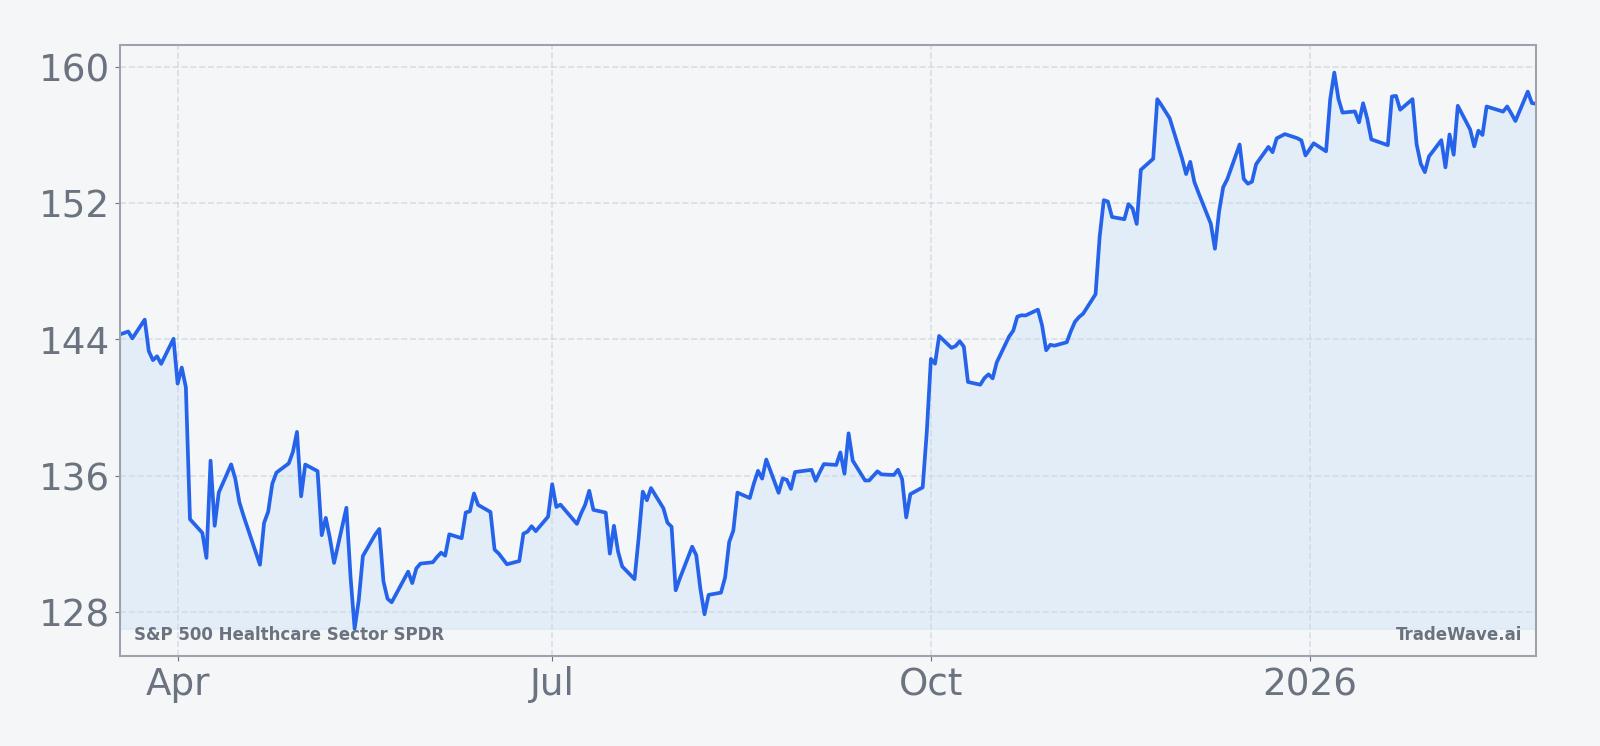
The chart below situates XLV’s recent behavior in its broader 12-month context.
Macro backdrop and sector exposure
XLV tracks the healthcare segment of the S&P 500, giving investors broad exposure to pharmaceuticals, biotechnology, medical devices, healthcare providers and insurers. That mix blends defensive characteristics, such as relatively stable demand for medical services, with growth drivers tied to innovation in drugs and technology, which can make the ETF behave differently from the broader index at various points in the cycle.
In late 2025, healthcare’s leadership run was notable because it came after a period when more cyclical and technology-heavy areas had dominated returns.[1] The sector’s ability to outperform during that stretch suggested investors were rotating toward earnings resilience and policy-supported cash flows, themes that can remain relevant as markets navigate shifting expectations for interest rates and economic growth.
At the same time, regulatory risk remains a structural feature of the group. The Medicare Advantage rate decision in Apr 2025 illustrated how quickly sentiment can swing when reimbursement outlooks change, with health insurance stocks rallying on the favorable ruling.[11] Future policy moves on drug pricing, reimbursement formulas or coverage rules could similarly influence XLV’s path during the upcoming seasonal window, either amplifying or offsetting the historical pattern.
What to watch as the window opens
As XLV approaches its 49-day seasonal window beginning Mar 18, investors will be watching how sector flows, macro data and policy headlines interact with the historically mixed but upward-tilted pattern. One focus will be whether healthcare can sustain the leadership it showed into late 2025, when XLV outpaced other S&P 500 sectors over one- and three-month periods, or whether that strength gives way to the kind of choppier behavior seen in several of the historical seasonal years.[1]
Key catalysts during the window are likely to include any updates on Medicare reimbursement, drug pricing initiatives and broader fiscal or regulatory proposals that touch healthcare spending, given the sector’s sensitivity to policy shifts.[11] Traders will also monitor how large constituents respond to company-specific news, such as earnings revisions, clinical trial results or M&A activity, since outsized moves in individual names have recently driven notable sector swings.[14]
From a technical and behavioral standpoint, the historical record suggests that both sharp rallies and deep pullbacks have been common inside this window, even in years that ultimately finished higher. Investors may therefore pay close attention to how XLV behaves around any early drawdowns: whether weakness stabilizes and reverses in line with the stronger historical years, or whether selling pressure persists in a way that resembles the losing years in the sample.
Finally, relative performance versus the broader S&P 500 will be an important gauge of whether healthcare is acting as a defensive haven or a source of risk during this stretch. If XLV can hold leadership while navigating the typical intraperiod volatility, it would be consistent with the better historical outcomes for this seasonal window. A sustained loss of relative strength, by contrast, would align more with the weaker years and could signal that the sector’s recent tailwinds are fading as the calendar moves through this historically active period.
Sources
- [1] CNBC, “This gold miner ETF can give a blueprint on whether the health care rally can go on. Here's why,” Nov 26, 2025. Link
- [2] Seeking Alpha, “Notable healthcare headlines: Trump’s ultimatum to big pharma, Novo Nordisk in focus,” Aug 3, 2025. Link
- [3] The Motley Fool, “Want Decades of Passive Income? 3 Stocks to Buy Now and Hold Forever,” Jul 5, 2025. Link
- [4] Reuters, “S&P 500, Nasdaq hover near record highs on September rate cut hopes,” Aug 13, 2025. Link
- [5] MarketBeat, “Atria Investments Inc Purchases Shares of 5,272 Modine Manufacturing Company $MOD,” Nov 10, 2025. Link
- [6] CNBC, “Stocks making the biggest moves premarket: Intuitive Surgical, Pegasystems, Beyond Meat, Krispy Kreme and more,” Oct 22, 2025. Link
- [7] Reuters, “Analysts initiate Medline with bullish ratings after blockbuster IPO,” Jan 12, 2026. Link
- [11] Reuters, “Health insurance stocks rise on 'best case scenario' Medicare payment rates,” Apr 8, 2025. Link
- [13] Morningstar, “SHAREHOLDER REMINDER: Faruqi & Faruqi, LLP Investigates Claims on Behalf of Investors of Sarepta Therapeutics,” Aug 16, 2025. Link
- [14] Forbes, “How McKesson Stock Surged 17% In A Day,” Feb 6, 2026. Link