Steep One-Day Gold Drop Tests Vaneck Gold Miners ETF (GDX) After January Highs
Vaneck Gold Miners ETF is approaching a 44-day stretch that has delivered consistent gains over the past decade, just weeks after gold’s record high reignited interest in miners.

Key takeaways
- A 44-day seasonal window for Vaneck Gold Miners ETF begins on Mar 2 and has historically been strongly positive for long positions.
- Across the past 10 years, the pattern shows a 100% Percent Profitable record, with 10 winners and 0 losers in this window.
- Average profit in winning years is 13.52%, with a cumulative return of 248% and an annualized return of 13.29% over the sample.
- The TradeWave Ratio of 2.07 and Sharpe ratio of 1.7 point to historically strong upside moves relative to risk in this period.
- Intraperiod drawdowns have varied, including a sharp adverse move in 2020, underscoring that even winning windows can be volatile.
- The window arrives soon after bullion hit a record $5,100 per ounce in January, a backdrop that has recently supported gold miners.[3]
According to historical data from TradeWave.ai, this upcoming stretch for Vaneck Gold Miners ETF has shown a distinct seasonal tendency that stands out from the rest of the year. The next section looks at how that pattern has behaved over the past decade and how it fits with today’s gold backdrop.
Seasonal window
This seasonal window begins on 2026-03-02 and spans 44 days. Historically, during this period, Vaneck Gold Miners ETF has shown a strong upside tendency for long positions, with every year in the past decade finishing the window in positive territory. That track record comes on top of a powerful macro backdrop for gold, after bullion reached a record $5,100 per ounce in late January and lifted miners broadly.[3]
The trade direction for this pattern is explicitly long, and the historical outcomes line up with that bias. Across the 10-year sample, the window has been profitable in 100% of years, with 10 winners and 0 losers, and an average profit of 13.52% for those winning years. The cumulative return across all windows is 248%, which translates into an annualized return of 13.29% and a Sharpe ratio of 1.7, indicating that the gains have come with a relatively favorable risk-adjusted profile.
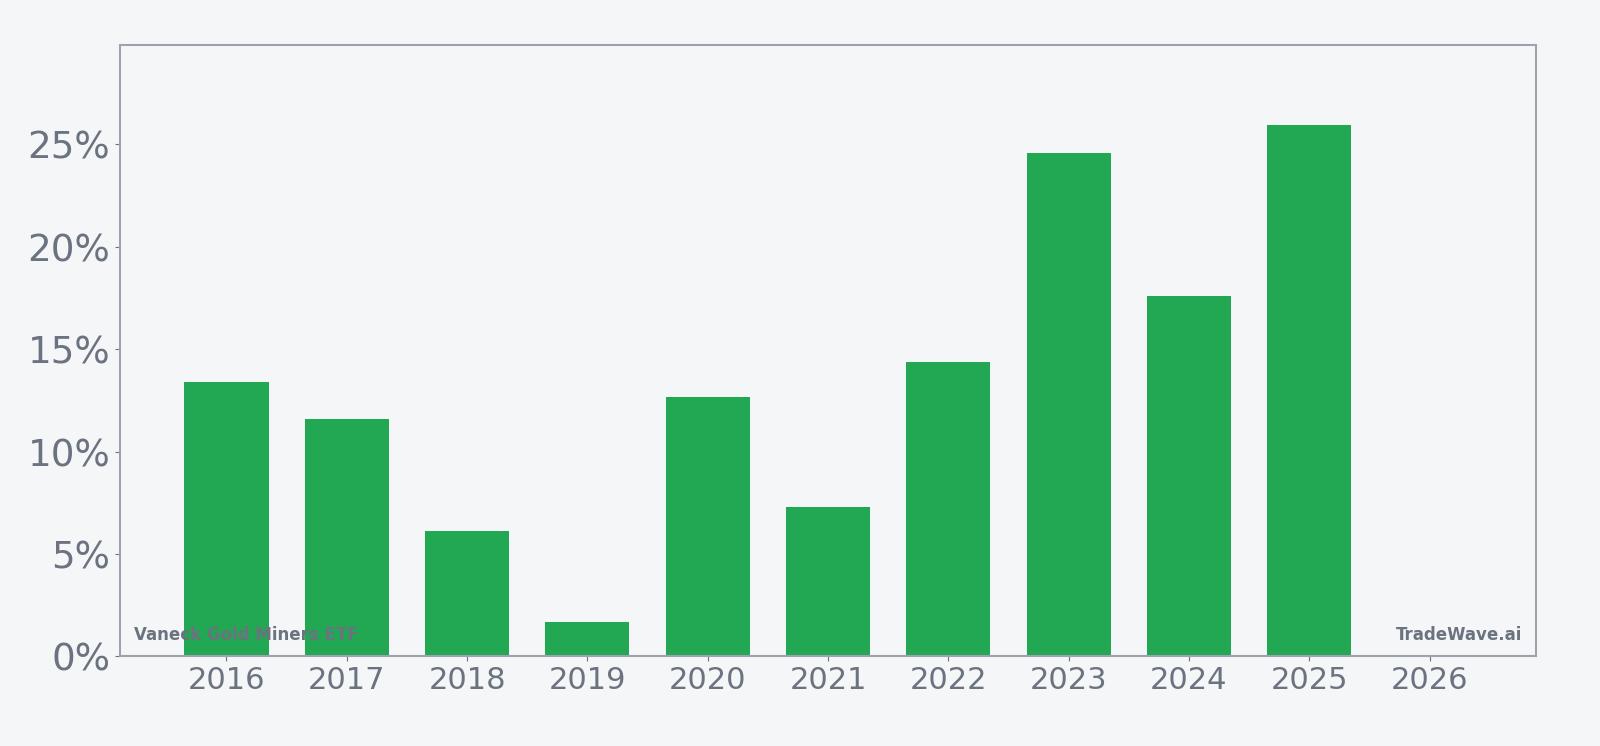
Individual years show some dispersion around that average. The strongest outcome in the sample came in 2025, when the window produced a net return of 25.96% from an entry price of 39.4237 to an exit price of 49.6593. At the other end of the spectrum, 2019 delivered the weakest gain, with a net return of 1.69% from 20.1381 to 20.4791, illustrating that even in winning years the payoff can be modest when conditions are less supportive.
The intraperiod path has not always been smooth. Maximum favorable excursions, which measure the best point-to-peak move from entry during the window, have ranged from 7.0% in 2019 to 28.15% in 2023, showing that in stronger years GDX has often rallied well beyond the final close before consolidating. Maximum adverse excursions, which track the worst drawdown from entry, have generally been contained in the low single digits but spiked to -40.71% in 2020, reflecting the extreme volatility around that year’s market shock even though the window still finished with a 12.68% gain.
That combination of sizable maximum favorable moves and occasionally deep maximum adverse moves points to a window that has historically been both rewarding and volatile. The TradeWave Ratio of 2.07 suggests that, on average, price has tended to travel meaningfully in the trade direction within the window, while the standard deviation of 7.69% underscores that outcomes can vary materially from year to year. For investors, the pattern describes a period where upside has dominated over the past decade, but where risk management has still mattered inside the window.
The historical seasonal trend chart shows gains tending to build progressively through the window rather than arriving in a single burst. In many years, the pattern has featured an early advance, a mid-window consolidation, and a further push higher into the latter part of the period, which is consistent with the relatively high share of years that finish solidly positive.
A second view that combines net returns with peak run-ups and worst drawdowns highlights how upside and downside have interacted in prior windows.
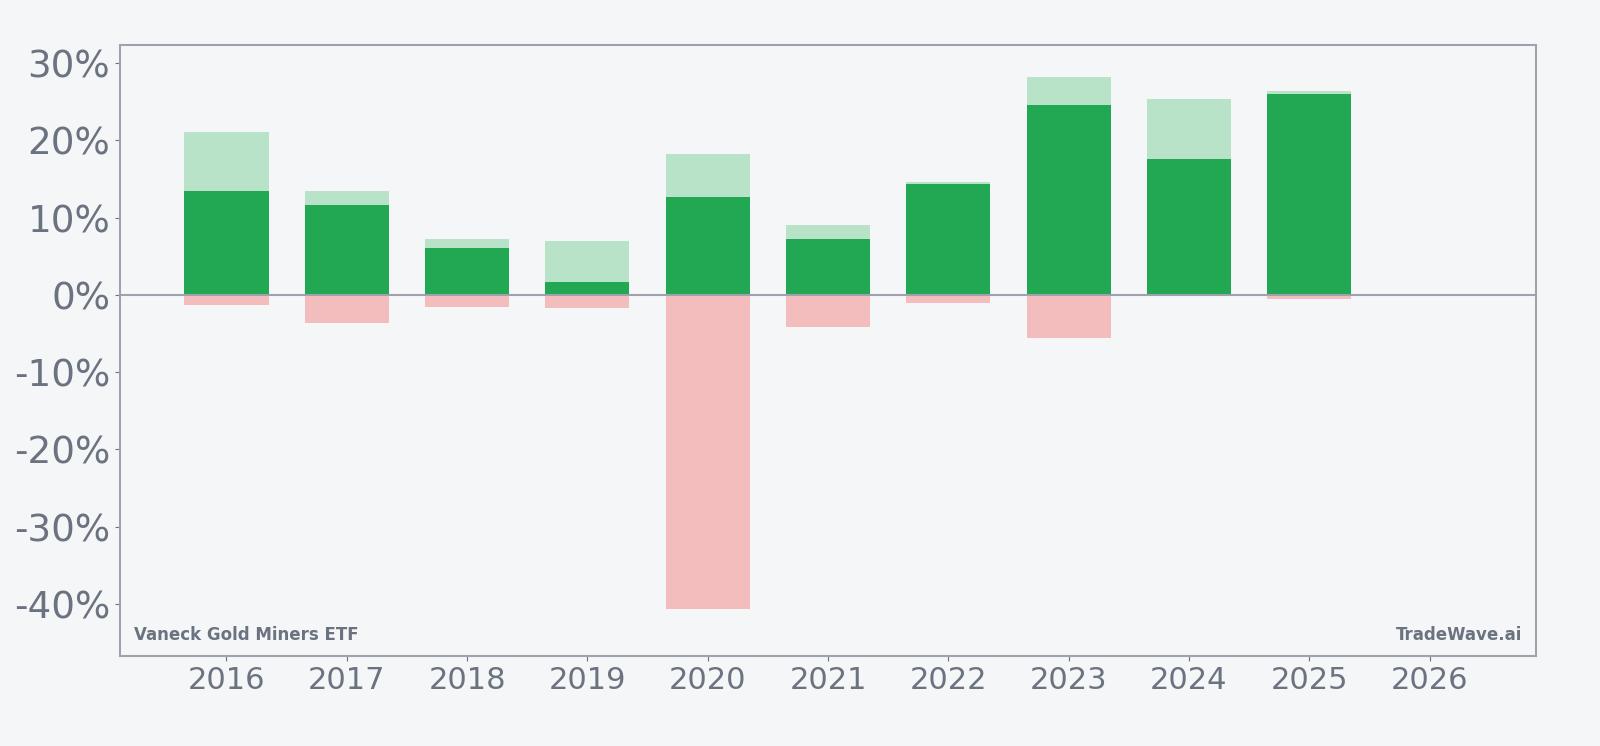
Viewed through that lens, most years cluster in a zone where maximum favorable moves significantly exceed maximum adverse moves, reinforcing the long bias of the pattern, while a few episodes such as 2020 stand out for their deep intraperiod drawdowns despite ultimately positive finishes. Taken together, the historical pattern defines the quantitative seasonal backdrop for the upcoming period.
History does not guarantee future results, and adverse excursions can be large even in winning windows, so the pattern should be treated as context rather than a forecast.
Price and near-term drivers
Vaneck Gold Miners ETF has been trading against a backdrop of heightened gold volatility, capped by bullion’s surge to a record $5,100 per ounce on Jan 26 that sent gold miner shares sharply higher.[3] That move followed a turbulent stretch in late 2025, when gold and gold miners suffered a steep one-day retreat in October before recovering into year-end, underscoring how quickly sentiment around the metal and its producers can swing.[1][2]
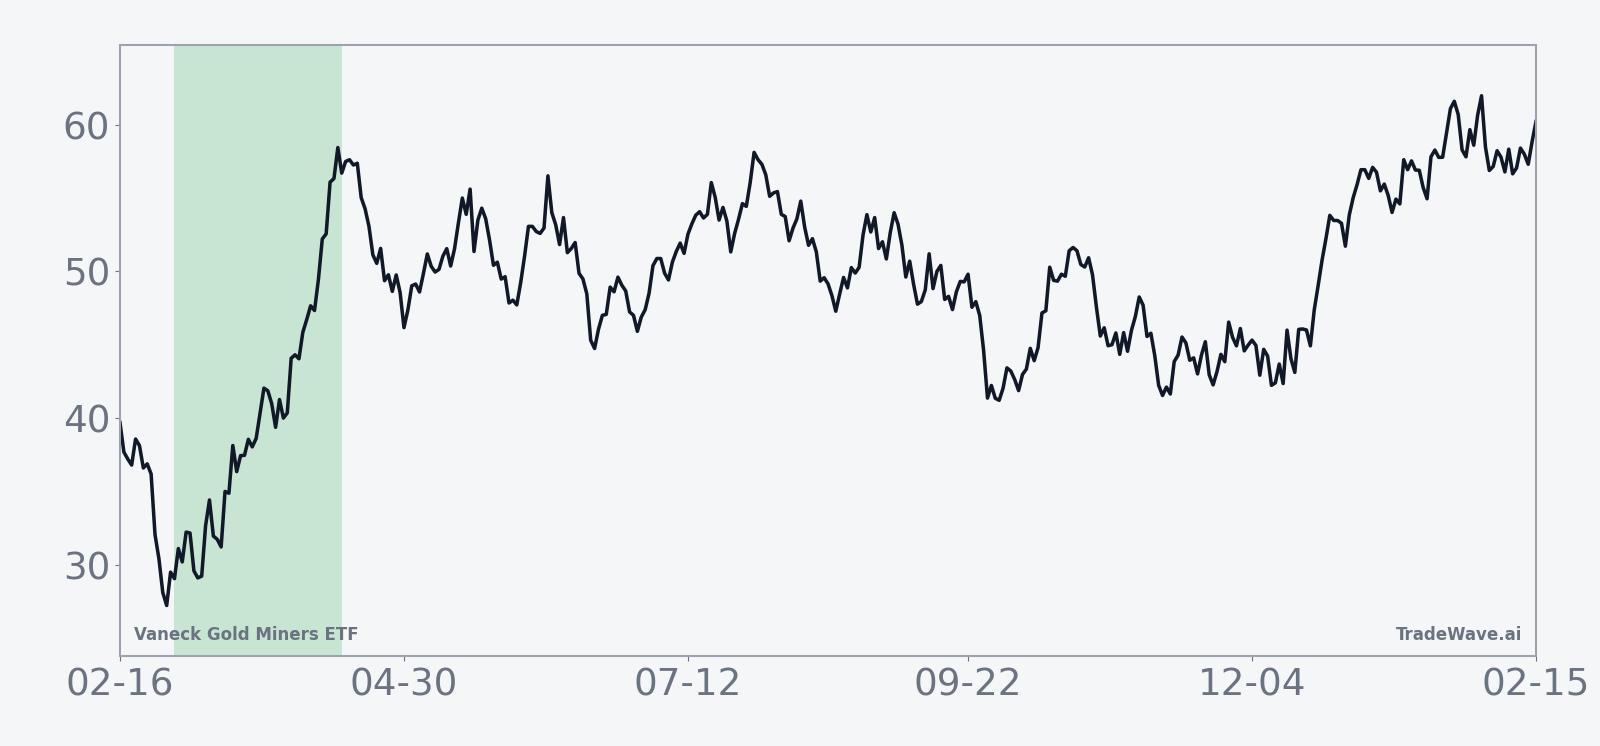
The chart below situates the latest moves in GDX within its recent 12-month trading range.
The macro backdrop for the sector has been defined by that volatility in the underlying metal. Gold’s sharp decline in October 2025, the steepest one-day drop in more than a decade, hit mining shares hard and highlighted the downside risk when safe-haven demand fades.[1] Yet analysis later that month argued that the setback did not necessarily mark the end of the move for gold and miners, pointing to structural drivers that could support the complex over a longer horizon.[2]
By early 2026, those longer-term forces appeared to reassert themselves as geopolitical tensions and demand for hedges against financial risk helped push bullion to its record high, lifting miners and ETFs such as GDX in the process.[3] Sector commentary through 2025 also noted that gold mining stocks and funds like GDX had generally outperformed physical gold, even as investor sentiment remained cautious, leaving room for further participation if flows were to broaden.[2]
For investors who use GDX as a proxy for the gold mining industry, the ETF’s behavior around these macro shocks is central to understanding how it might respond during the upcoming seasonal window. The pattern’s history of strong average gains suggests that when the macro environment is supportive, the window can amplify existing trends, while the 2020 experience shows that external shocks can still dominate the intraperiod path even if the final outcome is positive.
Macro and exposure context
Vaneck Gold Miners ETF provides diversified exposure to a basket of gold mining companies, making it a liquid way to express views on the broader gold mining industry rather than on bullion alone. As a result, its performance reflects a mix of gold price moves, company-level operating leverage, and equity market risk appetite.
In 2025, that mix produced outperformance versus physical gold, as miners benefited from higher realized prices and operating leverage even while some investors remained wary of the sector.[2] The October 2025 selloff showed that this leverage can work in both directions, with miners underperforming when bullion drops sharply, while the January 2026 record high illustrated how quickly that leverage can translate into outsized gains when the metal rallies.[1][3]
Because GDX aggregates a range of producers, it can also smooth out idiosyncratic risks tied to individual mines or balance sheets. At the same time, the ETF remains sensitive to broader equity conditions, so cross-asset volatility or shifts in risk appetite can influence how strongly any seasonal tendency expresses itself in a given year.
What to watch as the window approaches
With the 44-day seasonal window set to begin on Mar 2, the key question is how the current macro and sector backdrop will interact with a pattern that has historically favored long positions. The record bullion high in January suggests that gold-sensitive assets are already in motion, but the October 2025 episode is a reminder that sharp reversals can occur even in supportive environments.[1][3]
In the weeks ahead, traders and investors may focus on a few concrete markers. First, bullion’s ability to hold above or near the levels reached in late January will be critical for sustaining earnings momentum and sentiment for miners.[3] Second, any renewed bout of volatility similar to the October 2025 drop would test how resilient the seasonal tendency is when macro conditions turn abruptly.[1] Third, flows into and out of gold mining funds, while not detailed here, will help indicate whether broader investors are embracing or fading the recent rally.
Finally, behavior inside the window itself will offer a real-time check on the historical pattern. A path that features early strength, a mid-window pause, and a late push higher would echo the average seasonal profile, while a choppy or sharply negative start would mark a departure from the past decade’s experience. For investors using GDX as a tool to express views on gold and miners, the upcoming window is best seen as a historically favorable backdrop that still sits within a volatile, macro-driven market.
Sources
- Seeking Alpha: Gold mining stocks sink as bullion suffers sharpest drop in over a decade (Oct 21, 2025)
- MarketWatch: Gold and gold miners suffered a big one-day retreat. Why it’s still not time to sell. (Oct 10, 2025)
- Reuters: Gold miner shares jump as bullion prices hit $5,100/oz record high (Jan 26, 2026)