Gold Miners Sink With Bullion Slump, Weighing on Gold SPDR (GLD) Near Year-End
Gold SPDR is moving through a post-election seasonal stretch that has delivered steady gains in prior cycles, even as recent profit-taking and shifting macro forces keep bullion volatile.

Key takeaways
- Gold SPDR is currently in a 117-day seasonal window that begins Dec 20 and has historically been a strong period for the ETF in years after a presidential election.
- The pattern has a long trade direction, with 100% Percent Profitable across 6 winners and 0 losers in the available lookback.
- Winning years in this window have shown an Avg Profit of 9.45%, with individual gains ranging from mid-single digits to more than 20%.
- The TradeWave Ratio of 1.27 indicates that price has typically traveled meaningfully in the trade direction within the window, while a Sharpe ratio of 1.02 points to a favorable risk-adjusted profile.
- Historical maximum favorable moves have been sizable, but adverse excursions within the window have at times reached several percentage points, underscoring the need to respect drawdown risk.
- The window sits in the late part of the year after the presidential election, a phase often shaped by shifting tariff rhetoric, inflation expectations and dollar trends that directly affect gold demand.[3][7][10]
According to historical data from TradeWave.ai, this part of the election cycle has shown a distinct seasonal bias for Gold SPDR. The next section looks at how that pattern has behaved in prior years and what it implies for the current window.
Seasonal window
This seasonal window is currently underway, spanning 117 days, and has historically been a strong stretch for Gold SPDR in years after a presidential election. With GLD trading through late December, investors are weighing that backdrop against a year marked by sharp swings in bullion tied to profit-taking and shifting views on tariffs and inflation.[1][3][10]
Grouping the data by the presidential election cycle matters for gold because policy and macro themes often move in multi-year arcs. The year after the presidential election is typically a digestion phase in which new tariff regimes, fiscal priorities and regulatory signals begin to filter through to growth expectations, the dollar and real yields, all of which are key inputs for bullion and for GLD as a liquid proxy.[3][7][10]
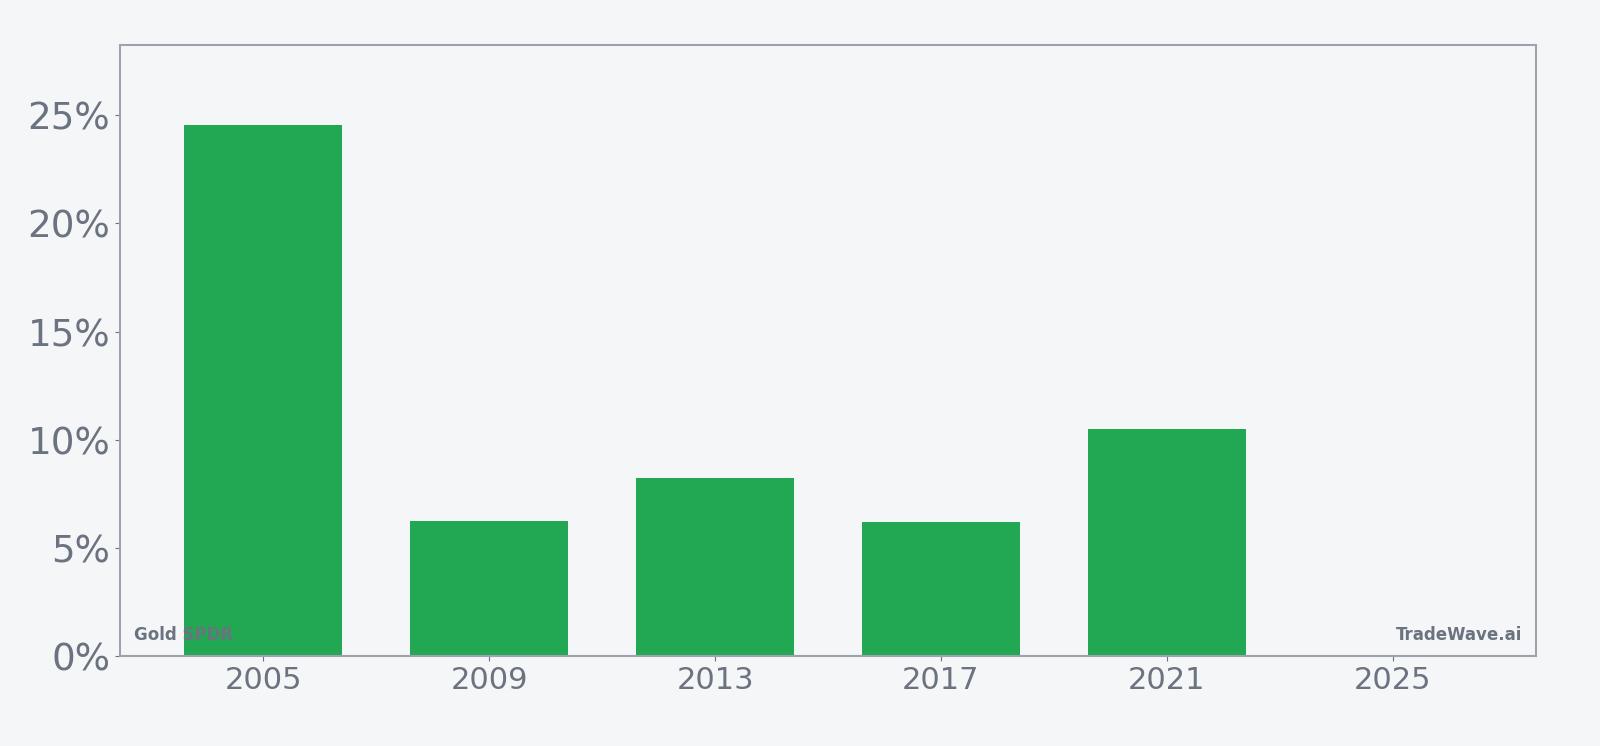
Historically, this window has aligned with a clear long bias for GLD. Across the available post-election years, the pattern shows 100% Percent Profitable, with 6 winners and 0 losers, and an Avg Profit of 9.45%, meaning that in winning years GLD has typically added high single-digit to low double-digit gains over the 117-day span. The strongest year in the sample, 2005, saw a net return of 24.57% from entry to exit, while the softer but still positive years, such as 2009 and 2017, delivered gains in the mid-single digits.
The dispersion of outcomes is visible in the per-year profile. In 2013, GLD posted an 8.24% net return over the window, with a maximum favorable move of 15.31% and a relatively shallow maximum adverse move of -1.28%, suggesting a trend that largely advanced with limited pullbacks. By contrast, 2009’s 6.26% net gain came with a maximum adverse move of -4.37%, indicating that even in a winning year the ETF experienced a notable drawdown before finishing higher.
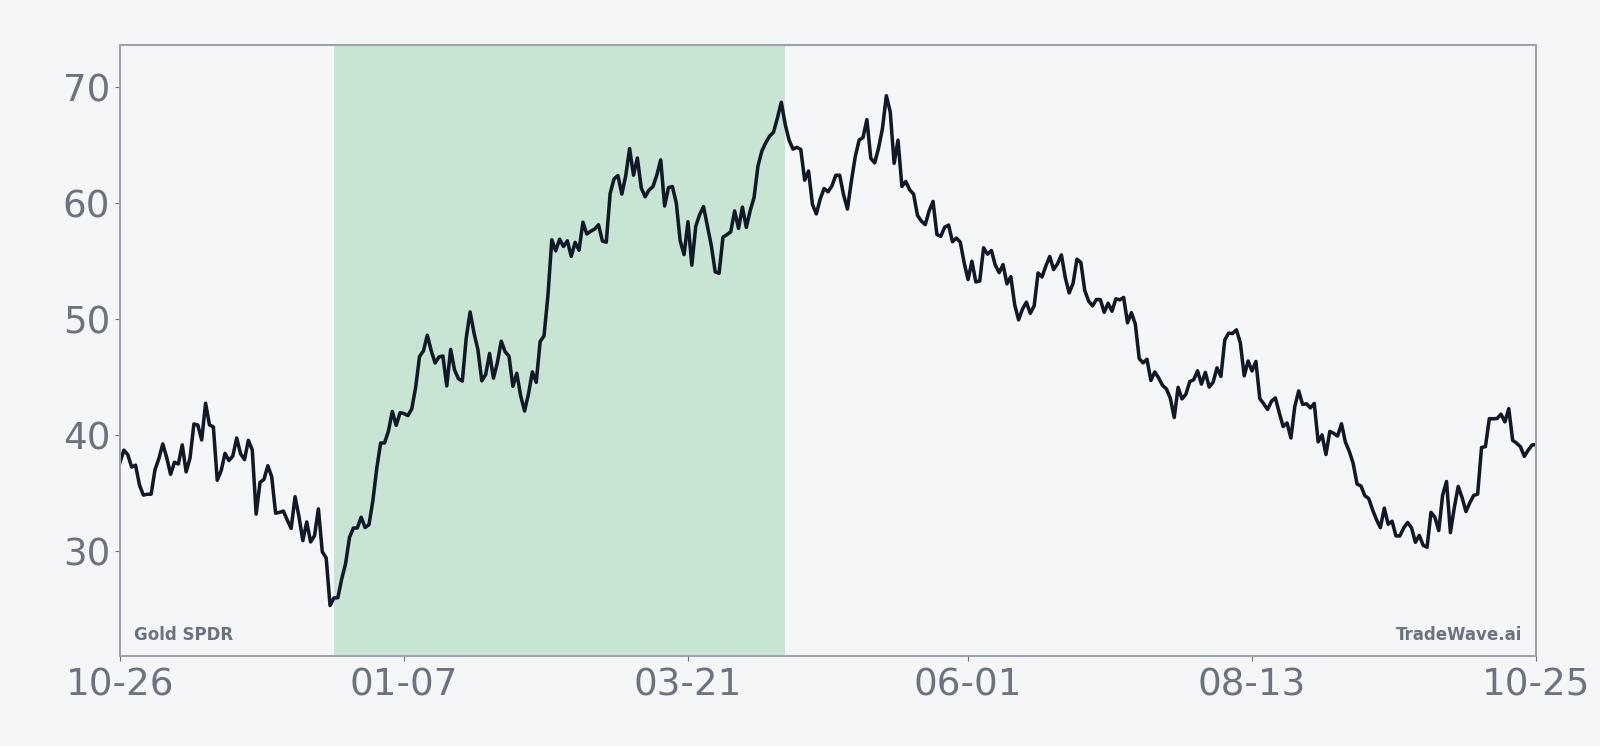
The historical seasonal average trend suggests that gains in this window tend to build steadily rather than in a single burst. In several years, including 2005 and 2021, the maximum favorable move of roughly 15% to 25% developed over the course of the window, with only modest interim setbacks, while other years showed more back-and-forth trading before the uptrend asserted itself into the exit date.
A combined view of net returns with peak run-ups and worst drawdowns highlights how upside and downside have coexisted within this otherwise strong pattern.
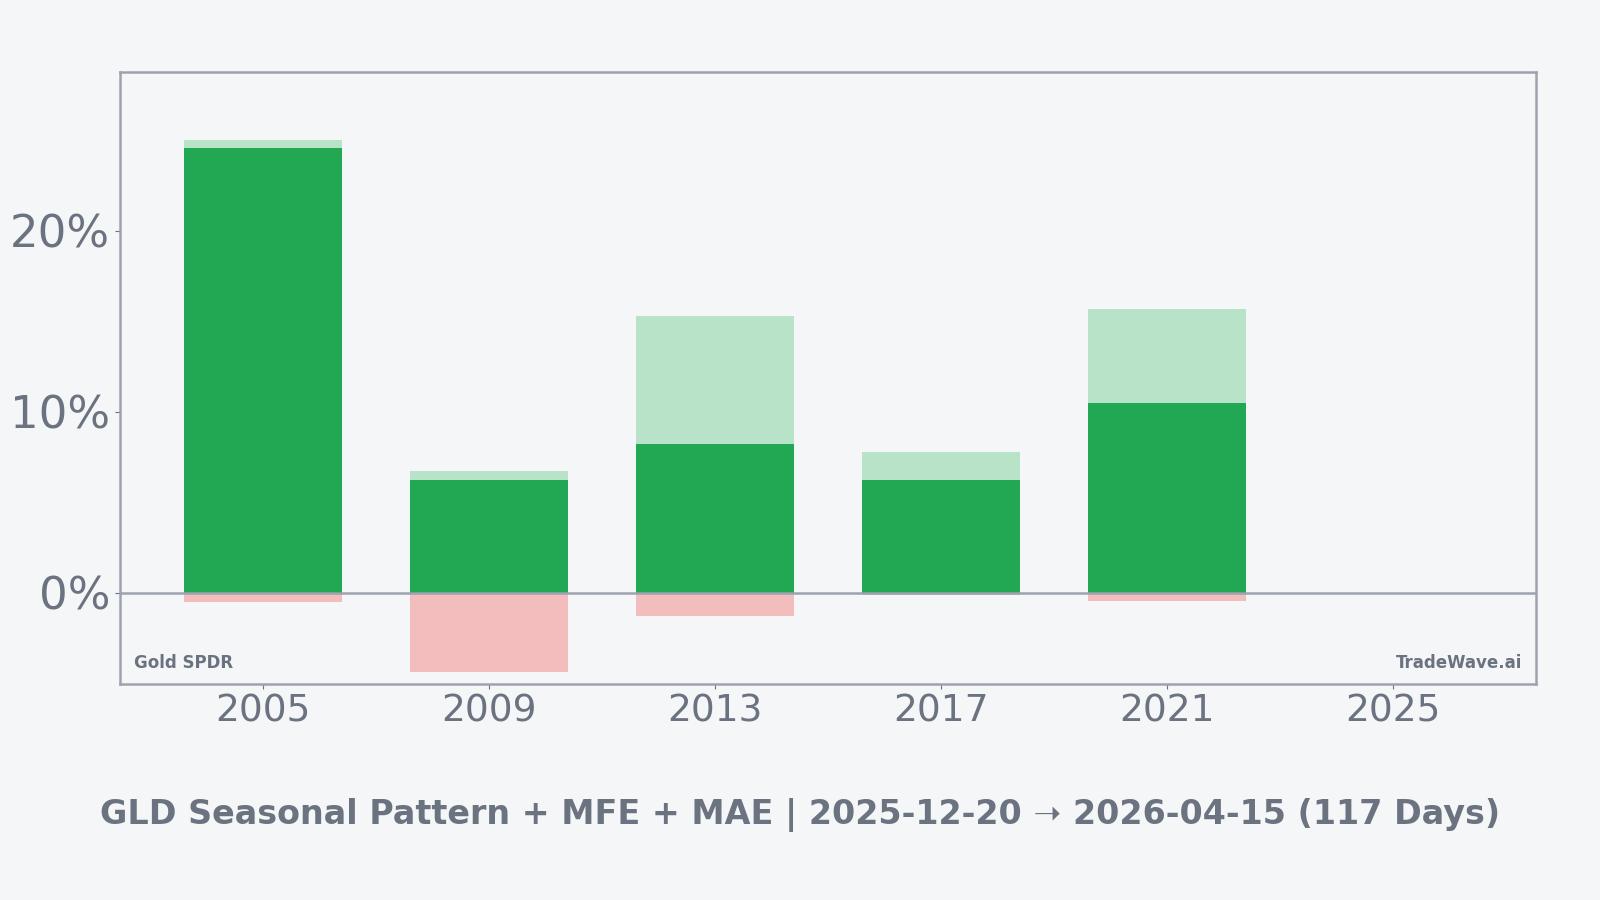
The combined net, maximum favorable move and maximum adverse move profile shows that while upside excursions have often been substantial, intraperiod downside has not disappeared. In the more powerful years, such as 2005 and 2021, GLD’s best point-to-peak moves approached or exceeded 15%, with maximum adverse moves contained near or below -1%, whereas 2009’s deeper -4.37% drawdown illustrates that even a winning window can involve uncomfortable volatility before the pattern resolves higher. Taken together, the historical pattern defines the quantitative seasonal backdrop for the current period.
History does not guarantee future results; adverse excursions can be large even in winning windows, and investors should treat the seasonal profile as context rather than a forecast.
Price and near-term drivers
GLD’s current trading sits against a backdrop of sharp moves in the underlying bullion market, including a more than 2% drop in gold futures in October as traders took profits after record highs and reacted to comments that full-scale tariffs on China would be unsustainable.[3] That episode was followed by a slump in gold mining stocks and related ETFs when bullion logged its sharpest single-day decline in over a decade, underscoring how quickly sentiment can swing even within a historically supportive seasonal phase.[1]
The chart below situates the latest move in its recent multi-month context.
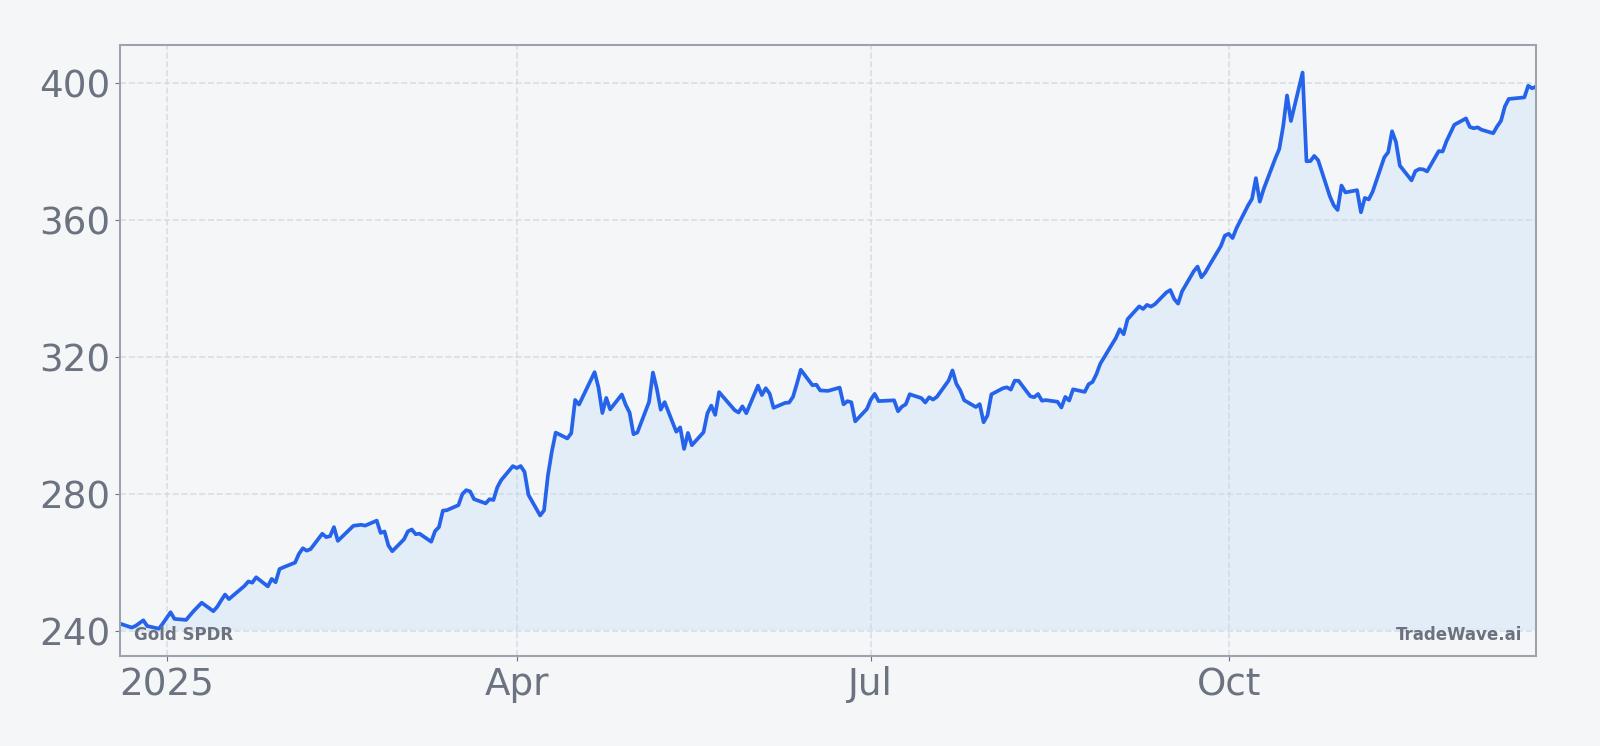
Macro forces remain central to the story. A weakening dollar has periodically boosted gold as an inflation hedge, with ETFs like GLD serving as an accessible vehicle for investors looking to diversify away from cash and bonds when real yields compress.[10] At the same time, tariff rhetoric and geopolitical uncertainty have kept safe-haven demand in flux, with headlines around trade policy and global growth repeatedly triggering bursts of buying and selling in both bullion and gold-linked equities.[3][7]
Within the gold ecosystem, mining companies and their stocks have amplified these swings. Reports of sharp declines in miners when bullion sold off, as well as company-specific developments such as efforts by major producers to resolve disputes in key jurisdictions, have fed back into sentiment around the broader gold trade and by extension GLD.[1][2][6][14] Options activity and flows into individual miners have also reflected shifting risk appetite, with periods of heavy call buying in some producers signaling speculative interest in further upside for the complex.[5][9]
All of this is unfolding as markets conclude the year after the presidential election and look ahead to the midterm election year, a transition that has historically brought changes in fiscal stance, regulatory focus and tariff policy. For gold, that can mean a different mix of drivers, from how aggressively policymakers lean on tariffs to how they balance inflation control against growth, each of which can influence the dollar, real yields and ultimately the path GLD takes within its seasonal window.[3][7][10]
What to watch
For this 117-day window, the key watchpoints are how GLD behaves around policy and macro catalysts that have historically mattered most. Traders will be monitoring tariff headlines and broader trade rhetoric for signs of renewed tension or de-escalation, given the role that prior tariff commentary has played in triggering both profit-taking and safe-haven flows in gold.[3][7] Dollar moves and real-yield expectations will remain central, since episodes of dollar weakness have tended to coincide with stronger demand for gold as an inflation hedge and have supported flows into GLD.[10]
On the market-structure side, behavior in gold miners and related equities can offer an early read on whether this seasonal pattern is tracking its historical script. Continued sensitivity of mining stocks to bullion swings, along with any renewed bouts of heavy options activity or sector-specific news, would signal that speculative interest in the gold complex remains elevated and could either reinforce or challenge the typical post-election-year tendency for GLD to grind higher.[1][2][5][6][9][14]
From a levels perspective, the historical pattern suggests that the window has room for sizable favorable moves but has also seen meaningful intraperiod drawdowns in some years. If GLD can sustain rallies on policy or macro news without revisiting the kind of deeper pullbacks seen in weaker historical years, it would be more consistent with the stronger episodes in the sample. Conversely, a pattern of repeated sharp setbacks on tariff or growth headlines would indicate that this iteration of the window is tracking closer to the more volatile side of its historical range.[1][3][7][10]
Ultimately, the seasonal data frames expectations rather than dictating outcomes. How GLD trades around upcoming policy signals, dollar moves and shifts in inflation sentiment will determine whether this year’s post-election window aligns with its historically strong profile or diverges from it, and investors will be watching that interaction closely as the calendar turns toward the midterm election year.[3][7][10]
Sources
- [1] Seeking Alpha, “Gold mining stocks sink as bullion suffers sharpest drop in over a decade” (Oct 21, 2025)
- [2] Seeking Alpha, “The Gold Standard: 5 Gold Mining Stocks To Dig Up Big Returns” (Apr 11, 2025)
- [3] Seeking Alpha, “Gold, silver slide on heavy profit-taking after Trump reassures on China” (Oct 17, 2025)
- [5] MarketBeat, “AngloGold Ashanti PLC (NYSE:AU) Given Average Rating of 'Moderate Buy' by Analysts” (Nov 30, 2025)
- [6] Seeking Alpha, “Barrick 'fully engaged and committed' to resolving dispute with Mali: report” (Mar 8, 2025)
- [7] Forbes, “Trump Tariffs, Inflation, Inflation Hedges: The 3 Biggest Gold Stocks” (Jul 26, 2025)
- [9] MarketBeat, “Stock Traders Buy High Volume of AngloGold Ashanti Call Options (NYSE:AU)” (Nov 27, 2025)
- [10] Forbes, “3 Ways To Profit As Gold Rips, Bonds Slip, Stocks Chop” (Sep 5, 2025)
- [12] MarketBeat, “Modiv Industrial (NYSE:MDV) Posts Earnings Results, Beats Expectations By $0.17 EPS” (Mar 7, 2025)
- [14] GuruFocus, “Insider Sell: Bruce Brook Sells Shares of Newmont Corp (NEM)” (Dec 4, 2025)