Caterpillar (CAT) Q3 Beat on AI Data-Center Demand Faces 2025 Tariff and Rate Headwinds
Caterpillar is entering a late-year post-election stretch that has often been favorable for the stock, even as investors weigh a 52% year-to-date surge against softer guidance, tariff headwinds and AI-driven demand for its energy equipment.

Key takeaways
- Caterpillar has moved into a 111-trading-day window that, in years after U.S. presidential elections, has historically been a strong period for the stock with a long trade direction.
- Across this post-election phase, the pattern has been profitable in 82% of years, with 9 winners and 2 losers, and average gains of 18.19% in winning years versus 13% when all years are included.
- The historical profile shows sizable upside bursts in strong years, but adverse moves have reached double digits in weaker ones, underscoring meaningful drawdown risk inside an overall positive pattern.
- The window opens as Caterpillar rides a 52% year-to-date advance, supported by AI-related energy equipment demand but tempered by guidance for softer 2025 sales and higher tariff costs.[1][3][5][7]
- Investors are concluding the year after the presidential election and heading toward the midterm election year, a transition that has often coincided with shifts in industrial demand, fiscal priorities and infrastructure spending.
According to historical data from TradeWave.ai, this late post-election stretch for Caterpillar has shown a distinct seasonal tendency in prior cycles. The next section unpacks how that pattern has behaved and how it fits alongside today’s macro and policy backdrop.
Seasonal window
This seasonal window is currently underway, spanning 111 trading days from Dec 26, and has historically been a strong stretch for Caterpillar in the year after the presidential election. The stock enters this regime after a powerful 52% year-to-date gain, leaving investors debating how much of the AI, infrastructure and energy story is already reflected in the price.[1][2]
Grouping the data by the presidential election cycle matters here because industrial demand, public-works spending and trade policy often move in multi-year waves that track the political calendar. In the year after an election, new administrations typically settle on fiscal priorities and regulatory approaches, which can shape order books for heavy-equipment makers like Caterpillar before the midterm year brings a fresh round of policy uncertainty.
The trade direction for this pattern is long, and the historical record shows a clear positive skew. Across the sample of years after presidential elections, 9 of 11 instances finished higher, producing an 82% profitable rate for the window. Average gains in winning years were 18.19%, while including the two losing years pulls the all-years average down to 13%, indicating that even the weaker outcomes have not fully offset the strength of the better ones.
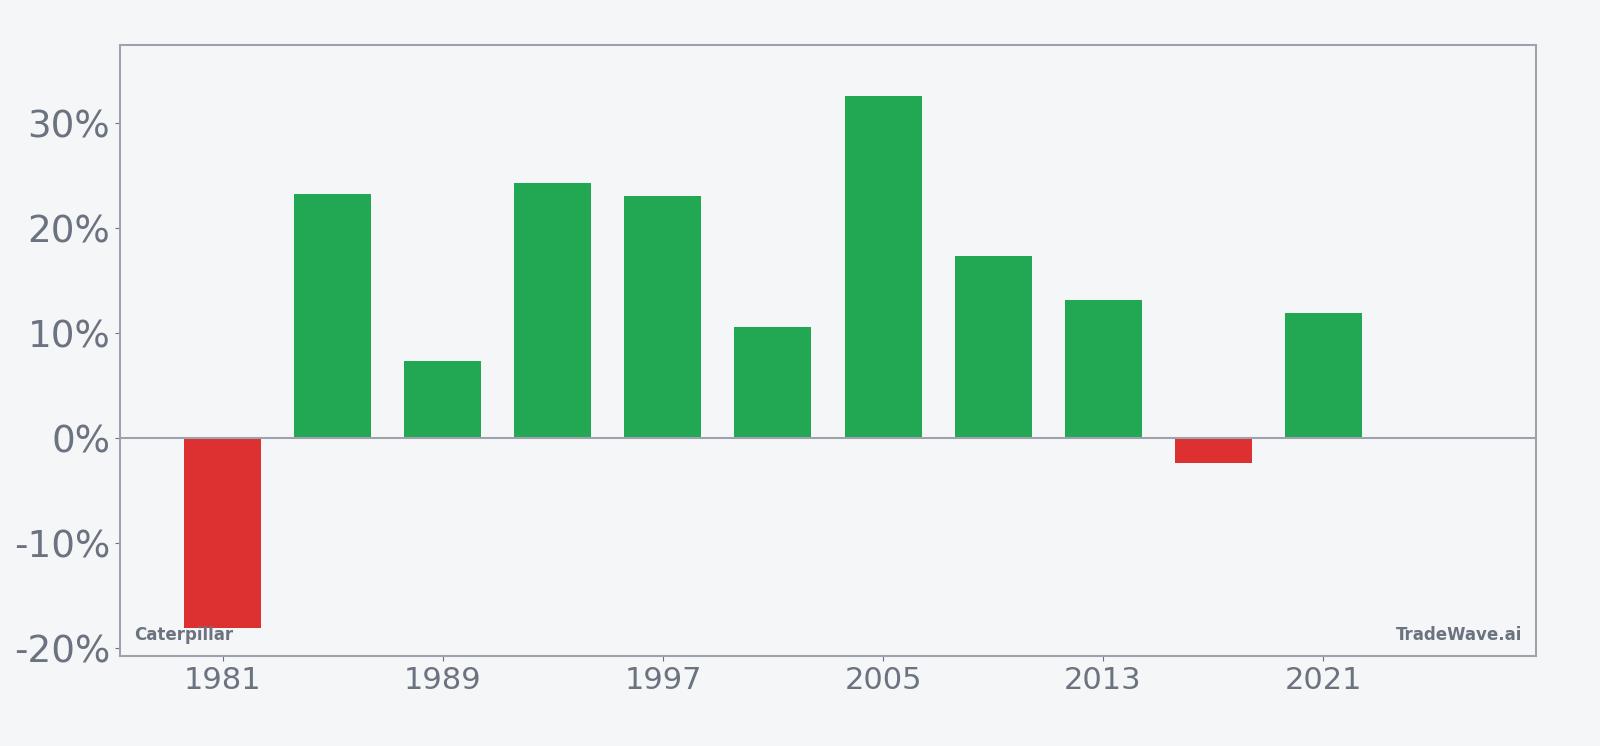
The per-year breakdown underscores how this strength has tended to show up. Some of the most robust examples include 2005, when the stock gained 32.59% during the window with a peak run-up of 36.66% and only a shallow 1.45% worst drawdown from entry, and 1993, which delivered a 24.31% net return with a 35.0% best intraperiod move and just 1.39% at worst on the downside. At the other end of the spectrum, 2017 stands out as a losing year, with a 2.3% decline despite an 11.16% best run-up and an 11.35% worst drawdown, illustrating that even in this generally favorable phase, rallies have occasionally faded into negative finishes.
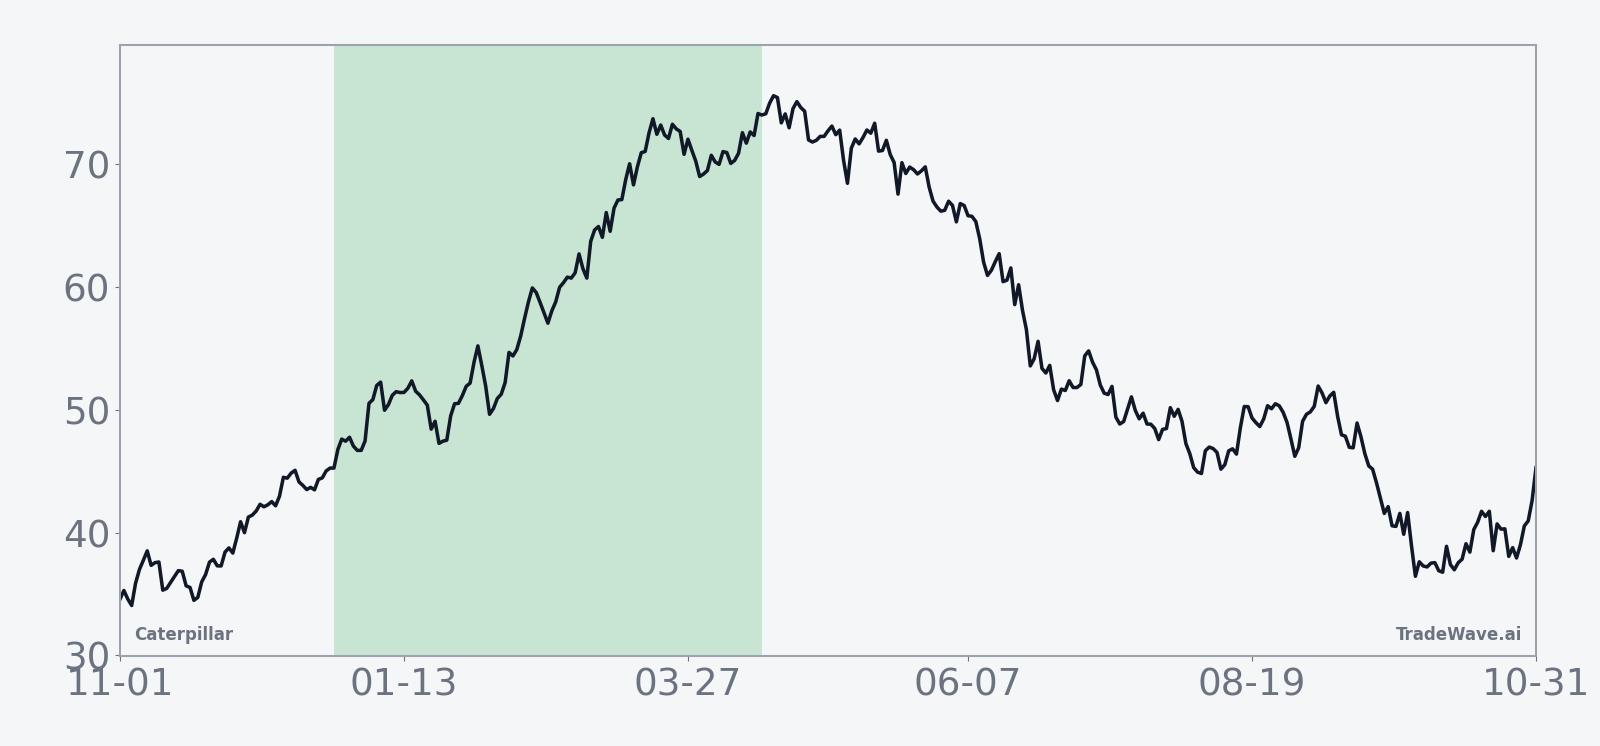
The historical seasonal trend chart suggests that returns in this window often build in stages rather than in a straight line. In many years, the stock has tended to firm early in the period, consolidate, and then see a second leg of strength later in the window, consistent with a backdrop where policy clarity and infrastructure or energy spending plans gradually filter into orders and earnings expectations.
Year-by-year net results and intraperiod swings highlight how upside and downside have coexisted inside this otherwise positive regime.

The combined net, peak favorable and worst adverse move chart shows that in most years the maximum favorable excursion has been substantial, but the worst intraperiod drawdowns have also reached into double digits at times. That mix points to a window where the long bias has historically been rewarded, yet volatility within the period has been significant enough that timing and risk management have mattered, particularly as the cycle transitions from the year after the presidential election into the midterm election year.
History does not guarantee future results, and worst adverse excursions can be large even in years that ultimately finish higher within this window.
Taken together, the historical pattern defines the quantitative seasonal backdrop for the current period.
Price and near-term drivers
Caterpillar’s strong year-to-date performance has been driven in part by a series of earnings reports that, while occasionally missing on revenue, have highlighted resilient demand in key segments. In the first quarter, the company reported revenue of $14.2 billion versus estimates of $14.6 billion and earnings per share of $4.25 versus $4.35, yet the stock rose about 3% after management struck a constructive tone on the outlook despite lower dealer inventories.[1] A mixed fourth quarter earlier in the year, with revenue slightly below expectations but earnings ahead, came with guidance for lower sales and profitability in 2025, which has kept some investors cautious about how much further margins can stretch from here.[3]
More recently, the narrative has tilted back toward growth as Caterpillar’s third-quarter results topped expectations on both revenue and earnings, helped by a boom in AI-related energy equipment demand. The company reported $17.6 billion in revenue versus estimates of $16.77 billion and earnings per share of $4.95 versus $4.52, with shares surging 12% after the release as investors focused on the role of Caterpillar’s power-generation equipment in supporting data centers.[5] Within that report, management and outside analysts pointed to sustainably growing power-generation sales, reinforcing the idea that AI infrastructure could be a multi-year driver rather than a short-lived spike.[4][5]
At the same time, macro and policy headwinds have not disappeared. High interest rates have weighed on construction and capital spending, while Caterpillar has flagged higher tariff-related expenses for 2025 as U.S. trade policy shifts, a combination that has pressured the stock at times during the year.[7] Those forces are particularly relevant as investors look ahead to the midterm election year, when debates over infrastructure, trade and fiscal discipline often intensify and can influence demand for heavy machinery and mining equipment.
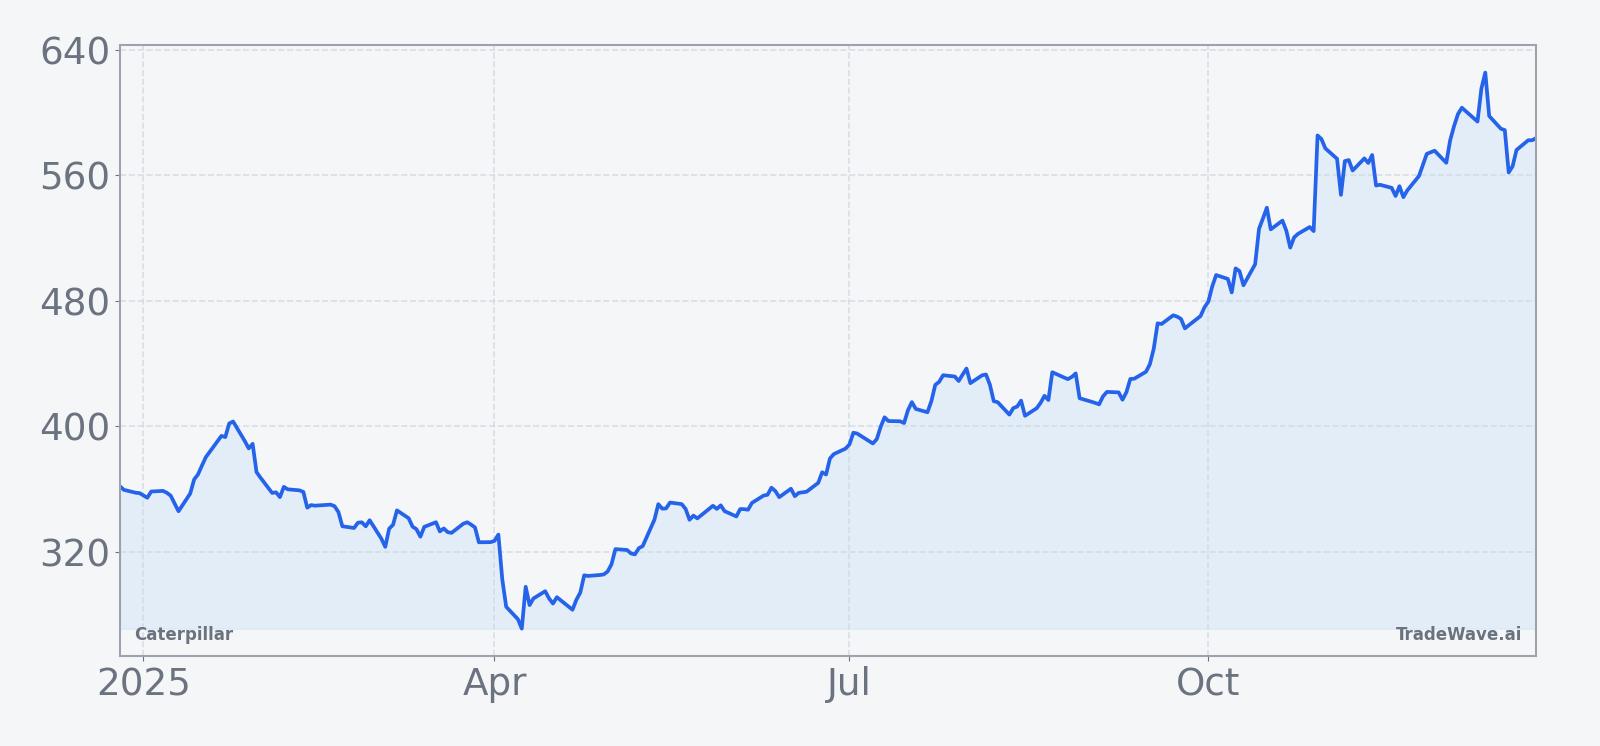
The chart below situates the latest move in its recent multi-month context.
Macro, policy and sector backdrop
Caterpillar sits at the intersection of several macro themes that are likely to remain in focus as the political calendar advances. On the positive side, the company has benefited from firm pricing and steady demand in construction and mining equipment, with its construction segment posting a 7% revenue increase in the third quarter on the back of price hikes.[5] That strength has helped offset pockets of softer activity in certain end markets and has reinforced the view that Caterpillar can lean on pricing power and mix to navigate a slower global growth environment.
On the risk side, the company has warned that higher tariffs and elevated borrowing costs are pressuring customers and could weigh on orders, particularly if global growth slows further.[7] Those concerns are amplified by management’s guidance that sales and profitability are likely to trend lower in 2025, a message that contrasts with the stock’s strong performance and the bullish narrative around AI-related energy demand.[3][5] For investors, that tension between cyclical headwinds and structural growth drivers is central to how they interpret both the current seasonal window and the transition into the midterm election year.
“Power-generation sales are expected to continue sustainably growing,” one analyst noted after Caterpillar’s recent results, underscoring how AI and data-center demand are reshaping the company’s growth profile even as traditional construction and mining cycles remain important.[4]
Sector comparisons also matter. Analysts have highlighted Caterpillar as an emerging AI play within the industrials space, reflecting its role in supplying backup power and energy infrastructure to data centers.[2] That positioning has helped the stock outperform some peers, but it also raises the stakes for execution: if AI-related orders were to slow or if policy shifts altered the economics of large-scale data-center builds, the premium investors are willing to pay for Caterpillar’s earnings could change quickly.
What to watch in this window
For the remainder of this 111-day post-election seasonal window, traders and longer-term investors will be watching how Caterpillar trades around several key themes. First, earnings updates and any revisions to 2025 guidance will be critical for gauging whether management still expects sales and profitability to drift lower or whether AI-related demand and infrastructure spending are offsetting tariff and rate headwinds.[1][3][5][7] Second, policy developments on tariffs and trade will matter, particularly as the political conversation shifts toward the midterm election year and lawmakers revisit industrial and trade priorities.
From a price-behavior standpoint, the historical pattern suggests that sustained strength within the window, especially if accompanied by only modest drawdowns, would be consistent with prior post-election years in which the long bias has been rewarded. Conversely, if the stock experiences deep intraperiod pullbacks or fails to hold rallies, it would echo the minority of losing years in the sample and could signal that macro or policy pressures are starting to outweigh the AI and infrastructure story. How Caterpillar trades through these swings will help investors judge whether this cycle is tracking the historical seasonal template or diverging from it as the market approaches the midterm election year.
Sources
- Forbes: “What’s Next For CAT Stock?” (Apr 30, 2025)
- CNBC: “This industrial giant is emerging as a big AI play, says Wells Fargo” (Nov 14, 2025)
- Forbes: “What's Next For CAT Stock After A Bleak Outlook?” (Feb 3, 2025)
- Nasdaq: “CAT to Boost Mining Technology Solutions With RPMGlobal Holdings Deal” (Oct 13, 2025)
- Reuters: “Caterpillar beats estimates as AI boom drives energy equipment demand; shares surge” (Oct 29, 2025)
- Forbes: “CAT Stock vs. Peers” (Oct 2, 2025)
- Reuters: “Caterpillar falls after raising annual tariff hit forecast” (Aug 29, 2025)
- TradeWave.ai: Company and methodology overview
- TradeWave.ai: Caterpillar (CAT) seasonal pattern viewer for 2025-12-26 window
- TradeWave.ai: Caterpillar seasonal stats summary image
- TradeWave.ai: Caterpillar seasonal trend chart
- TradeWave.ai: Caterpillar net, MFE and MAE bars chart
- TradeWave.ai: Caterpillar 12-month price chart
- TradeWave.ai: Caterpillar hero image