Coca-Cola Europacific Partners (CCEP) Rides Parent’s Q3 Beat but Faces Tariff, FX Risks
Coca-Cola Europacific Partners is approaching a year-long period that has delivered robust gains in past cycles, just as investors balance resilient earnings with cost and currency headwinds.

Key takeaways
- Coca-Cola Europacific Partners enters a 365-day seasonal window starting Dec 26 that has historically been strongly positive for long positions.
- Across the past 10 years, the pattern has been profitable in 90% of cases, with 9 winners and 1 loser.
- Average gain in winning years is 16.59%, while the all-years average including the lone loss is still 15%.
- The window’s TradeWave Ratio of 2.26 suggests price has typically traveled meaningfully in the long direction within the period.
- Historical best and worst intraperiod moves show sizable rallies but also occasional deep drawdowns, underscoring the need to respect downside risk.
- The setup arrives as the broader Coca-Cola group posts steady earnings growth but faces tariff and currency pressures that could influence how this pattern plays out.[1][4][6]
According to historical data from TradeWave.ai, this upcoming stretch for Coca-Cola Europacific Partners has shown a distinct long-side bias in prior years. The next section looks at how that seasonal backdrop fits alongside today’s fundamental and macro picture.
Seasonal window
This seasonal window begins on Dec 26, 2025 and spans 365 days. Historically, during this period, Coca-Cola Europacific Partners has shown a strong upward tendency for long positions, with gains far more common than losses.
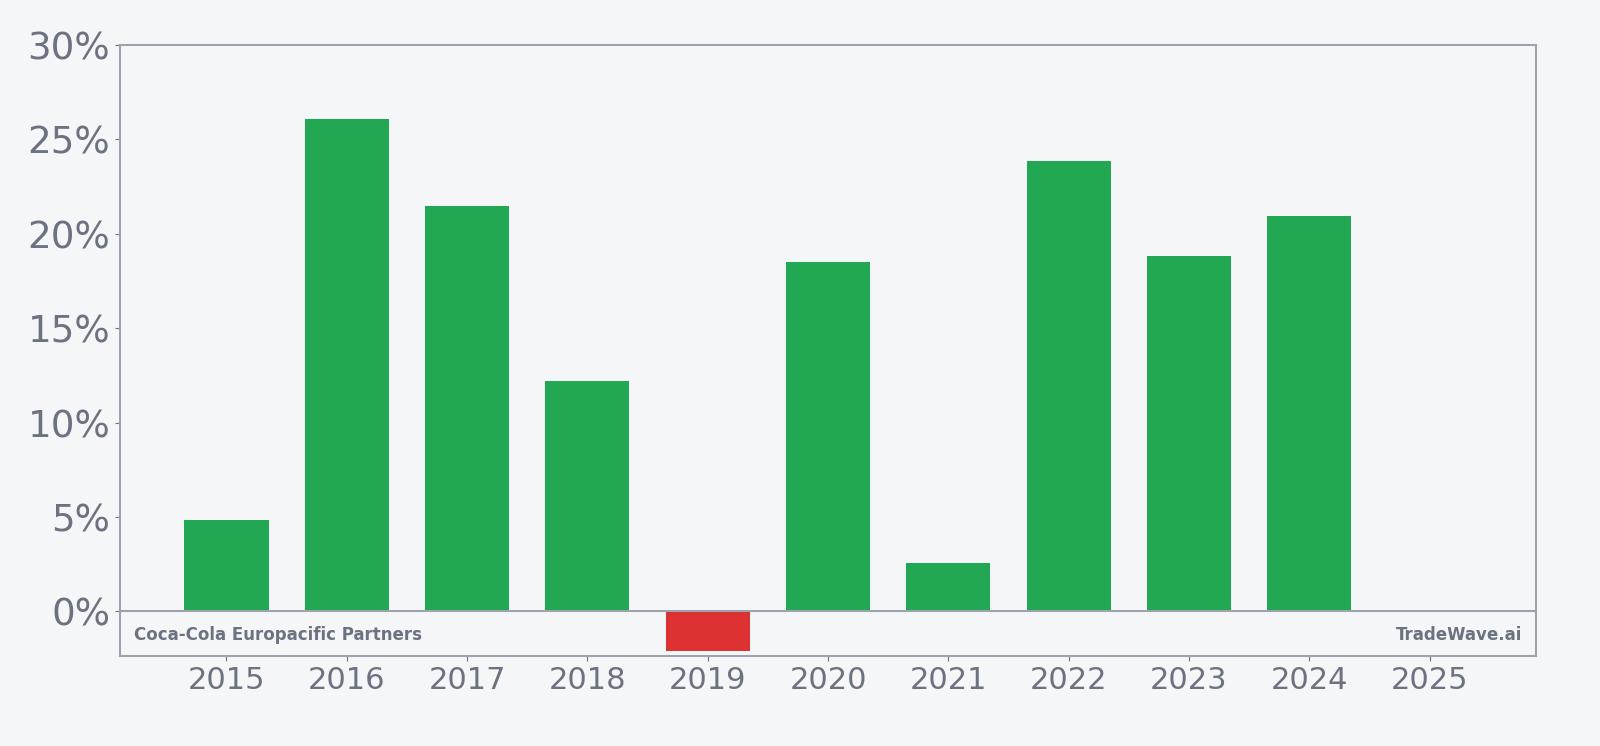
Across the 10-year sample, the long trade direction has aligned with outcomes in most years, with 9 of 10 windows finishing positive and only one modestly negative year. Average profit in winning years stands at 16.59%, while including the lone losing year brings the all-years average to 15%, indicating that even when setbacks occur, they have not historically erased the broader upside bias.
The distribution of outcomes shows that the weakest year in the sample was 2019, when the window finished down 2.08% despite a maximum favorable move of 12.8% and a deep maximum adverse move of 44.01%. At the other end of the spectrum, 2016 delivered a net gain of 26.1% with a peak run-up of 41.92% and only a 2.57% worst drawdown, illustrating how strong years have combined sizable rallies with relatively contained downside.
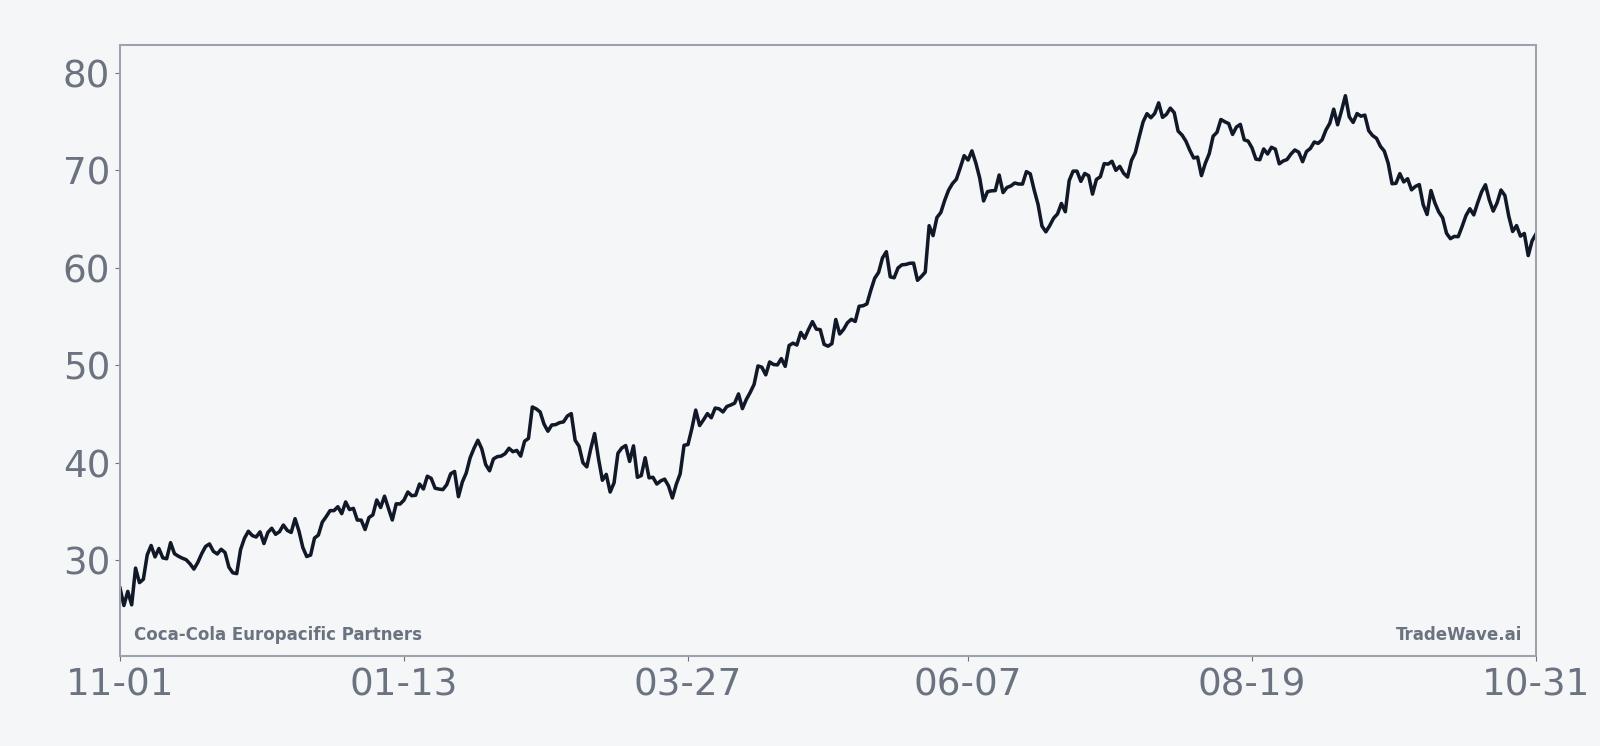
The historical seasonal trend chart suggests that gains have tended to build steadily over the course of the year, with relatively few prolonged flat stretches. While there are periods of consolidation and occasional pullbacks, the average path slopes higher, reflecting the dominance of winning years and the tendency for rallies to resume after setbacks.
A closer look at yearly net results alongside peak rallies and worst drawdowns highlights how upside and downside have interacted within this window.
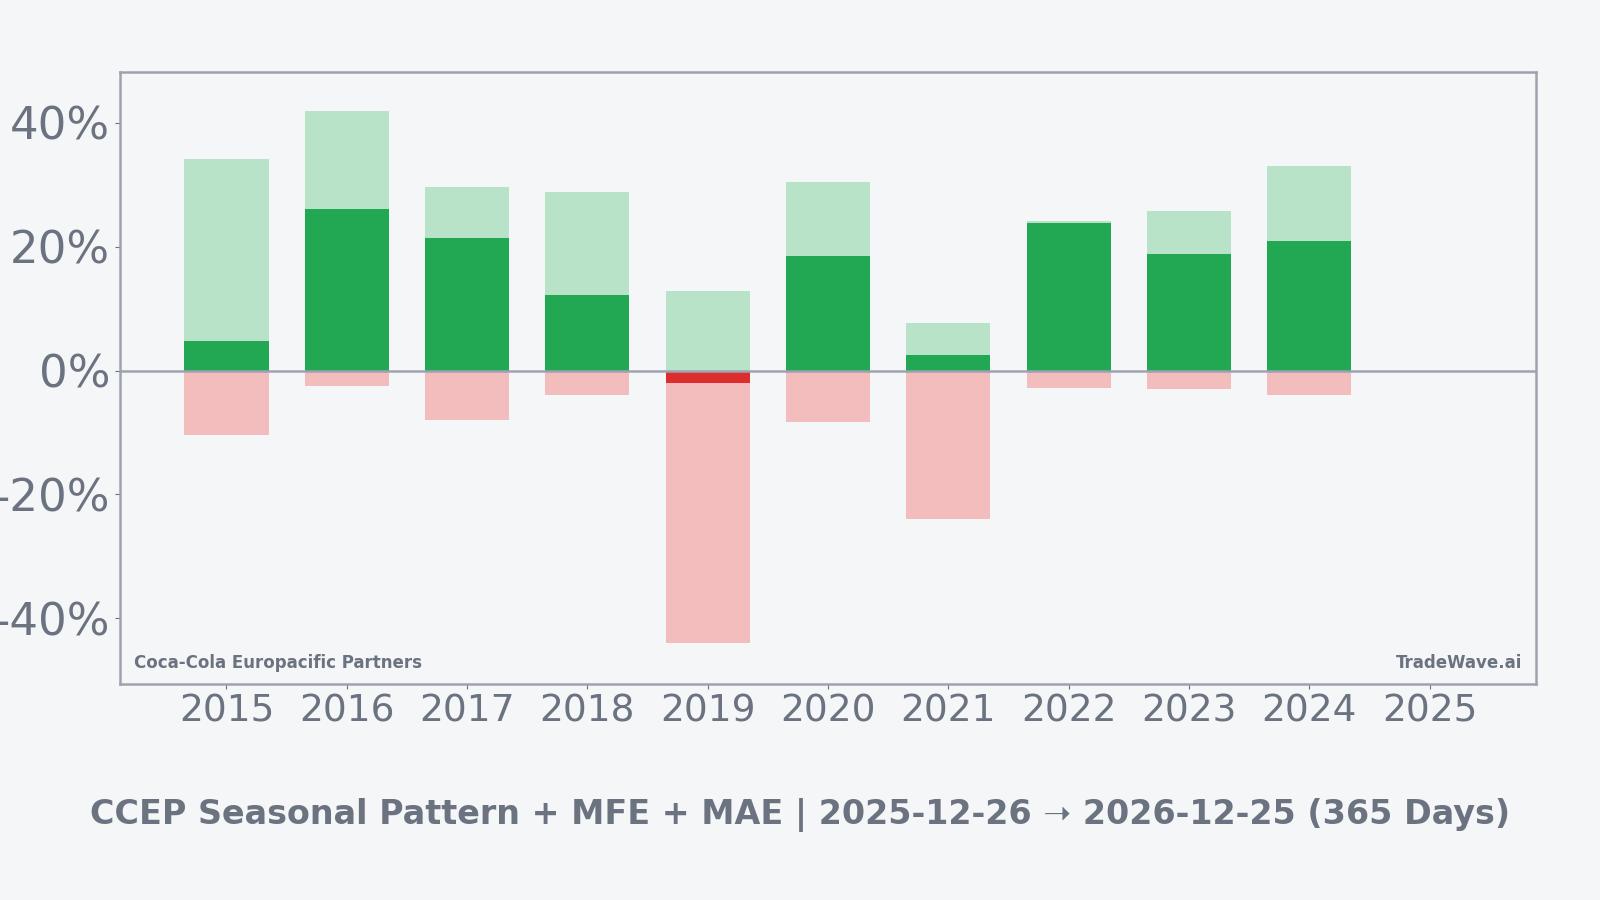
The combined net, maximum favorable move and maximum adverse move profile shows that even in strong years, the stock has often experienced meaningful drawdowns before finishing higher, while the single losing year still featured a sizable rally that ultimately faded. Taken together, the historical pattern defines the quantitative seasonal backdrop for the upcoming period.
History does not guarantee future results, and adverse excursions can be large even in winning windows, so investors should treat this pattern as context rather than a forecast.
Price and near-term drivers
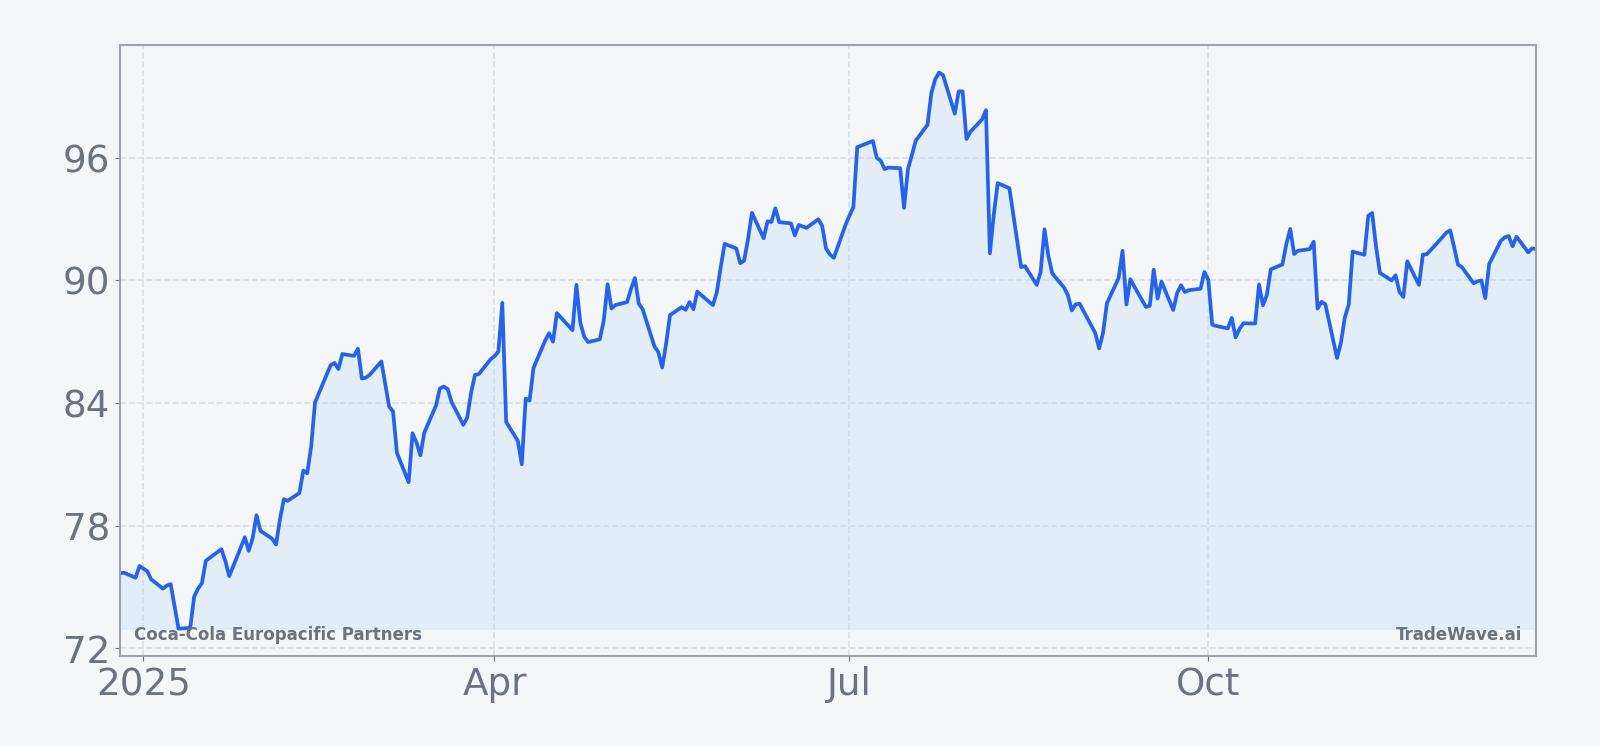
Coca-Cola Europacific Partners trades in the orbit of its U.S. parent’s stock, which closed most recently at $69.29, down 1.0% on the day and up 13.0% so far in 2025, reflecting a steady grind higher rather than a sharp re-rating.[1] That performance has been underpinned by a run of earnings beats, with Coca-Cola reporting Q2 2025 adjusted earnings per share of $0.87 versus $0.83 expected, followed by Q3 revenue and EPS that also topped forecasts as soda demand held firm.[1][5]
The chart below situates the latest move in its recent multi-month context.
Recent quarters have shown a familiar pattern for the Coca-Cola system: modest top-line growth, disciplined pricing and resilient margins. In Q2 2025, revenue of $12.5 billion was roughly in line with expectations, but higher prices and solid volume drove the earnings beat, even as shares slipped about 1% after the release.[1][4] By Q3, revenue of $12.46 billion and EPS of $0.82 again came in ahead of consensus, with the stock gaining in premarket trading as investors rewarded the steady execution.[5]
Management has kept full-year guidance relatively tight, narrowing its outlook for 2025 comparable EPS growth to around 3% from a 2024 base of $2.88, previously guided at 2% to 3%.[1] Executives have flagged currency as a headwind, warning that exchange-rate moves are likely to weigh on revenue and earnings in Q3 and across the second half of the year, a factor that could be particularly relevant for Coca-Cola Europacific Partners given its broad geographic footprint.[1]
On the macro side, higher aluminum tariffs have pushed the company to explore more affordable packaging options, including greater use of plastic bottles, in an effort to manage input costs without undermining brand equity.[6] At the same time, consumer price sensitivity has been rising, although premium offerings such as Fairlife have continued to grow, suggesting that well-positioned brands can still command pricing power even in a cautious spending environment.[2]
Analysts remain broadly constructive on the Coca-Cola complex, with a consensus Buy rating cited by FactSet via Forbes, reflecting confidence that the company can navigate cost pressures and currency volatility while maintaining modest earnings growth.[2] For Coca-Cola Europacific Partners, which is tightly linked to the parent’s bottling and distribution economics, that backdrop sets the stage for how investors may interpret the upcoming seasonal window: as a potential reinforcement of an already constructive story, or as a test of whether historical patterns can hold in a more challenging macro setting.
Earnings backdrop for the coming year
The recent earnings cadence provides important context for the seasonal pattern. Across Q2 and Q3 2025, Coca-Cola delivered revenue broadly in line with or slightly ahead of expectations and consistent EPS beats, helped by a mix of higher prices and stable demand for core beverages.[1][5] Q4 2025 results earlier in the year also showed adjusted EPS of $0.55 versus $0.52 expected, reinforcing the impression of a company that is managing through a “challenging environment” while still meeting or exceeding its own targets.[4]
Guidance for 2025 calls for comparable EPS growth of about 3%, a modest but steady pace that leaves room for upside if cost pressures ease or if premium brands continue to outgrow the broader portfolio.[1] Currency remains a swing factor, with management explicitly warning that exchange rates are likely to drag on revenue and earnings in the back half of the year, which could influence how investors respond to any deviations from the historical seasonal pattern.[1]
For Coca-Cola Europacific Partners, which operates across Europe and the Asia-Pacific region, the earnings story is closely tied to local consumption trends, input costs and FX moves. If the parent company’s guidance proves conservative and actual results come in ahead of expectations, that could provide a supportive backdrop for a historically strong seasonal window. Conversely, any disappointment on volumes or margins could test the resilience of the pattern, particularly in a year when macro and policy variables are in flux.
Macro and sector context
Tariffs and trade policy are a key macro variable for the Coca-Cola ecosystem. The increase in U.S. aluminum import tariffs to 50% has already prompted the company to consider shifting more packaging toward plastic, a move that could help contain costs but may also raise questions about sustainability commitments and consumer perception.[6] For a bottler like Coca-Cola Europacific Partners, which must manage local regulatory and environmental expectations, the balance between cost efficiency and brand positioning will be closely watched.
Currency dynamics are another important factor. Management has highlighted FX as a headwind for Q3 and the second half of 2025, with potential negative effects on both revenue and EPS.[1] Given Coca-Cola Europacific Partners’ exposure to multiple currencies across Europe and the Pacific region, swings in the euro, pound and emerging-market currencies could either amplify or dampen the historical seasonal tendency, depending on how they evolve over the coming year.
Within the broader consumer staples sector, investors have been paying close attention to price sensitivity. Reports suggest that while many consumers are trading down or becoming more cautious, premium brands such as Fairlife continue to see growth, indicating that differentiated offerings can still command higher prices.[2] For Coca-Cola Europacific Partners, the ability to lean into higher-margin products and packaging formats could be a key determinant of whether the upcoming seasonal window aligns with its historical strength.
Valuation and positioning
While precise valuation metrics for Coca-Cola Europacific Partners are not detailed in the available data, the broader Coca-Cola group’s steady share-price gains and consensus Buy rating suggest that investors are willing to pay a premium for predictable cash flows and resilient demand.[1][2] That backdrop can cut both ways for a seasonal pattern: a stock that is already well owned and fairly valued may have less room for multiple expansion, but it can also benefit from defensive inflows if macro volatility rises.
For investors who track seasonality, the key question is how much of the historical pattern is already embedded in expectations. The strong 10-year track record for this window, combined with a relatively stable earnings outlook, may encourage some market participants to lean into the long-side bias, while others may see it as a reason to be more patient, waiting to see whether early-year price action confirms the typical path.
What to watch as the window opens
As the Dec 26 start date approaches, several markers will help indicate whether Coca-Cola Europacific Partners is tracking its historical script. First, earnings and guidance updates from the broader Coca-Cola group will be critical, particularly any revisions to the 2025 EPS growth outlook or commentary on currency and tariff impacts, which could either reinforce or undercut the supportive seasonal backdrop.[1][4][6]
Second, traders will be watching how the stock behaves around pullbacks. The historical record shows that even winning years have featured meaningful intraperiod drawdowns before finishing higher, so the depth and speed of any early declines within the window will be an important test of whether downside remains contained or begins to resemble the more severe adverse moves seen in 2019.
Third, key price zones on the chart will matter. Sustained strength that keeps the stock in an upward channel, with shallow corrections and quick recoveries, would be more consistent with the typical seasonal pattern. By contrast, a break of recent support levels accompanied by weaker earnings or guidance would suggest that macro and company-specific forces are overpowering the historical tendency.
Finally, sector and macro signals around consumer demand, input costs and FX will shape how investors interpret each move. Evidence that consumers are holding up, that premium brands continue to grow and that tariff or currency pressures are manageable would align with the pattern’s long-side bias. A deterioration on any of those fronts would raise the odds that this year’s window diverges from the past, underscoring why seasonality is best used as a framework rather than a forecast.
Sources
- [1] Yahoo Finance, "Coca-Cola's Q2 Profits Surpass Estimates While Sales Fall Short" (Jul 22, 2025).
- [2] CNBC, "Coca-Cola is about to report earnings. Here's what to expect" (Feb 11, 2025).
- [3] Reuters, "Coca-Cola HBC beats quarterly revenue growth estimates" (Apr 30, 2025).
- [4] Bloomberg, "Coca-Cola’s Higher Prices and Volume Drive Earnings Beat" (Feb 11, 2025).
- [5] Reuters, "Coca-Cola tops quarterly revenue estimates on steady soda demand" (Oct 21, 2025).
- [6] Reuters, "Coca-Cola plans cane-sugar Coke as higher prices boost profits" (Jul 22, 2025).
- [7] Forbes, "Is Coca-Cola Stock About To Pop?" (Apr 14, 2025).
- [8] TradeWave seasonal trend chart for CCEP (accessed Dec 25, 2025).
- [9] TradeWave bars MAE/MFE chart for CCEP seasonal window (accessed Dec 25, 2025).
- [10] TradeWave per-year net return bars for CCEP seasonal window (accessed Dec 25, 2025).
- [11] TradeWave 12-month price chart for CCEP (accessed Dec 25, 2025).
- [12] TradeWave summary stats for CCEP seasonal pattern (accessed Dec 25, 2025).