Stable Oil Prices and Gas Demand Tailwinds Support Oneok (OKE) Midstream Outlook
Oneok is moving through a 103-day midterm-election-year stretch that has historically favored gains, just as investors weigh energy demand, dividends and the policy backdrop.
Key takeaways
- Oneok is in a 103-day seasonal window that begins Jan 10 and has historically been a strong period for the stock in midterm election years.
- The pattern groups the last 7 midterm election years and shows a long trade direction, aligning with a constructive backdrop for energy infrastructure names.
- Across those seven midterm years, the window was profitable 100% of the time, with 7 winners and 0 losers.
- Average profit in winning years was 13.63%, with a cumulative gain of 142% and an annualized return of 13.46% over the sample.
- The TradeWave Ratio of 1.88 and Sharpe ratio of 1.81 point to historically strong upside moves relative to volatility during this specific window.
- Intraperiod swings have still been meaningful in some years, underscoring that even historically favorable windows can feature sharp drawdowns before recovering.
According to historical data from TradeWave.ai, this midterm-election-year stretch has shown a distinct seasonal bias for Oneok, separate from its usual calendar patterns. The next section looks at how that election-cycle behavior has lined up with past price moves.
Seasonal window
This seasonal window is currently underway, spanning 103 days from Jan 10, and has historically been a strong stretch for Oneok in midterm election years. With the stock trading inside this regime, investors are weighing how a favorable seasonal backdrop might intersect with the company’s role as a dividend-paying midstream operator in a market focused on energy demand and income.[4]
Grouping results by the presidential election cycle matters here because midterm election years often feature shifting policy expectations, regulatory debates and spending decisions that can influence energy infrastructure demand and risk appetite. For a pipeline and storage operator like Oneok, that mix of policy and macro signals has historically interacted with seasonality in a different way than in standard calendar-year studies, which is why this midterm-year lens is useful for context.
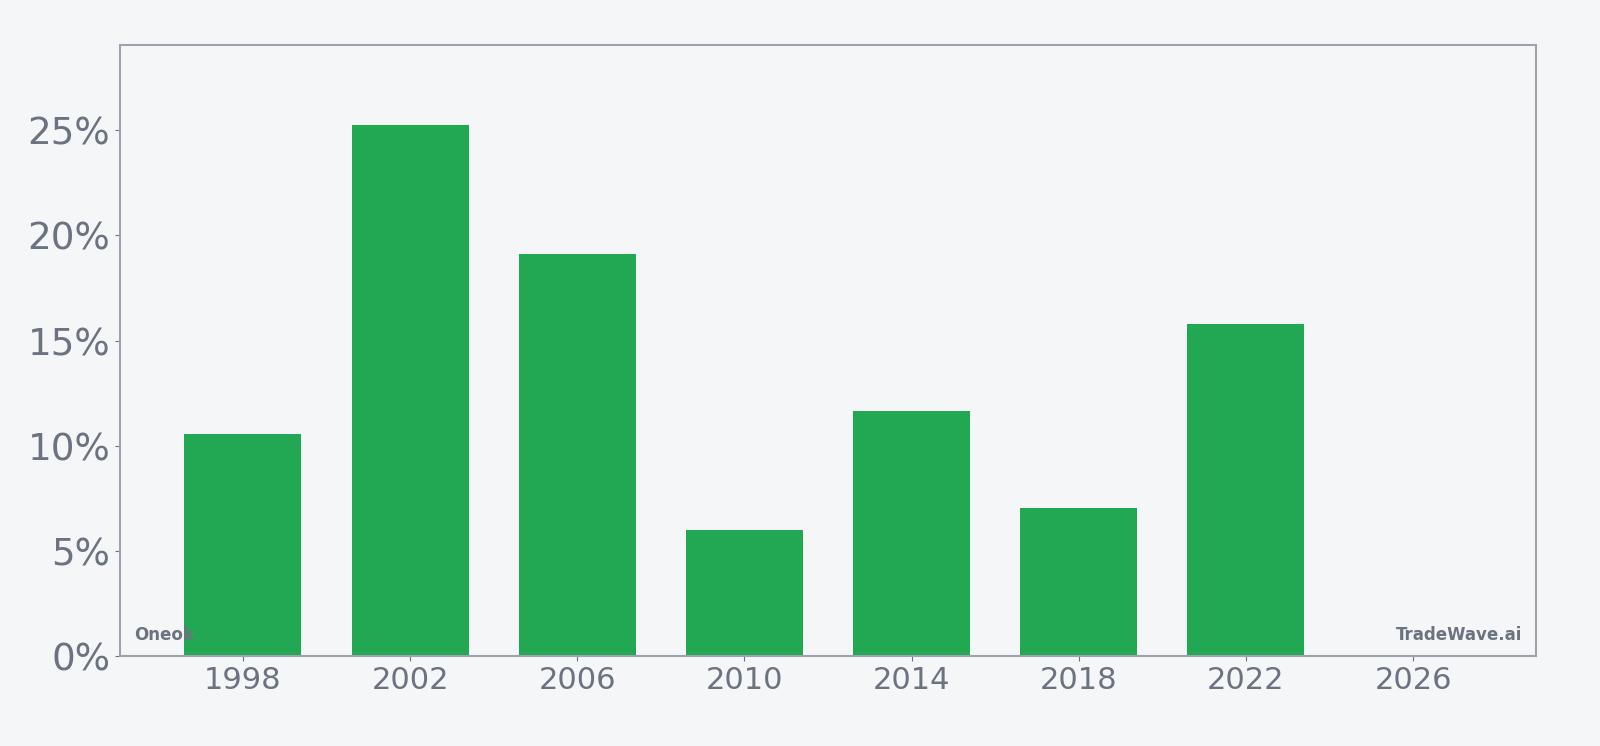
Historically, this long-direction pattern has been unusually consistent: across the last seven midterm election years, the window has been profitable in every case, with 7 winners and 0 losers. Average profit across those winning years is 13.63%, with a cumulative gain of 142% and an annualized return of 13.46%, suggesting that the typical outcome has been a double-digit advance rather than a marginal drift.
The per-year breakdown shows how that strength has played out in different macro backdrops. The strongest year in the sample was 2002, when the window produced a net return of 25.27%, while 2010 was the softest outcome with a still-positive gain of 5.99%. In 2022, the pattern delivered a 15.79% net return, with the stock’s best intraperiod move reaching 25.47% above the entry level before settling back by the end of the window.
The historical seasonal trend line suggests that gains have tended to build relatively steadily through the window rather than arriving in a single spike, although individual years show variation around that average path. The cumulative return profile indicates that the pattern’s strength is not confined to one or two outlier years but instead reflects repeated positive outcomes across different cycles.
Intraperiod swings, captured by best and worst excursions, help frame the upside and downside ranges that have appeared inside this window.
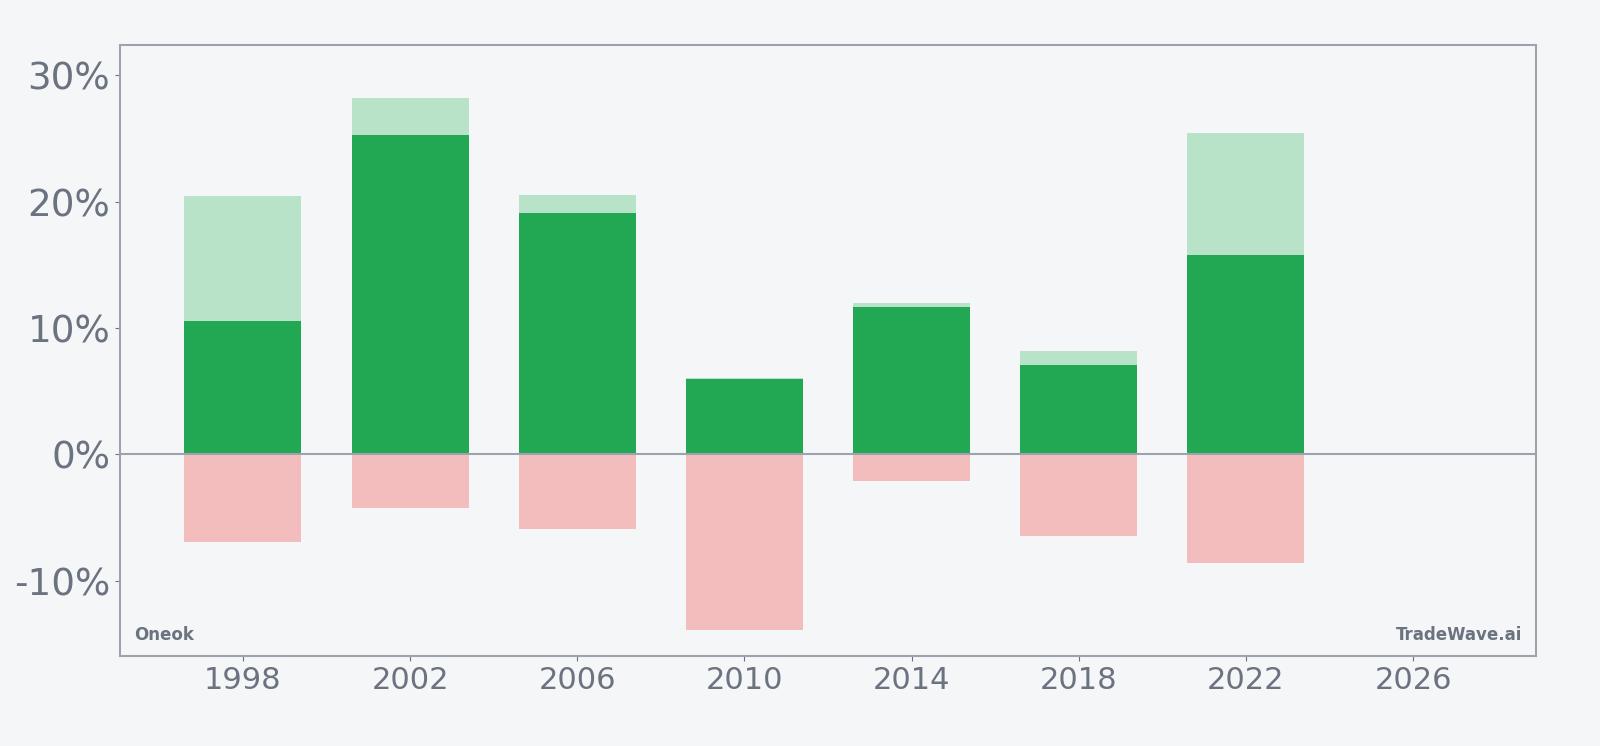
The bar chart combining net results with peak favorable moves and worst drawdowns shows that even in winning years, Oneok has often experienced meaningful pullbacks before finishing higher. For example, 2010 saw a maximum adverse move of 13.92% below the entry level despite ending the window with a 5.99% gain, while 1998 and 2022 both featured double-digit peak rallies alongside drawdowns of 6.96% and 8.6% respectively. Taken together, the historical pattern defines the quantitative seasonal backdrop for the current period.
History does not guarantee future results, and worst-case intraperiod drawdowns have at times been large even in years that ultimately finished higher.
Price and near-term drivers
Specific real-time pricing data for Oneok on Jan 12 is not available in this dataset, but the stock’s setup is being viewed through the lens of its role as a dividend-paying energy infrastructure name and its place in investors’ income portfolios.[4] The company has been highlighted alongside other long-term dividend holdings, reflecting a market that is still searching for stable cash flows in a higher-for-longer rate environment.[4]
On the fundamental side, Oneok reaffirmed solid 2025 guidance, signaling operational strength and a constructive outlook for volumes and cash generation.[1][11] That guidance sits against a macro backdrop of rising U.S. natural gas demand and relatively stable oil prices, which together have supported interest in midstream operators that move and store hydrocarbons rather than taking direct commodity price risk.[1] Sector commentary has emphasized that pipeline and storage assets can benefit from this demand trend, particularly when paired with attractive yields.
Energy infrastructure more broadly has been framed as a way to participate in the natural gas build-out tied to data centers and industrial demand, with some analysts pointing to elevated dividend yields across the group.[2] For Oneok, that narrative intersects with the current seasonal window: a stock that investors already view as a potential long-term income holding is trading through a historical pattern that has, in prior midterm election years, tended to reward patience over a roughly three-and-a-half-month span.
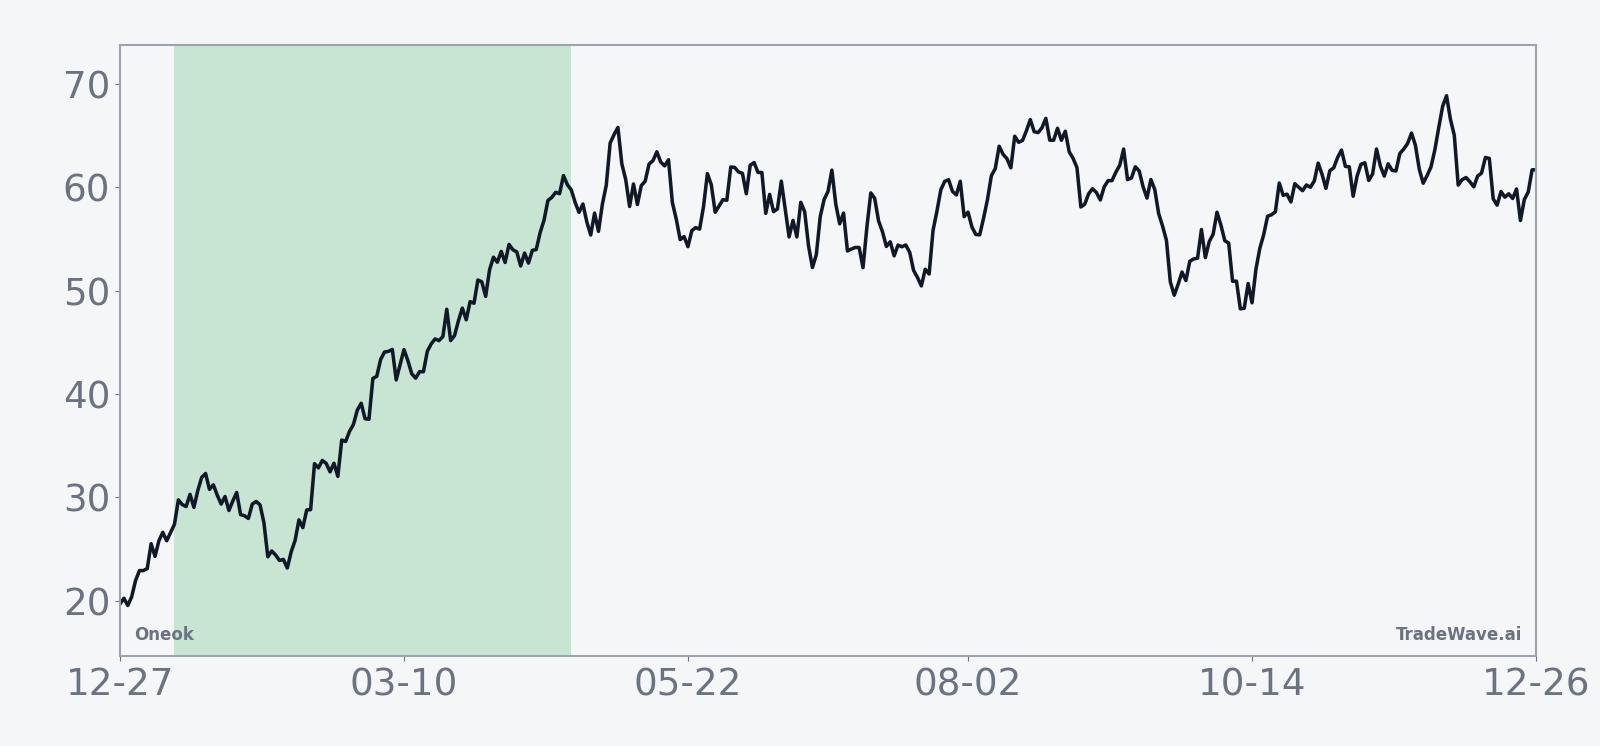
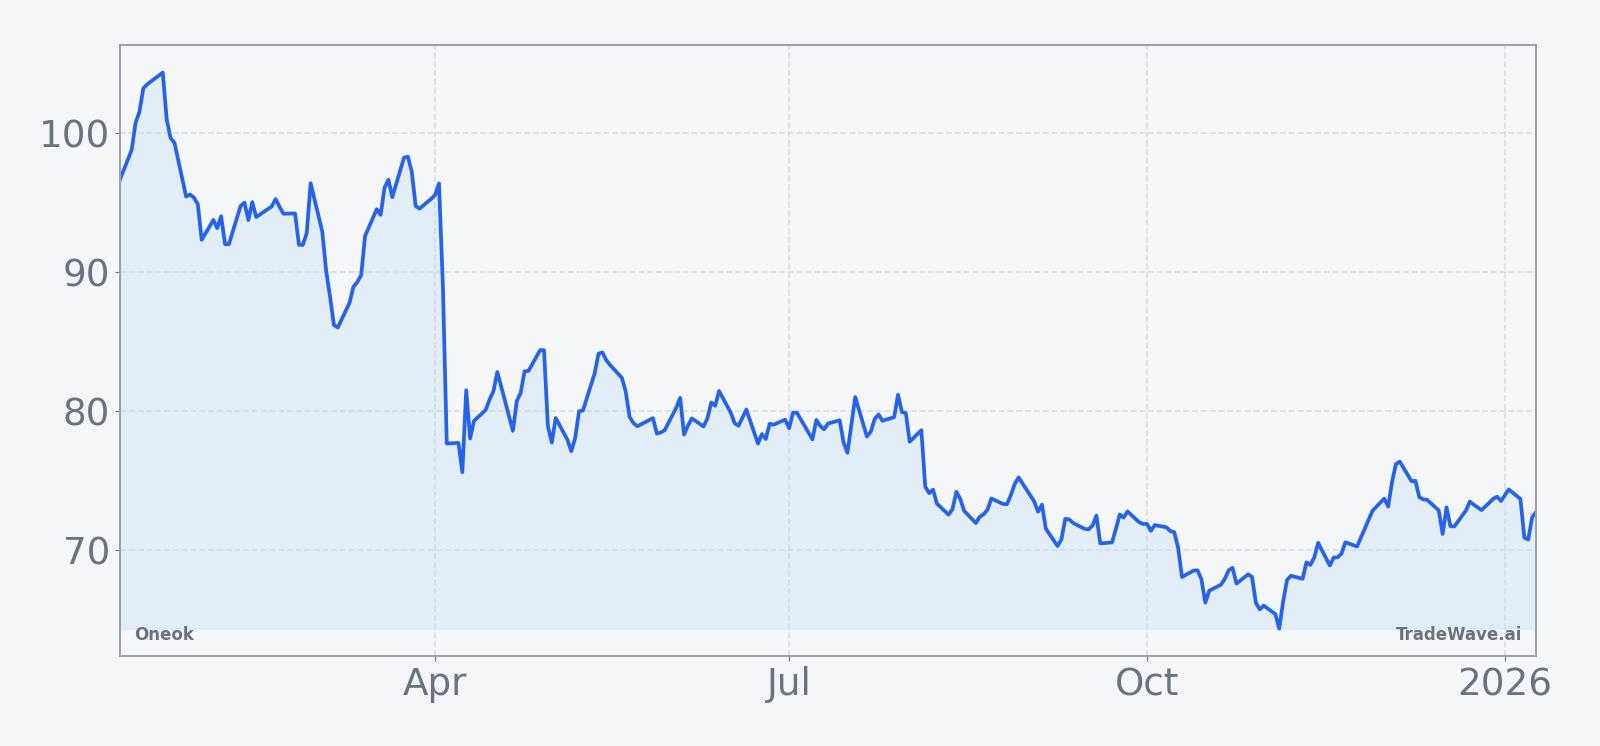
The chart below situates Oneok’s latest trading range within its recent 12-month path.
Macro and policy backdrop
The midterm-election-year context adds another layer to the story. Midterms often bring debates over energy policy, infrastructure permitting and environmental regulation, all of which can influence sentiment toward pipeline operators. Rising U.S. natural gas demand, tied to power generation and industrial use, has been a key macro theme, and stable oil prices have helped keep attention on transport and storage capacity rather than on commodity volatility alone.[1]
Within the energy infrastructure sector, Oneok’s footprint in gathering, processing and transportation positions it to benefit from incremental volumes if demand projections hold.[2] At the same time, any shifts in regulatory tone or fiscal priorities during the midterm cycle could affect how quickly new projects move forward, which in turn can shape growth expectations for companies across the space.
What to watch
For this 103-day window, traders and longer-term investors alike will be watching how Oneok behaves relative to its historical midterm-year pattern. Sustained strength through the bulk of the window, particularly if accompanied by steady volumes and supportive commentary on natural gas demand, would be consistent with the past tendency toward double-digit gains. A deeper or more persistent drawdown than in prior cycles, especially if tied to policy headlines or a shift in demand expectations, would mark a departure from the historical script.
Key checkpoints include upcoming updates on U.S. natural gas consumption and any company commentary that revisits or refines the 2025 guidance that has underpinned the constructive fundamental view so far.[1][11] Investors will also be monitoring broader energy infrastructure sentiment, including how dividend-focused buyers respond to any changes in interest-rate expectations or sector-specific news.[2][4] How Oneok trades across these catalysts, inside a window that has historically been favorable, will help clarify whether the midterm-election-year pattern is reinforcing or being overridden by the current macro and policy cycle.