ResMed (RMD) Sentiment Tracks Broader Healthcare Pullback on Policy and Pricing Concerns
ResMed is moving through a long seasonal stretch that has delivered robust gains in every year of the past decade, giving investors a bullish historical backdrop to weigh against fundamentals and sector sentiment.

Key takeaways
- ResMed is in a 200-day seasonal window that began on Jan 10, 2026 and has historically been favorable for long positions.
- Across the past 10 years, this window was profitable in 100% of cases, with 10 winners and 0 losers.
- Average profit in winning years was 17.71%, with a median gain of 19.61% and cumulative return of 398% over the sample.
- The TradeWave Ratio of 2.8 indicates that price has typically traveled meaningfully in the trade direction within the window.
- Historical best-case moves have been large, but adverse excursions within the window have at times reached nearly 30% from entry, underscoring drawdown risk.
- Investors will be watching how ResMed’s fundamentals and sector flows line up with this bullish seasonal backdrop through mid-2026.
According to historical data from TradeWave.ai, this part of the calendar has shown a distinct pattern for ResMed in prior years, and that long-term backdrop is now in focus as the latest window gets underway.
Seasonal window
This seasonal window is currently underway, spanning 200 trading days from Jan 10, 2026, and has historically been a strong stretch for ResMed on the long side. With the stock trading through the early days of this regime, investors are weighing how a decade of bullish seasonal behavior might intersect with the company’s next few quarters and broader healthcare sentiment. The combination of a consistently positive track record and occasionally deep intraperiod drawdowns makes this window particularly relevant for risk management as well as return expectations.
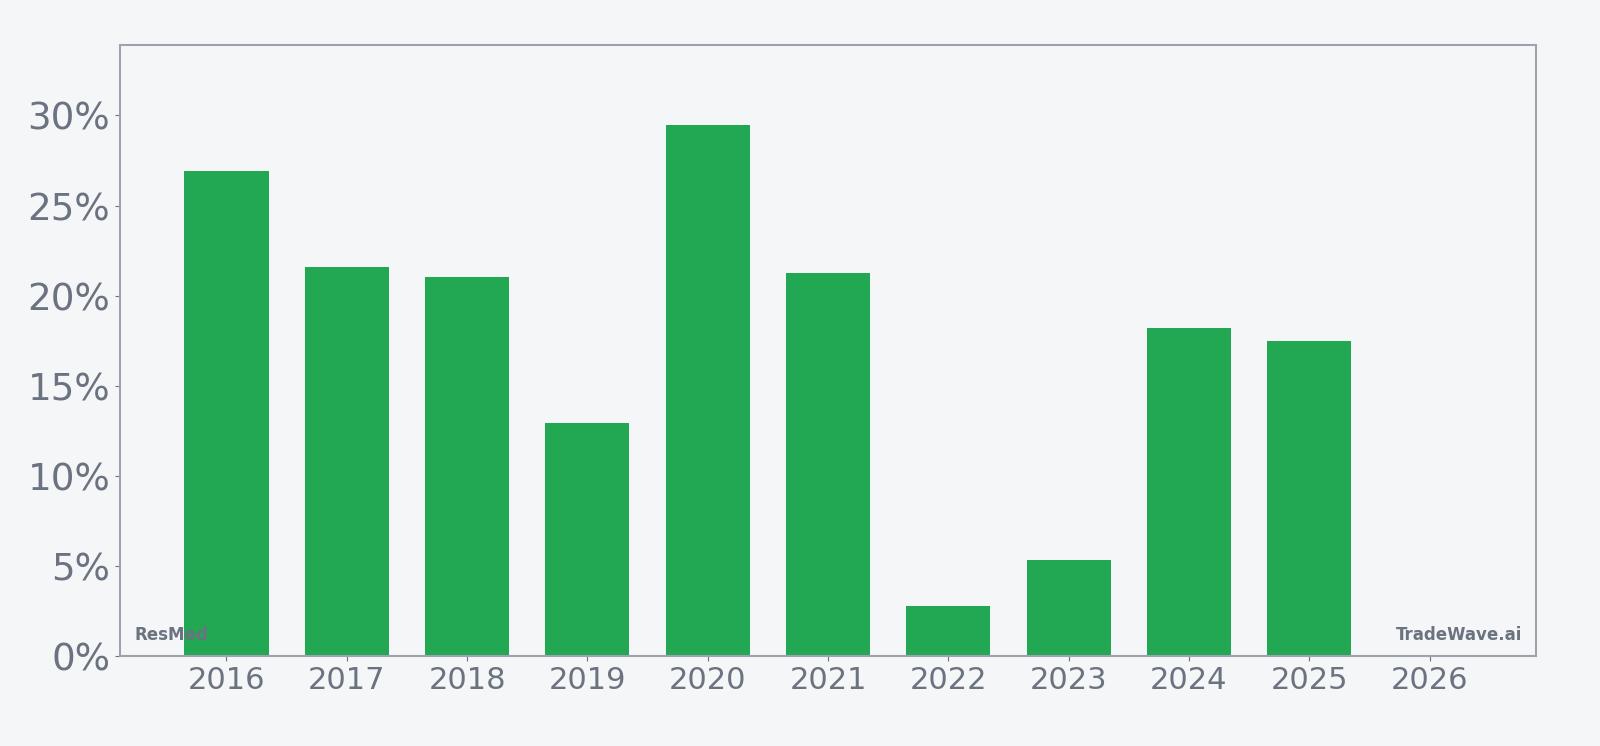
Historically, this long-directed pattern has been unusually consistent: all 10 years in the sample ended the 200-day window with positive net returns, with average gains of 17.71% and a median outcome of 19.61%. The strongest year in the dataset was 2020, when the window produced a net return of 29.49%, while the softest outcome was in 2022, which still finished higher by 2.81% despite a choppy backdrop. That combination of a 100% win rate and a Sharpe ratio of 1.81 points to a historically favorable risk-adjusted profile for long exposure during this stretch.
The per-year path data highlights how those gains have developed. In stronger years such as 2016 and 2018, ResMed’s price advanced steadily through the window, with net returns of 26.89% and 21.03% respectively and maximum favorable moves of 28.38% and 27.18% from entry. In more volatile environments like 2019 and 2020, the stock still finished the window higher, but the journey included sharper swings, suggesting that investors have often been rewarded for staying with the trend despite interim turbulence.
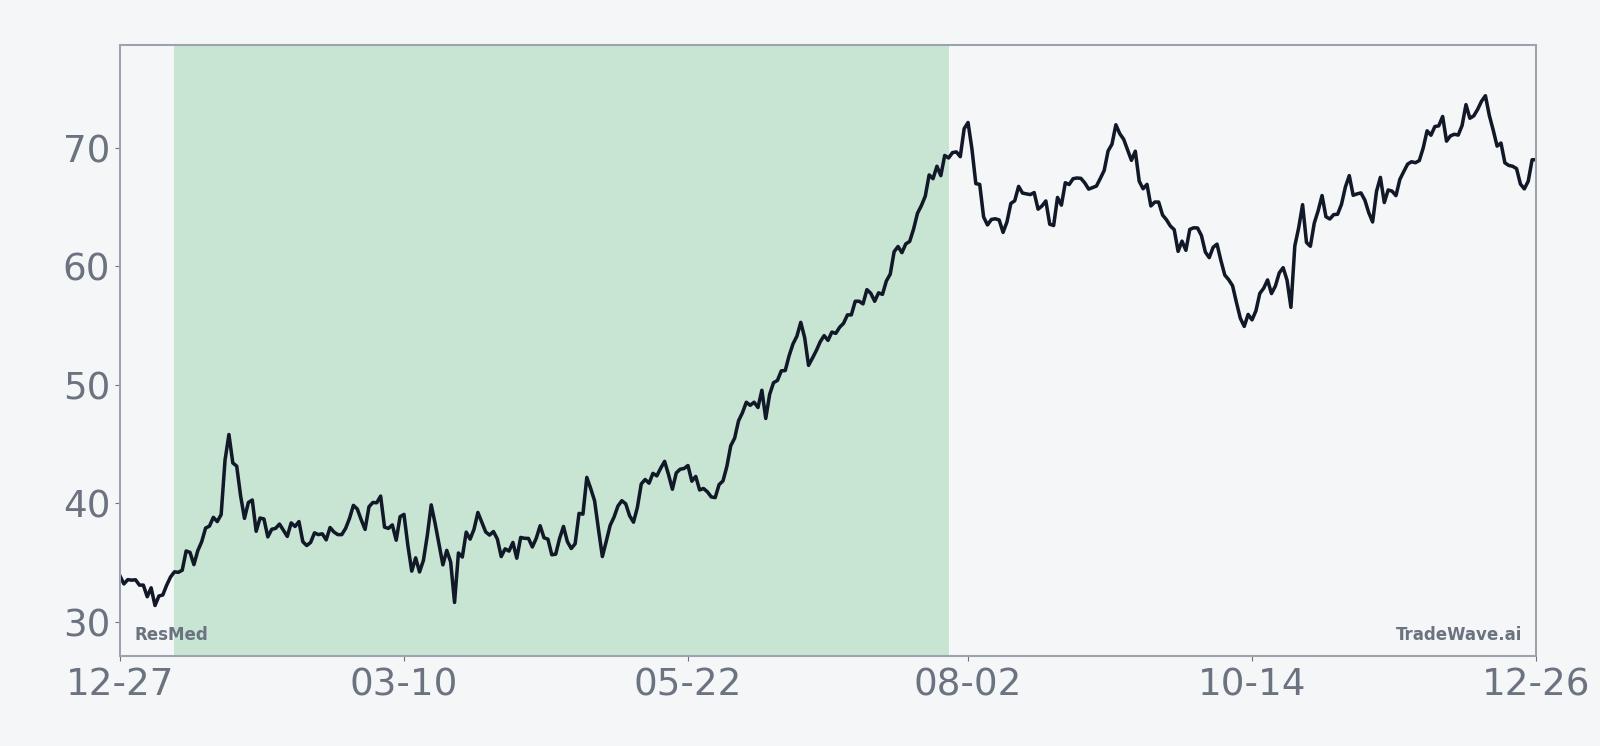
A combined view of net results and intraperiod swings shows how upside and downside have coexisted within this bullish window.
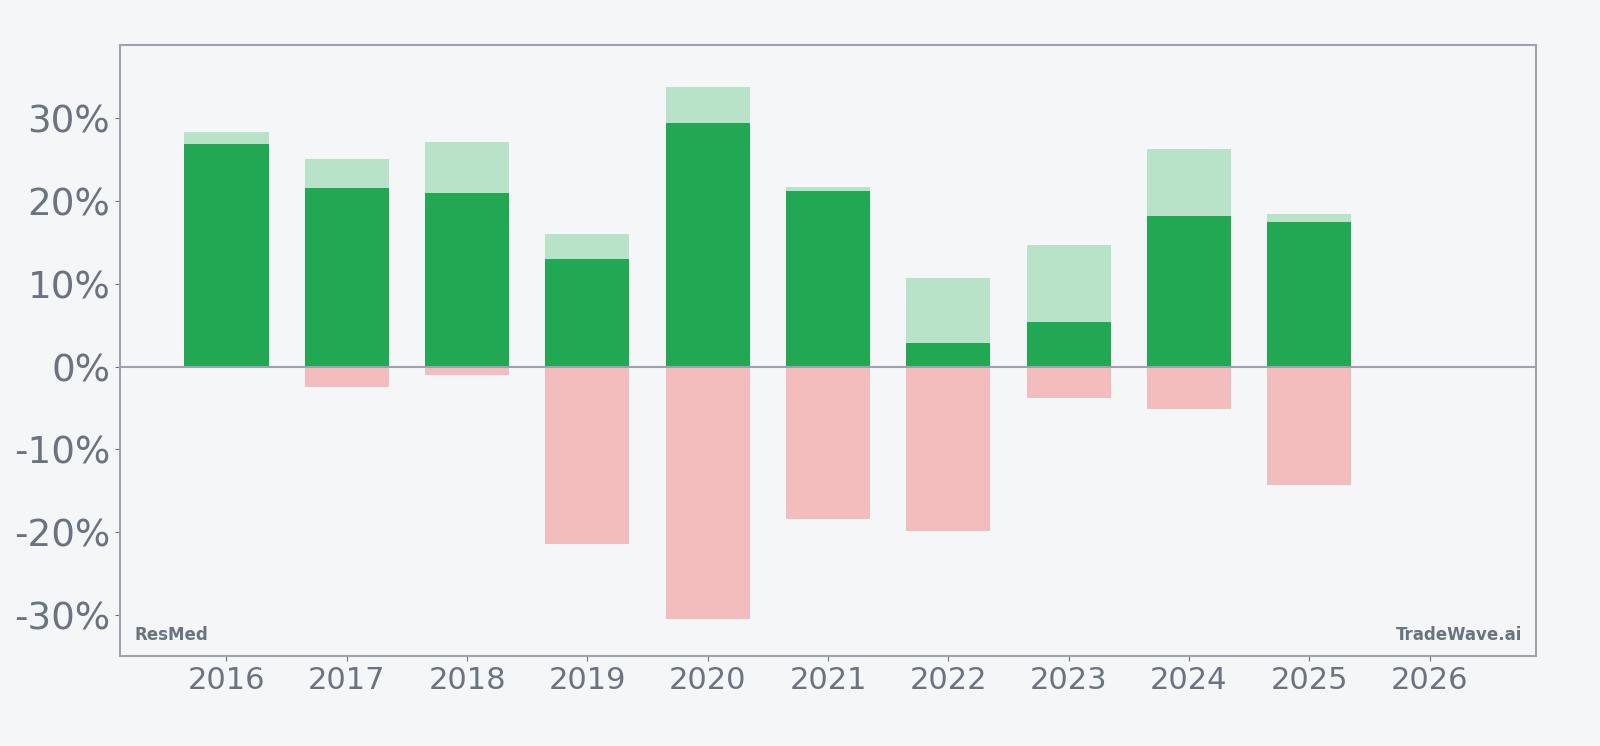
The maximum favorable excursion profile shows that in several years, including 2020 and 2016, ResMed’s price advanced more than 25% from the start of the window at some point, underscoring the potential for sizable rallies when the pattern aligns with fundamentals. At the same time, the maximum adverse excursion data reveals that even in winning years, the stock has occasionally traded sharply below the entry level, with intraperiod drawdowns of -30.46% in 2020 and -21.45% in 2019. That mix of large positive and negative swings suggests a high-variance environment where trend persistence has ultimately dominated, but where timing and risk controls have mattered.
On balance, the cumulative return history across the 200-day span points to a tendency for gains to build over time rather than arrive in a single burst, with many years showing progress that accelerates in the middle and later portions of the window. Taken together, the historical pattern defines the quantitative seasonal backdrop for the current period.
History does not guarantee future results, and adverse excursions can be large even in windows that ultimately finish with gains.
Price and near-term drivers
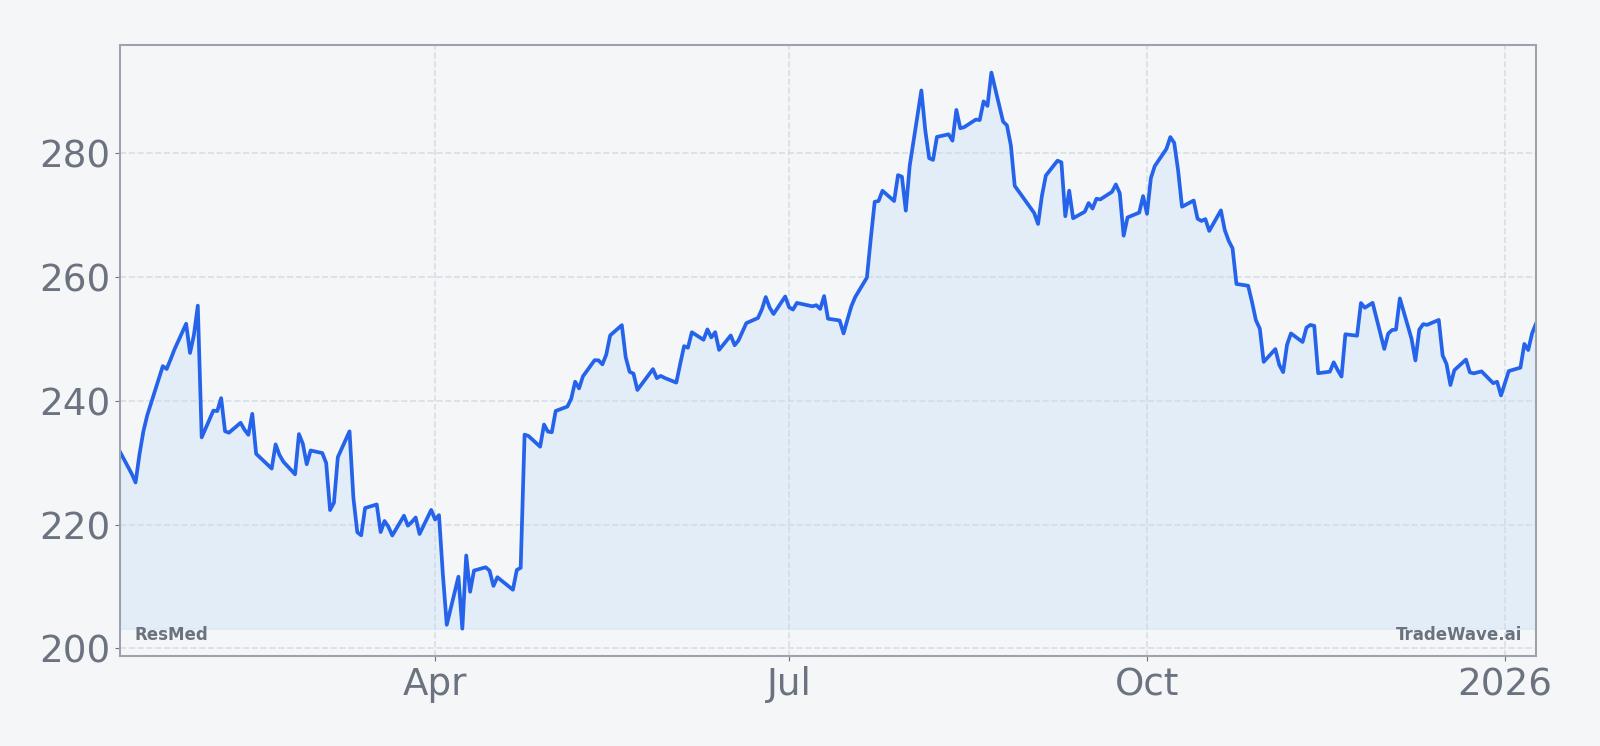
Real-time pricing data for ResMed was not available in the latest dataset, but the stock is entering this seasonal stretch after a decade in which the same 200-day window has consistently produced positive outcomes. In the absence of a clear single-company news catalyst on Jan 12, 2026, investors are instead looking across the healthcare and medical-technology complex, where sentiment has been shaped by broader discussions of procedure volumes, reimbursement trends and innovation pipelines, as reflected in coverage of other health-related listings and capital markets activity.[1]
The chart below situates the latest move in its recent multi-month context.
Earnings and fundamental backdrop
Specific earnings dates, guidance figures and recent quarterly results for ResMed were not included in the current research set, leaving investors to infer the fundamental backdrop from sector-wide signals and the company’s longer-term track record. Across the medical technology and life sciences space, analysts have been focused on how companies balance growth investments with profitability, a theme that has surfaced in coverage of other healthcare and adjacent names over recent months.[7] For ResMed, which operates in sleep and respiratory care, that conversation typically centers on device adoption, recurring revenue from consumables and software, and the pace of innovation in patient monitoring.
Without a fresh consensus earnings forecast in hand, the seasonal pattern takes on added importance as a framing tool rather than a trading signal. Historically, the 200-day window has spanned at least two earnings reports in most years, meaning that both positive and negative surprises have been absorbed within the same long-biased seasonal regime. The fact that all 10 years in the sample still finished higher suggests that, in prior cycles, company-specific volatility around results has not been enough to overturn the broader calendar tendency.
Macro and sector context
Macro conditions and sector flows can be especially important for a stock like ResMed, which sits at the intersection of healthcare demand, consumer behavior and reimbursement policy. While the latest dataset does not include explicit macro indicators, recent coverage of capital markets activity and institutional positioning in other industries highlights how investors have been rotating across sectors as they reassess growth and inflation dynamics.[8] For healthcare and medical technology, that often translates into a search for companies with durable demand profiles and defensible margins, characteristics that can either reinforce or counteract seasonal tendencies depending on the phase of the cycle.
In prior years within this window, some of the sharpest intraperiod drawdowns coincided with broader market stress, as seen in 2020 when the maximum adverse move reached -30.46% despite the window ultimately closing with a gain of 29.49%. That history underlines the role of macro shocks in shaping the path of returns, even when the end result has been positive. For investors tracking ResMed through 2026, the key question is how any shifts in rates, growth expectations or risk appetite might interact with the stock’s historically supportive seasonal backdrop.
Valuation and positioning lens
Traditional valuation markers such as price-to-earnings ratios, dividend yield or price-to-book multiples for ResMed were not provided in the current research package, limiting direct comparison with peers. However, recent commentary on other listed companies shows that investors have been sensitive to valuation dispersion within sectors, rewarding firms that can pair growth with reasonable multiples and punishing those perceived as fully priced.[12] For a stock trading inside a historically strong seasonal window, valuation can influence how much of that seasonal tendency is already reflected in expectations.
Institutional positioning data for ResMed was also not included, but filings and flow reports in other names suggest that professional investors have been active in rotating exposures across industries and market caps.[10] If similar behavior is occurring in healthcare, it could either amplify the seasonal pattern, by directing incremental capital toward ResMed during a historically favorable stretch, or dampen it if investors choose to emphasize other themes.
What to watch in this window
With ResMed trading inside a 200-day window that has historically delivered consistent long-side gains, the next several months will test how closely the stock tracks its seasonal script. Investors will be watching upcoming earnings reports and any updates on device demand, reimbursement and software adoption, since in prior years this window has typically encompassed multiple fundamental catalysts. Price behavior around those events, particularly whether pullbacks resemble the historical adverse excursions or remain more contained, will offer clues about how much seasonal support is present this time.
Key technical levels on the chart, including prior swing highs and lows from the past year, will also matter as reference points for gauging whether the stock is behaving like a typical winning year in the pattern or more like the lower-return outcomes such as 2022. A sustained move that keeps ResMed trending higher through the middle and later portions of the window would be consistent with the historical average path, while a failure to hold gains or an unusually deep drawdown could signal that other forces are overpowering the calendar effect. For traders and longer-term investors alike, the interplay between company news, sector flows and this well-defined seasonal regime will shape how the ResMed story develops through mid-2026.
Sources
- [1] Reuters, "Analysts initiate Medline with bullish ratings after blockbuster IPO," Jan 12, 2026.
- [2] MarketBeat, "Agnico Eagle Mines (NYSE:AEM) Reaches New 52-Week High - Should You Buy?," Feb 11, 2025.
- [3] MarketBeat, "Atria Investments Inc Purchases Shares of 5,272 Modine Manufacturing Company $MOD," Nov 10, 2025.
- [4] MarketBeat, "Murata Manufacturing (OTCMKTS:MRAAY) Releases Earnings Results," Jul 31, 2025.
- [5] MarketBeat, "Alpha Metallurgical Resources (AMR) Expected to Announce Earnings on Friday," Feb 21, 2025.
- [6] MarketBeat, "Murata Manufacturing (OTCMKTS:MRAAY) Issues Quarterly Earnings Results," Nov 1, 2025.
- [7] MarketBeat, "Modiv Industrial (NYSE:MDV) Posts Earnings Results, Beats Expectations By $0.04 EPS," Nov 16, 2025.
- [8] MarketBeat, "HudBay Minerals Inc $HBM Stock Holdings Raised by Franklin Resources Inc.," Dec 1, 2025.
- [9] MarketBeat, "Aris Mining Q4 EPS Estimate Cut by National Bank Financial," Feb 14, 2025.
- [10] MarketBeat, "RFG Advisory LLC Makes New Investment in SSR Mining Inc. (NASDAQ:SSRM)," Jun 13, 2025.
- [11] Seeking Alpha, "SSR Mining: Currently Neutral, But Offers Options (NASDAQ:SSRM)," Dec 31, 2025.
- [12] GuruFocus, "MLTX Deadline: MLTX Investors with Losses in Excess of $100K Hav," Dec 7, 2025.
- [13] Forbes, "Don’t Count This Utilities Stock Out Just Yet," Oct 22, 2025.