Data Center Expansion Fuels Power Load Forecasts, Supporting WEC Energy Group (WEC) Spending Plans
WEC Energy Group is entering a 26-day stretch that has been consistently positive over the past decade, even as investors weigh how rising AI-driven power demand could reshape the utility’s growth profile.
Seasonal window
This seasonal window is currently underway, spanning 26 days, and has historically been a strong stretch for WEC Energy Group. Today the stock closed at $114.34, up 0.1% on the session, with limited context available on its 52-week range or year-to-date performance.[1] Over the past 10 years, this period has produced gains in every instance for a long positioning approach, setting a constructive backdrop for traders who track calendar-driven patterns.
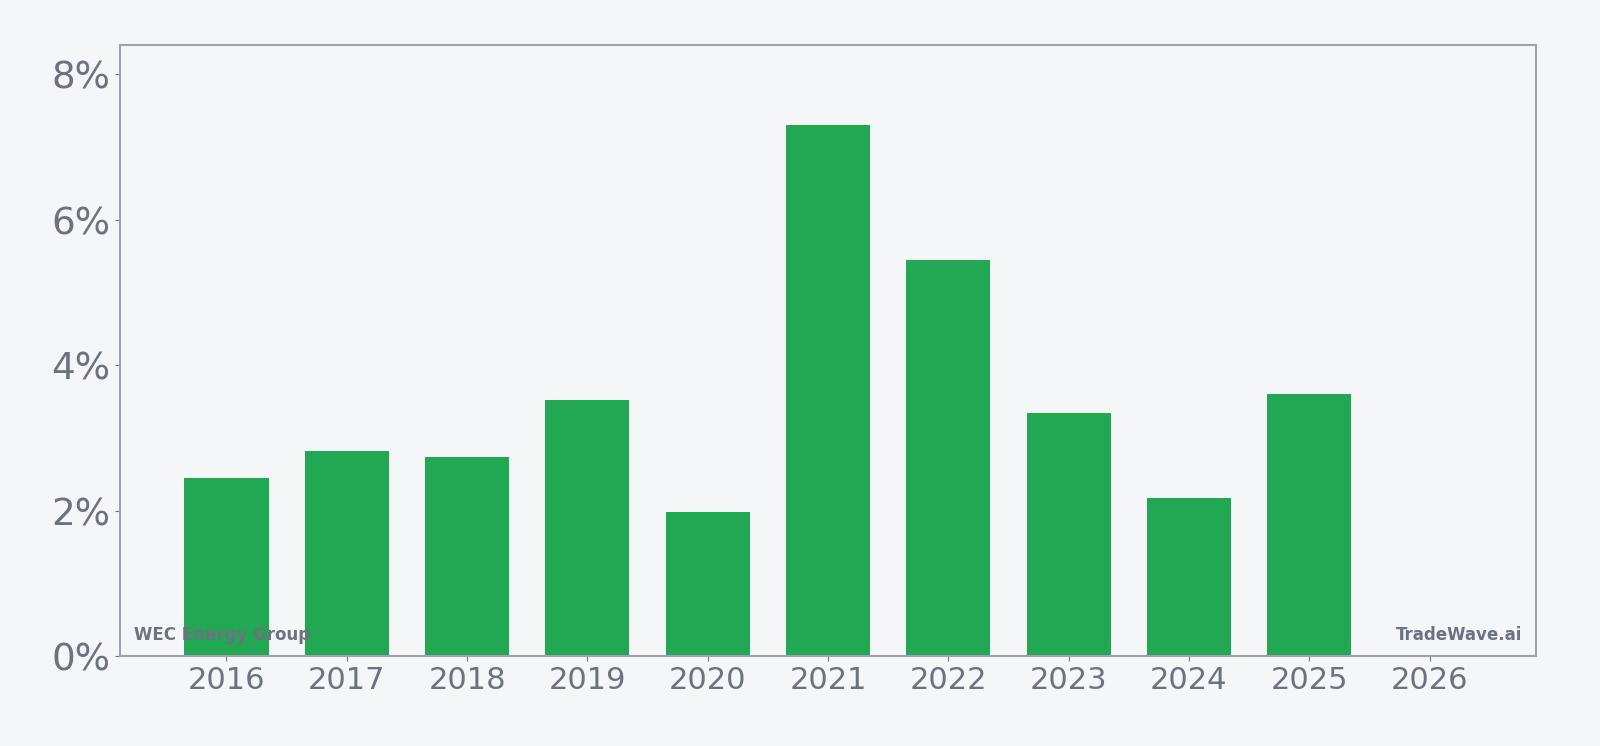
Across the 10-year sample, WEC Energy Group has delivered an average profit of 3.54% in this window, with every year finishing positive for the long trade direction. The median outcome of 3.08% is close to the average, which suggests that results have clustered around a fairly consistent gain profile rather than being dominated by a single outlier year. The annualized return of 3.53% and a Sharpe ratio of 1.98 indicate that, on a risk-adjusted basis, this period has historically offered a relatively smooth payoff compared with more volatile stretches of the calendar.
The per-year breakdown shows that even the softer years in this window have still produced modest gains, while the stronger years have delivered mid-single-digit returns. For example, 2020 recorded a net return of 1.98% over the 26 days, while 2021 saw a 7.31% gain and 2022 posted a 5.45% increase. That consistency is reflected in the 100% win rate for the long pattern, with 10 winners and no losers across the lookback.
The historical seasonal trend chart suggests that gains in this window tend to build steadily rather than arriving in a single sharp burst. The average path slopes higher across the 26 days, with only brief pauses, which implies that in prior years the stock has often added value gradually as the window progressed. That pattern can help traders frame expectations around the timing of moves, even though any single year can deviate from the average.
A combined view of yearly net returns and intraperiod swings highlights how upside and downside have interacted within this window.
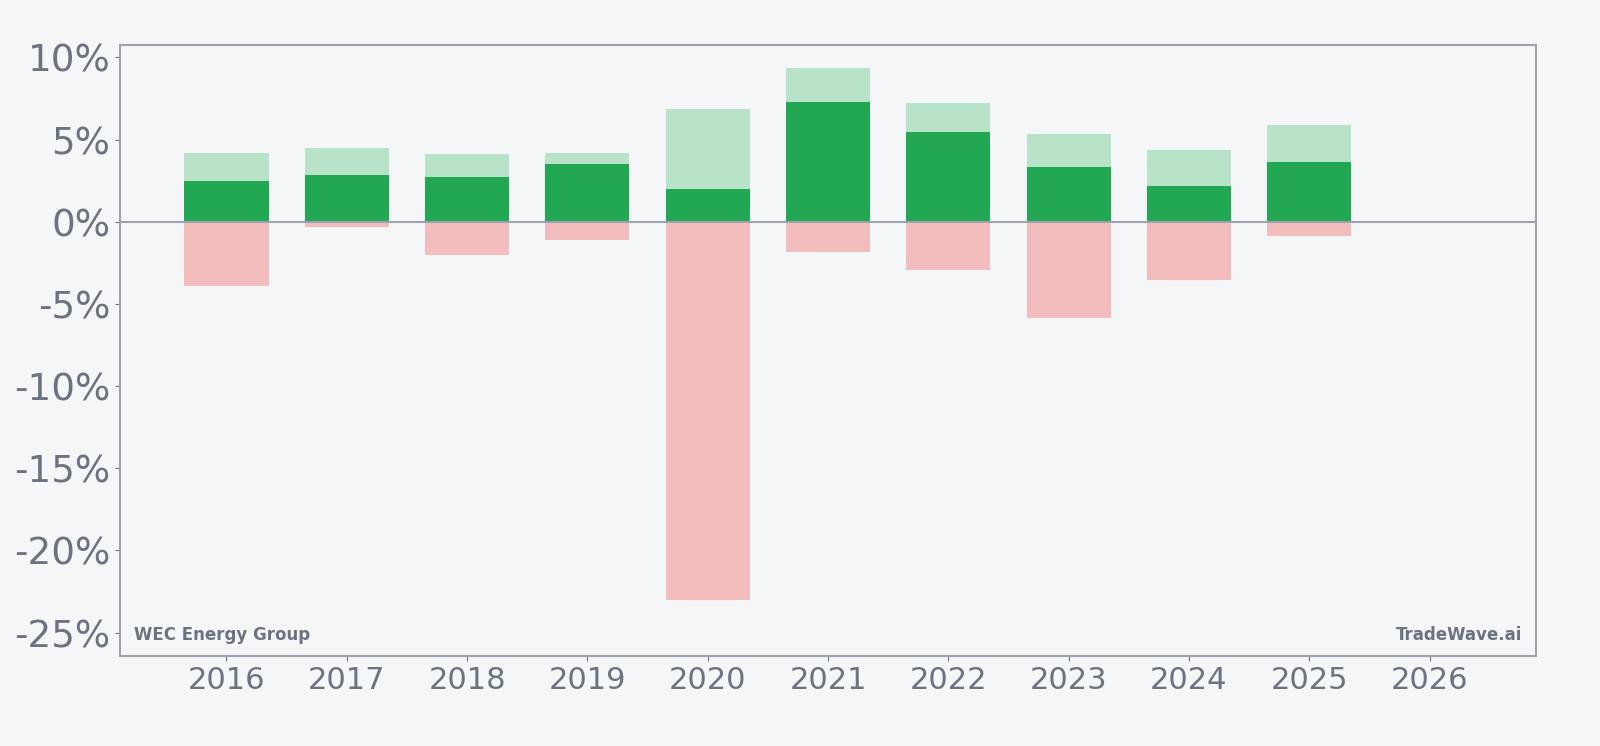
The combined net, maximum favorable excursion and maximum adverse excursion profile shows that upside potential has often come with meaningful intraperiod swings. In 2020, for instance, the stock experienced a maximum favorable move of 6.86% but also a maximum adverse move of -23.0% before finishing the window higher, underscoring that even winning years can involve deep drawdowns. Other years, such as 2017 and 2025, show more contained downside with MAE readings of -0.33% and -0.85% respectively, paired with solid positive net returns, illustrating that the volatility profile can vary significantly from year to year.
History does not guarantee future results, and adverse excursions can be large even in winning windows.
Taken together, the historical pattern defines the quantitative seasonal backdrop for the current period.
Price and near-term drivers
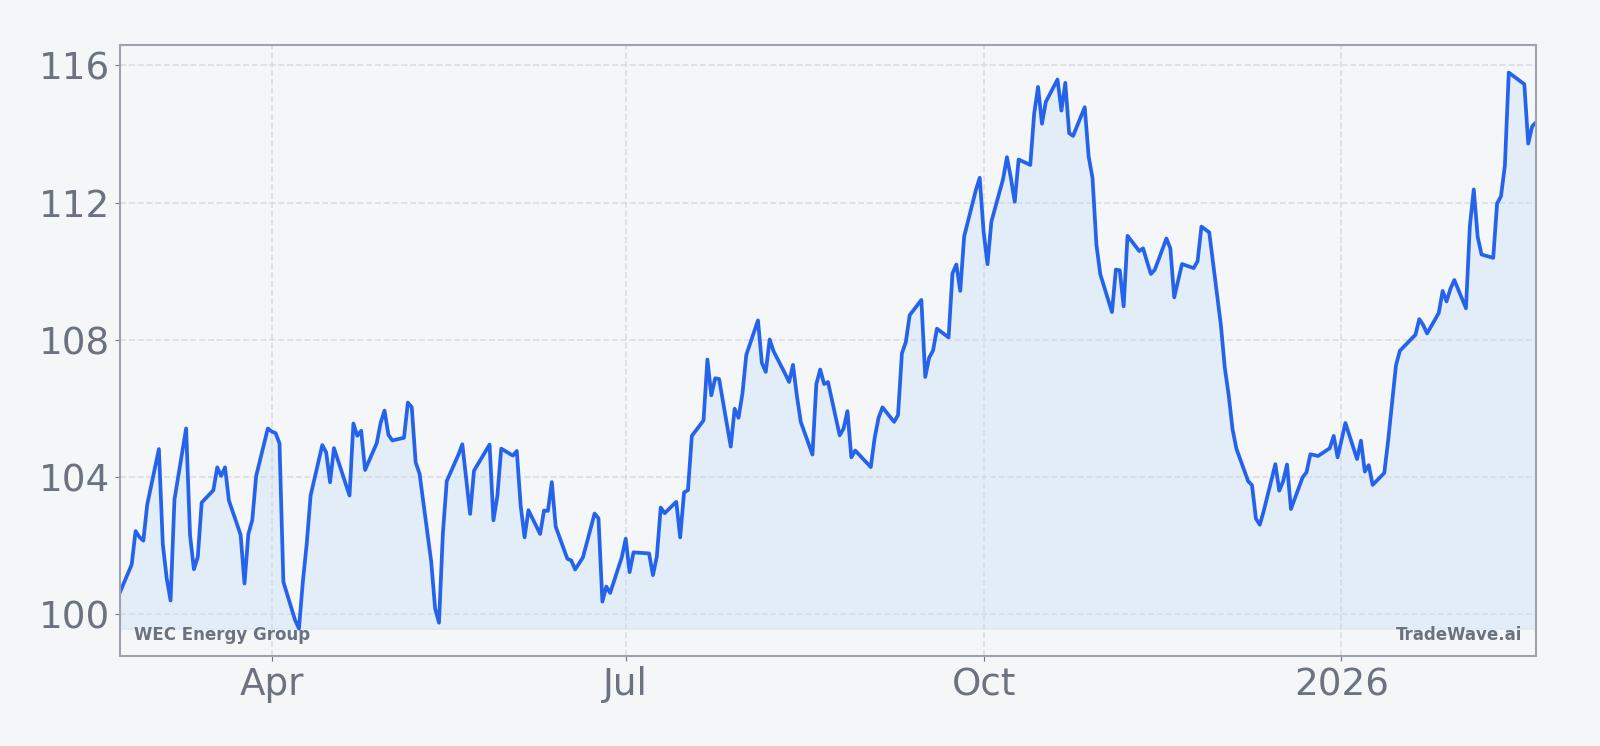
WEC Energy Group shares finished Feb 21 at $114.34, edging 0.1% higher on the day as trading volume of about 2.0 million shares tracked typical levels for the stock.[1] With limited public data on its 52-week high, 52-week low, or year-to-date performance, investors are focusing more on the company’s role in a utility sector that is being reshaped by structural shifts in electricity demand.
One of the most important themes for WEC is the rapid buildout of data centers and AI infrastructure, which is expected to drive substantial new power demand in coming years.[1] In November 2025, research highlighted that data centers were already reshaping electricity demand patterns, with utilities such as WEC, American Electric Power, Evergy and Pinnacle West among those positioned to benefit from rising load and associated capital investment needs.[1] For WEC, that backdrop could translate into a larger regulated asset base over time, though it also raises questions about grid reliability, permitting and the pace at which regulators allow cost recovery.
Sector commentary has emphasized that utilities with exposure to fast-growing industrial and data center corridors may see a more supportive growth profile than the sector’s historical norm.[1] WEC’s service territory includes regions that are drawing interest from data center developers and other power-intensive industries, which could help underpin long-term earnings trajectories if projects proceed as planned. At the same time, higher capital spending requirements and evolving policy around decarbonization and transmission buildout remain key variables for investors to monitor.
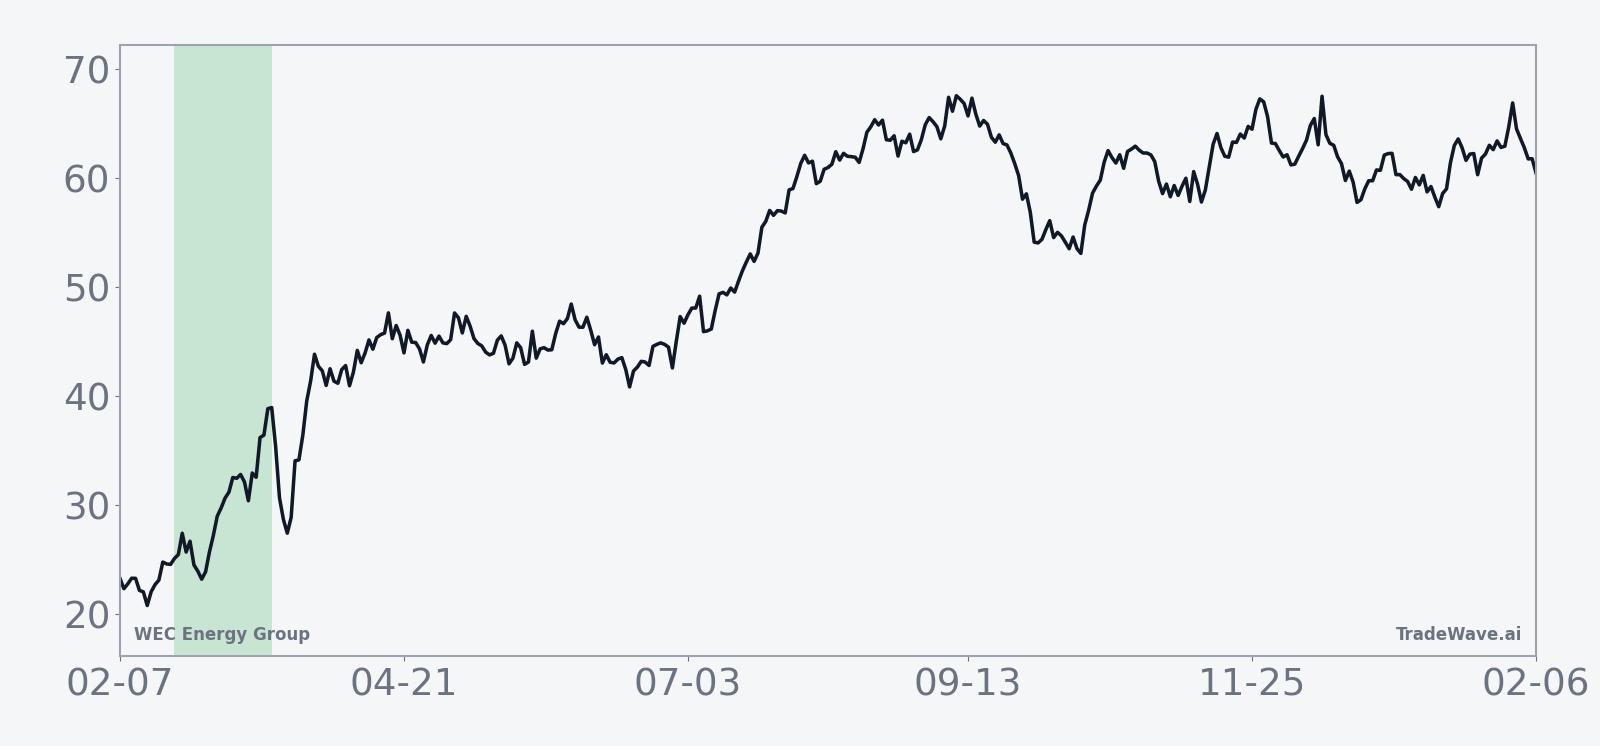
The chart below situates the latest move in its recent multi-month context.
Earnings and guidance
Publicly available data in this context does not specify WEC Energy Group’s next earnings date, recent quarterly results or management guidance, leaving a gap in near-term fundamental catalysts. Without a clear timetable for the next earnings release, traders are likely to focus on broader sector signals and regulatory developments as they assess how the current seasonal window interacts with company-specific news flow.
Consensus estimates and rating details are also not included in the available dataset, so there is limited visibility into how Wall Street expectations for revenue growth, earnings per share or capital spending compare with the stock’s recent performance. In the absence of that information, the seasonal pattern provides one of the few structured frameworks for thinking about short-horizon behavior, while longer-term investors may lean more heavily on macro and sector narratives.
Macro and sector backdrop
The macro environment for utilities is being reshaped by what analysts describe as unprecedented demand for power generation tied to AI and data center expansion.[1] Capacity needs are projected to rise sharply as hyperscale cloud providers and enterprise customers deploy more compute-intensive workloads, which in turn requires significant investment in generation, transmission and distribution infrastructure.
Within this context, utilities like WEC are seen as potential beneficiaries of major data center and industrial load expansions within their service areas.[1] Higher load growth can support rate-base expansion and earnings, but it also introduces execution risk around project delivery, regulatory approvals and the balance between traditional and renewable generation sources. For investors, that mix of opportunity and risk adds another layer to how they interpret short-term seasonal tendencies in the stock.
Valuation and positioning context
Specific valuation markers such as forward price-to-earnings ratios, dividend yield and price-to-book multiples are not provided in the current dataset, which limits direct comparison with peers in the regulated utility space. Historically, WEC has often been viewed as a relatively high-quality, income-oriented name within the sector, and prior commentary has grouped it with other utilities offering dividend yields above 3% alongside positive stock returns.[2] That combination of income and potential growth from rising power demand may influence how investors weigh the current seasonal tailwind against broader market conditions.
Without detailed information on analyst price targets or ratings, it is difficult to gauge how much of the AI and data center demand story is already reflected in WEC’s share price. The seasonal window, with its track record of positive outcomes for long positions, therefore functions more as a contextual overlay than a standalone signal, particularly for investors who are balancing income needs, regulatory risk and macro uncertainty.
According to historical data from TradeWave.ai, this part of the calendar has shown a distinct pattern for WEC Energy Group that stands apart from the rest of the year.
What to watch during this window
As WEC Energy Group moves through this 26-day seasonal window, traders will be watching how closely the stock’s behavior tracks the historical pattern of steady, positive returns. One focal point is whether price action follows the typical gradual upward slope seen in the 10-year average trend, or whether it diverges with more abrupt swings or sideways consolidation. Sustained strength through the middle and latter portions of the window would be more consistent with prior years, while early weakness or choppy trading could signal a break from the established seasonal tendency.
Fundamentally oriented investors may focus on any updates related to data center projects, industrial load growth or regulatory decisions that affect WEC’s capital spending plans and allowed returns.[1] Announcements around new large customers, grid upgrades or policy shifts on transmission and generation could all influence sentiment during the window, especially if they alter perceptions of long-term earnings power. In the absence of a clearly defined earnings date in this period, such incremental news could take on added importance.
From a risk-management perspective, the historical record of sizable intraperiod drawdowns in some years, such as the -23.0% maximum adverse move in 2020, underscores the need to monitor volatility even when the end-of-window outcomes have been positive. Traders may pay particular attention to how the stock reacts to broader market moves, interest-rate expectations and sector rotation, since utilities can be sensitive to shifts in bond yields and defensive positioning. A pattern of contained downside and constructive closes would align more closely with the historical profile, while sharp, sustained selloffs inside the window would mark a clear departure from the past decade’s behavior.
For both short-term traders and longer-horizon investors, the key takeaway is that this period has historically been favorable for long exposure in WEC, but that advantage has sometimes come with meaningful volatility along the way. How the stock trades relative to this backdrop, and how new information about power demand and capital plans emerges, will help determine whether 2026 adds another win to the seasonal track record or becomes an outlier year.