Nvidia (NVDA) Earnings Beat Highlights 56% Revenue Surge but Volatility Jumps
Nvidia shares are under pressure after earnings even as the chipmaker approaches a historically strong 95-day seasonal stretch that has often coincided with sharp moves in the stock.

Key takeaways
- Nvidia is approaching a 95-day seasonal window starting Mar 21 that has historically been favorable for long positions in the stock.
- Across the past 6 years, this window has been profitable in 83% of cases, with 5 winning years and 1 losing year.
- Average gains in winning years have been 47.03%, while the all-years average that includes the lone loss is 33%.
- The pattern’s Trade Direction is long, with a TradeWave Ratio of 1.7 and a Sharpe ratio of 0.78, pointing to a strong but volatile upside profile.
- Intraperiod swings have been large, with some years showing deep adverse moves even when the window ultimately finished higher.
- Today’s post-earnings pullback and earlier bearish options positioning frame this upcoming seasonal stretch as a potential volatility inflection point.[3][14]
According to historical data from TradeWave.ai, Nvidia’s behavior in this specific 95-day span has shown a distinct pattern in recent years. The next section looks at how that seasonal backdrop lines up with today’s price action and fundamental story.
Seasonal window
This seasonal window begins on Mar 21, 2026 and spans 95 trading days, and it has historically been a strong stretch for Nvidia when traded from the long side. Nvidia closed Thursday at $186.07, down 4.9% on the day, leaving the stock under short-term pressure as investors digest fresh earnings and position ahead of that window.[3] In February 2025, options traders placed a massive bearish bet on Nvidia shares declining toward $115 by early March, highlighting how positioning can swing sharply around inflection points in the stock.[14] The combination of a historically constructive seasonal phase, a volatile post-earnings tape and evidence that options markets have been willing to lean hard in both directions underscores how quickly sentiment can flip during this part of the calendar.
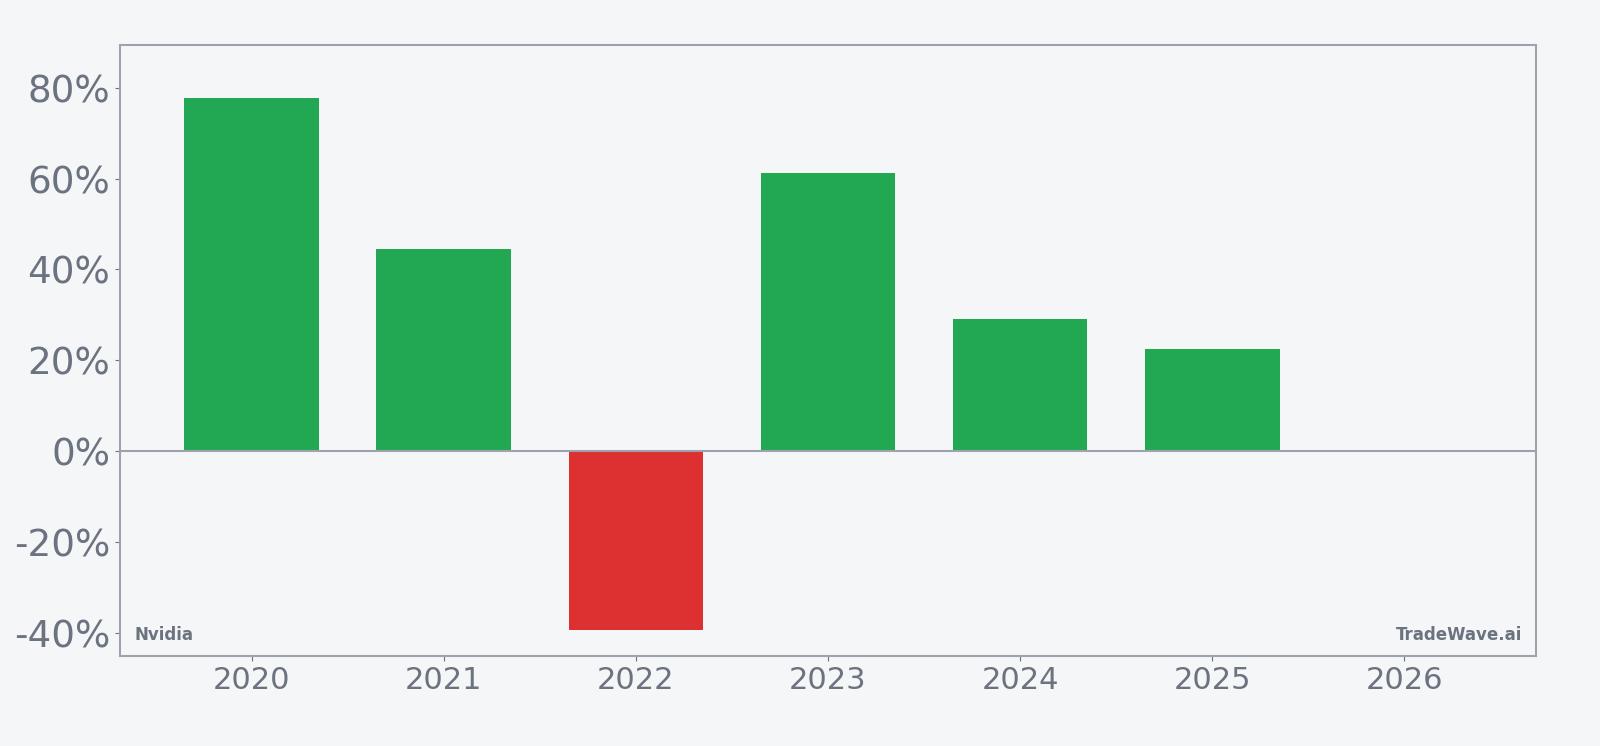
Across the six-year sample, the long trade direction has aligned with the dominant outcome in this window, with 5 winning years and just 1 losing year, for a Percent Profitable reading of 83%. Average gains in those winning years have been 47.03%, while including the single down year pulls the all-years average to 33%, which still reflects a historically strong upside bias for this stretch.
The per-year breakdown shows how that strength has clustered. The best outcome came in 2020, when Nvidia gained 77.8% over the window, while 2023 and 2021 also delivered sizable advances of 61.13% and 44.56% respectively. The lone losing year was 2022, when the stock fell 39.3% during the same calendar span, illustrating that even in a generally favorable window, macro or stock-specific shocks can overwhelm the seasonal tendency.
Intraperiod swings have been large in both directions. In 2020, the maximum favorable move within the window reached 81.43%, while the worst drawdown from entry was a relatively modest 7.22%, suggesting a powerful trend with limited giveback that year. By contrast, 2022 saw a maximum adverse move of 42.65% against the long direction and only an 8.27% peak run-up, underscoring how quickly conditions can reverse when the pattern fails.
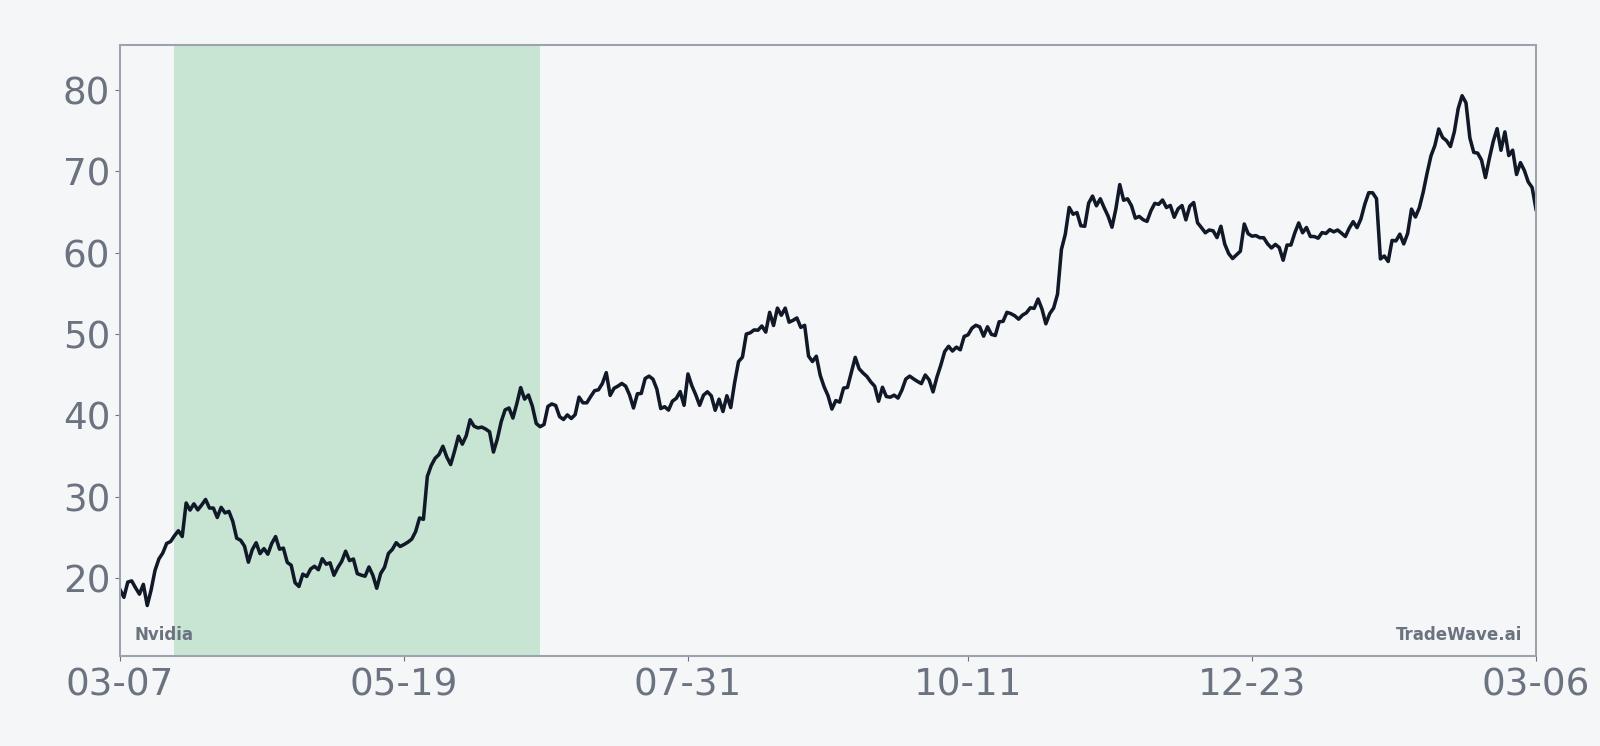
The historical seasonal trend chart for this window shows that, on average, gains have tended to build over the course of the 95 days rather than arriving in a single burst. The typical path slopes higher with some mid-window choppiness, indicating that strong years often feature early momentum that consolidates before pushing to new highs toward the end of the period.
A second view that combines net results with peak run-ups and worst drawdowns highlights how upside and downside have coexisted inside this window.
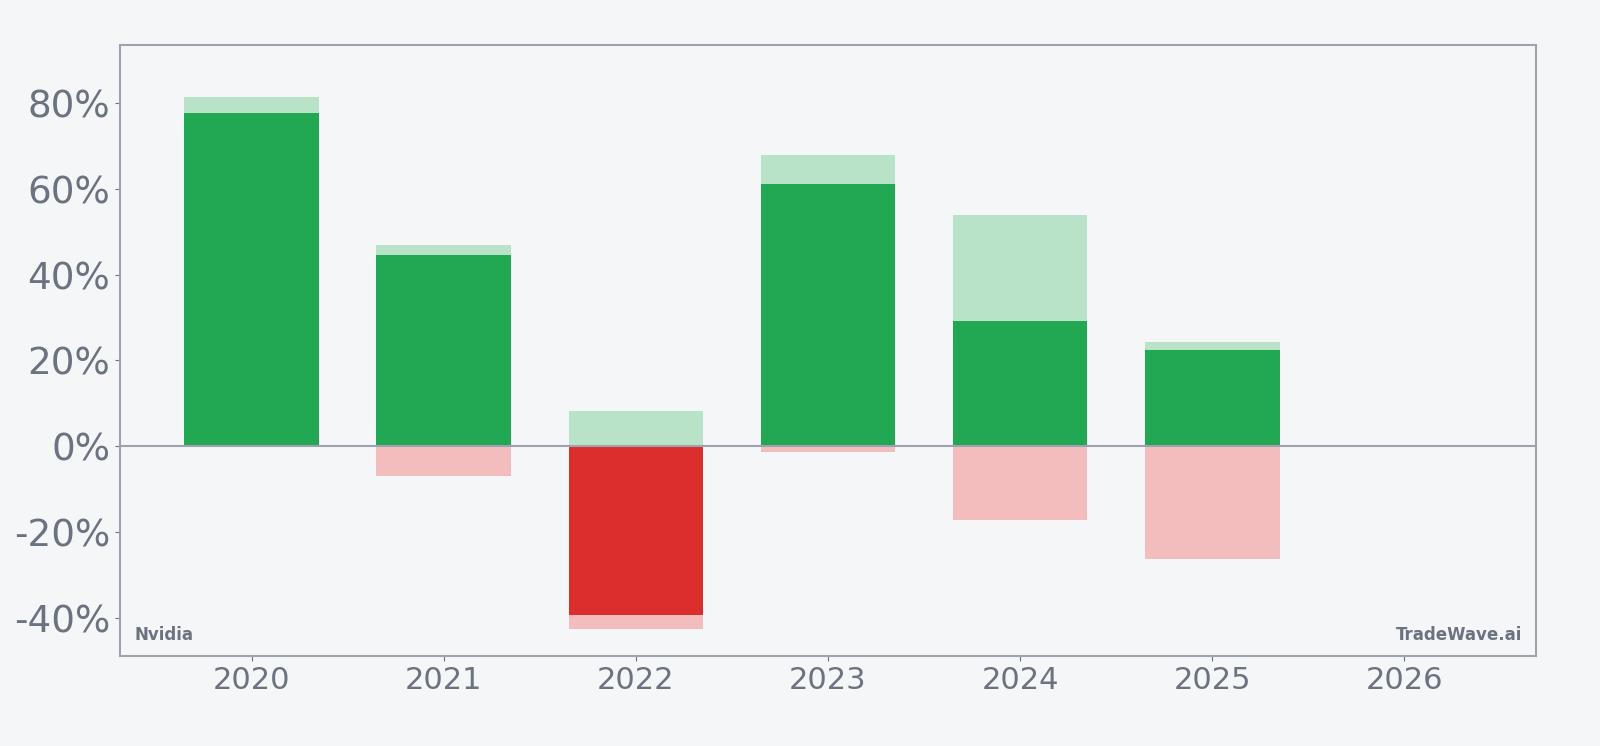
The combined net, maximum favorable excursion and maximum adverse excursion view shows that even in strong years like 2020 and 2023, Nvidia has typically experienced meaningful pullbacks before finishing higher, while the 2022 bar stands out for its deep adverse move and limited upside. Taken together, the historical pattern defines the quantitative seasonal backdrop for the current period.
History does not guarantee future results, and adverse excursions can be large even in windows that ultimately finish with gains.
Price and near-term drivers
Nvidia shares fell 4.9% to $186.07 on Thursday as investors reacted to the company’s latest quarterly report and guidance, a sharp move that comes on the heels of a long run of strong growth expectations for its AI chip business.[3] The stock’s pullback follows a period in which analysts and traders had highlighted a “strong setup” into earnings, reflecting optimism around demand from cloud and hyperscale customers and the company’s visibility into more than $500 billion in revenue through the end of next year.[3][4]
The chart below situates the latest move in its recent multi-month context.
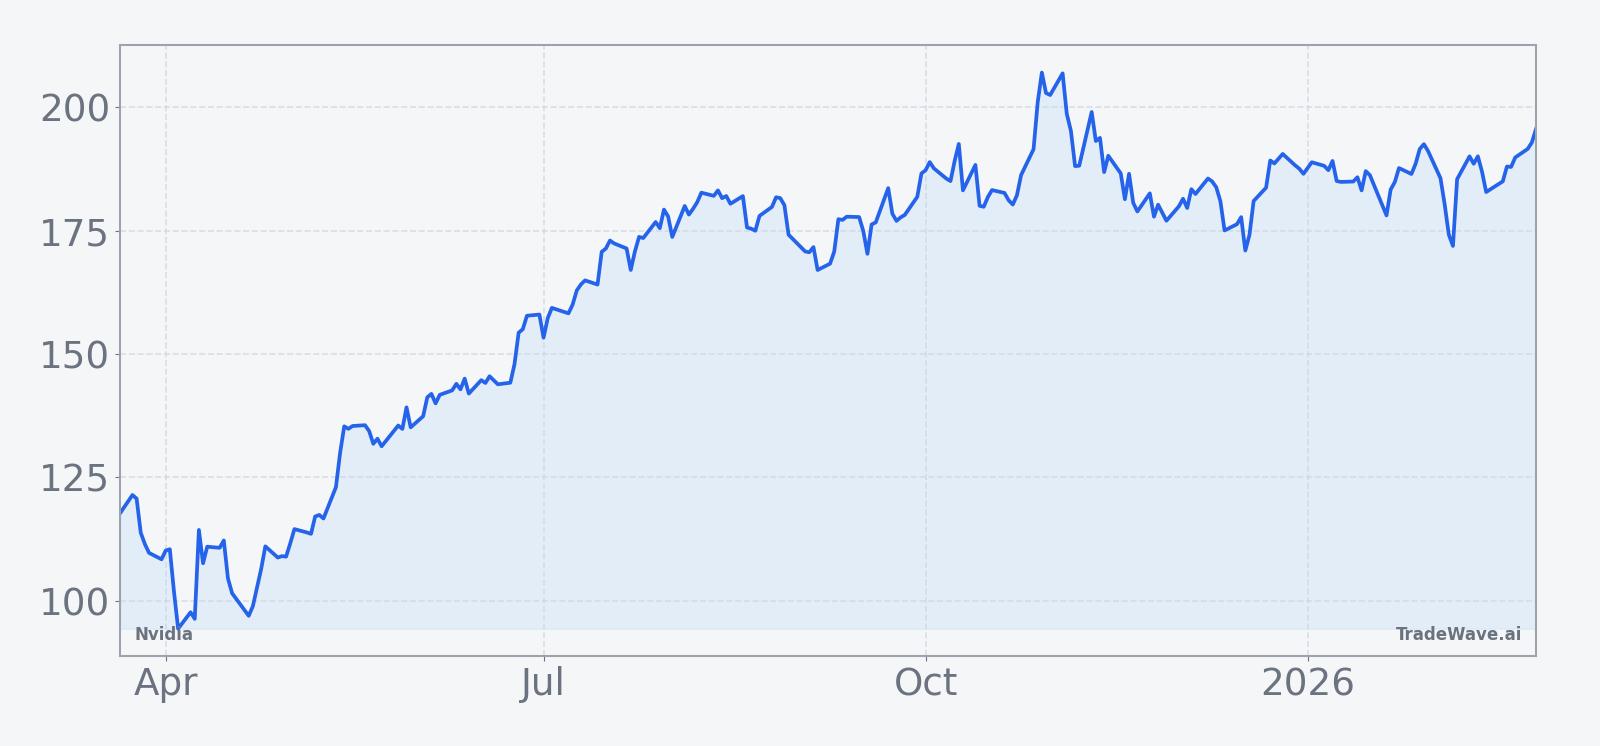
The latest quarter, reported on Feb 25, kept the focus on Nvidia’s role at the center of the AI spending boom. For its most recently reported period, the company delivered revenue of $46.7 billion, up 56% year over year, with adjusted earnings per share rising 54% and topping Wall Street forecasts.[3] Management has pointed to visibility into more than $500 billion in revenue through the end of next year, a figure that has helped underpin bullish long-term narratives around the stock even as shorter-term trading has become more volatile.[3]
That growth story sits within a broader macro backdrop in which hyperscale cloud providers are expected to lift capital spending on AI infrastructure by 69% this year, a trend that directly supports demand for Nvidia’s data center GPUs and networking products.[4] At the same time, the company faces intensifying competition from both Chinese chipmakers and custom accelerators developed by large U.S. cloud platforms, which could influence pricing power and margins over time.[8]
Analyst sentiment remains broadly constructive. As of late 2025, Barchart.com data showed a Strong Buy consensus rating on Nvidia with a consensus price target around $222, reflecting confidence that the company could continue to grow into its valuation as AI workloads expand.[1][2] Some independent analysts, however, have warned that the stock’s earlier surge left little room for execution missteps, arguing that any slowdown in orders or shift in competitive dynamics could trigger a deeper reset in expectations.[8][10]
Options and technical positioning have also played a role in shaping the tape. In February 2025, Bloomberg reported that the day’s biggest options trade was a large bearish bet targeting a decline in Nvidia shares toward $115 by early March, a structure that underscored how quickly sentiment can swing from enthusiasm to caution when the stock stumbles.[14] Earlier that year, chart-focused investors had already been bracing for more downside after a selloff pushed the stock to a five-month low, with some dip buyers stepping back as volatility picked up.[12]
Those cross-currents have left Nvidia as both a bellwether for AI enthusiasm and a focal point for debates about valuation and cyclicality in semiconductors. In mid-2025, several analysts framed the stock as a key driver of broader index performance, noting that its sharp rallies and pullbacks had increasingly influenced sentiment across the Nasdaq and S&P 500.[5][11][13] That systemic role means that how Nvidia trades into and through its upcoming seasonal window could matter not just for shareholders but for the wider market tone around high-growth technology names.
What to watch as the window approaches
With the 95-day seasonal window set to begin on Mar 21, investors will be watching whether Nvidia’s post-earnings weakness stabilizes or deepens in the weeks ahead. Historically, strong years in this window have often featured early upside momentum that persisted, while the lone losing year saw adverse moves build quickly, so the stock’s behavior around the start date could offer an early read on which pattern is asserting itself.
Earnings revisions and AI spending headlines will remain central catalysts. Any updates from major cloud providers on capital expenditure plans, or from Nvidia on supply, product roadmaps and competitive responses, could either reinforce the historical tendency toward strength in this window or, as in 2022, overwhelm it. Street expectations for continued high double-digit growth leave little margin for disappointment, which can amplify intraperiod swings when news flow surprises in either direction.[3][4]
Options and positioning are another key dimension. The large bearish options structure reported in February 2025 showed how quickly traders can lean into downside scenarios when technicals weaken, and a similar build-up in put activity or skew in the coming weeks would signal that markets are again hedging aggressively into the seasonal window.[14] Conversely, a shift toward call-heavy flows and rising implied volatility could indicate that traders are positioning for the kind of strong upside excursions that have characterized the better historical years.
Finally, price levels and volatility bands will matter. While specific 52-week reference points are not available in the current data, traders will likely focus on whether Nvidia can reclaim recent resistance zones established before the latest pullback or whether it instead breaks below recent lows as the window opens. A pattern of higher lows and constructive reactions to negative headlines would be more consistent with the historical long-biased seasonal profile, while sustained selling on good news would echo the outlier year in which the window delivered a sizable loss.
For now, the data show a clear historical tendency toward strength in this 95-day stretch, paired with a track record of sizable intraperiod swings. How Nvidia trades between today’s post-earnings reset and the Mar 21 start date, and whether options markets again lean heavily in one direction, will help determine whether this year’s window aligns with the prevailing pattern or becomes another exception.
Sources
- [1] Barchart.com, “Nvidia Stock Just Got a New Street-High Price Target. Should You Buy NVDA Now?” (Oct 27, 2025).
- [2] Barchart.com, “Analysts Have High Hopes for Nvidia Ahead of August 27. Should You Buy NVDA Stock Here?” (Aug 22, 2025).
- [3] The Motley Fool, “Nvidia Earnings: What to Watch for on Feb. 25” (Feb 25, 2026).
- [4] MarketWatch, “Nvidia’s stock has a strong setup ahead of next week’s earnings, this analyst says” (Nov 13, 2025).
- [5] Bloomberg, “Nvidia (NVDA) Earnings: Key Takeaways From Fourth-Quarter Report” (Feb 26, 2025).
- [6] Yahoo Finance, “Nvidia CEO drops 8 bombshell quotes about its future” (Aug 30, 2025).
- [8] Seeking Alpha, “Nvidia: You're Running Out Of Time To Sell (NASDAQ:NVDA)” (Nov 26, 2025).
- [10] Seeking Alpha, “Nvidia: It's Not A Bubble, It's A Dam (NASDAQ:NVDA)” (Oct 16, 2025).
- [11] Seeking Alpha, “Nvidia: All-Time High Is In Sight, Upgrade To Strong Buy (NASDAQ:NVDA)” (Jun 13, 2025).
- [12] Bloomberg, “Nvidia (NVDA) Chart Watchers Brace for More Pain With Dip Buyers at Bay” (Mar 5, 2025).
- [13] Nasdaq, “NVDA Quantitative Stock Analysis” (Mar 11, 2025).
- [14] Bloomberg, “Nvidia Decline to a Five-Month Low Is Day’s Biggest Options Bet” (Feb 27, 2025).