Strong Buy Calls Persist on Nvidia (NVDA) After Earnings Jolt and AI Growth Guidance
Nvidia shares are under pressure after earnings even as the stock approaches a historically strong 95-day seasonal stretch, setting up a clash between AI optimism and a sizable bearish options bet.

Key takeaways
- Nvidia’s upcoming 95-day window starting Mar 21 has historically been a strong long-biased period, with the pattern aligned to the upside.
- Across six years of data, the window has been profitable 83% of the time, with 5 winners and 1 loser.
- Winning years have averaged a 47.03% gain, while including all years brings the average outcome down to 33%, reflecting one deep losing year.
- Historical best-case runs have been large, but adverse moves within the window have also been significant in weaker years, underscoring elevated volatility risk.
- The pattern tends to show strong cumulative gains over the full window, though individual years have varied in how quickly those moves develop.
- Today’s post-earnings pullback and a previously reported large bearish options position add tension to an otherwise constructive seasonal backdrop.[14]
According to historical data from TradeWave.ai, Nvidia’s behavior in this specific spring-to-early-summer stretch has shown a distinct pattern in recent years. The following section looks at how that seasonal backdrop lines up with today’s price action and fundamental story.
Seasonal window
This seasonal window begins on Mar 21, 2026 and spans 95 days, and it has historically been a strong stretch for Nvidia with a clear long-side bias. Today the stock closed at $185.34, down 5.2% on the day, leaving investors weighing a sharp post-earnings pullback against what has often been a favorable period for the shares.[3] In Feb 2025, options traders placed a massive bearish bet on Nvidia declining toward $115 by early March, highlighting how positioning can sometimes lean defensively even around powerful seasonal tendencies.[14] The combination of a historically constructive window, current volatility and evidence of prior downside hedging sets up a potentially important test of whether the pattern can reassert itself this year.
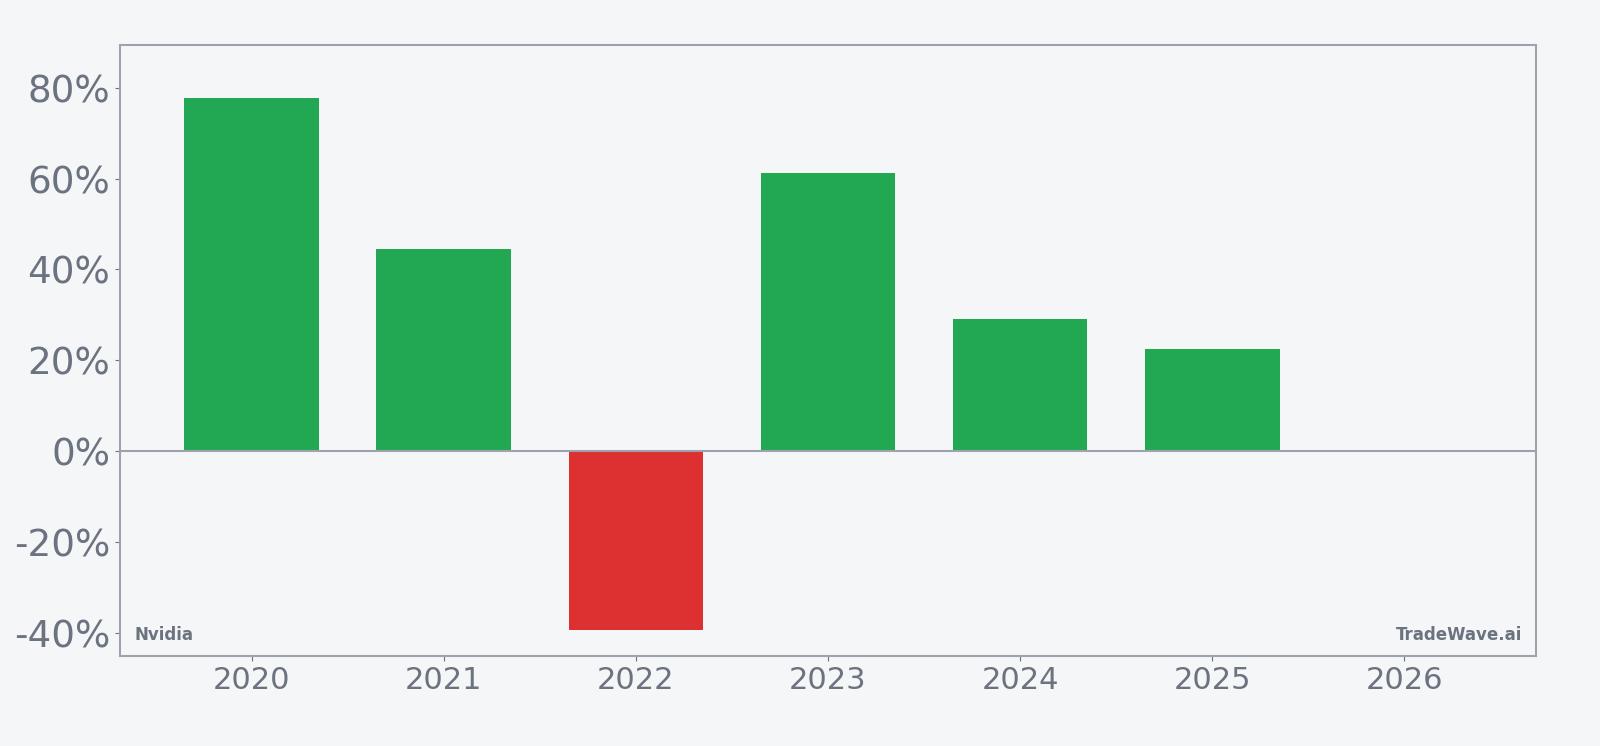
Historically, this long-directed pattern has produced gains in five of the past six years, with the profitable years averaging a 47.03% advance over the 95-day span and the inclusion of the single losing year pulling the all-years average down to 33%. The one down year in 2022 saw a net loss of 39.3%, which is why the average loss figure is sizable even though most years have been positive. That mix of strong winners and one deep loser is reflected in the 83% Percent Profitable reading, with 5 winners and 1 loser across the sample.
The per-year detail shows how varied the path can be. In 2020, Nvidia gained 77.8% in the window, with a best intraperiod run-up of 81.43% and only a modest 7.22% worst drawdown from the entry. By contrast, 2022 delivered a net decline of 39.3%, with the worst intraperiod drop reaching 42.65% even though the best rally within that same window briefly reached 8.27%. That combination illustrates how the maximum favorable move and maximum adverse move can both be large, underscoring that even a historically strong window can involve sharp swings in both directions.
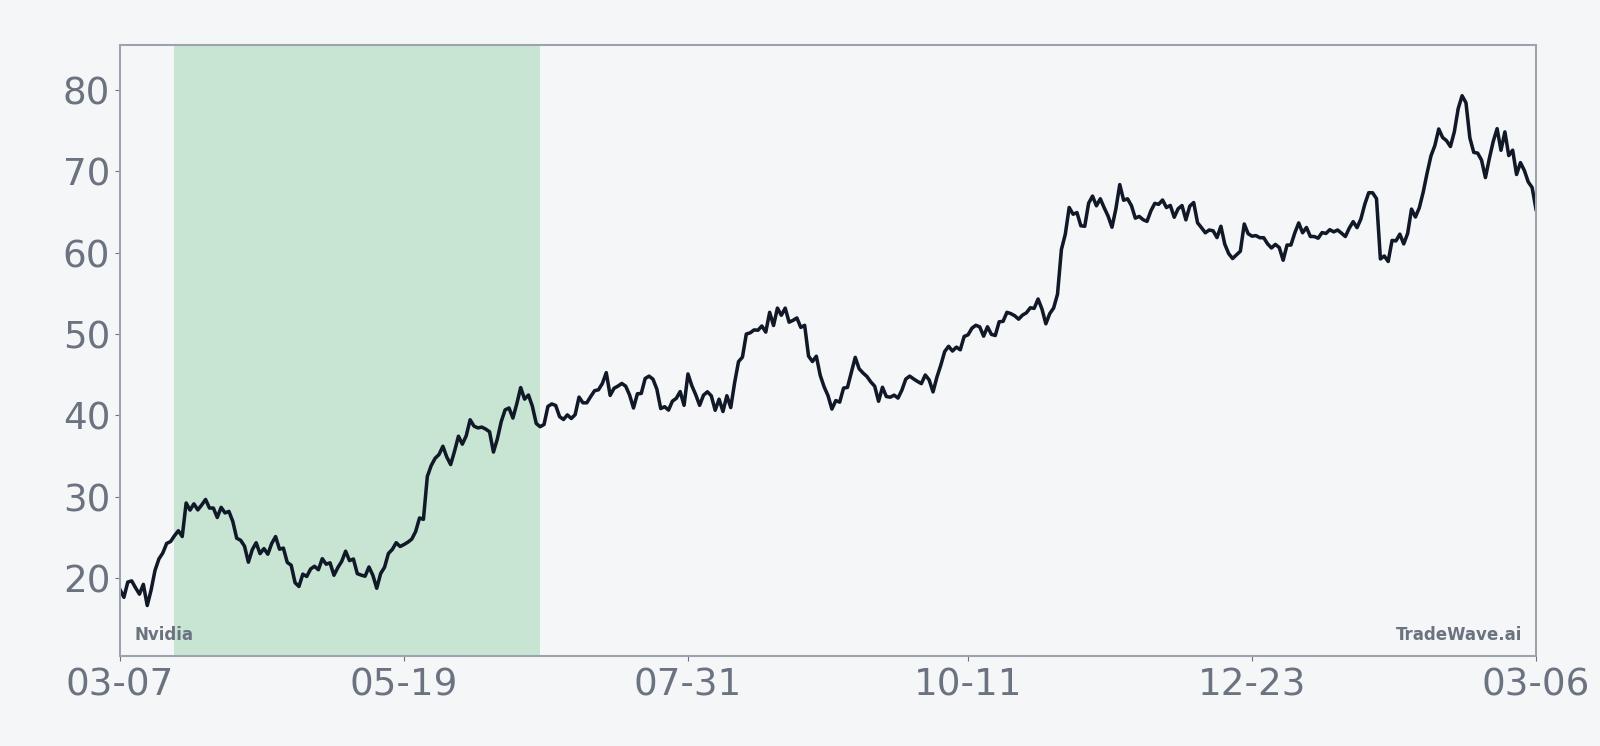
The six-year seasonal trend profile points to a tendency for gains to build over the full 95 days rather than being front-loaded into a narrow slice of the window. The average path suggests that, in winning years, strength has often persisted into the later stages of the period, while weaker years have tended to show their stress earlier through deeper drawdowns. The cumulative return chart for the pattern reinforces this picture, with a generally rising multi-year line that is punctuated by the 2022 setback rather than a smooth, linear climb.
A combined view of net results with peak rallies and worst drawdowns highlights how upside and downside have coexisted within this window.
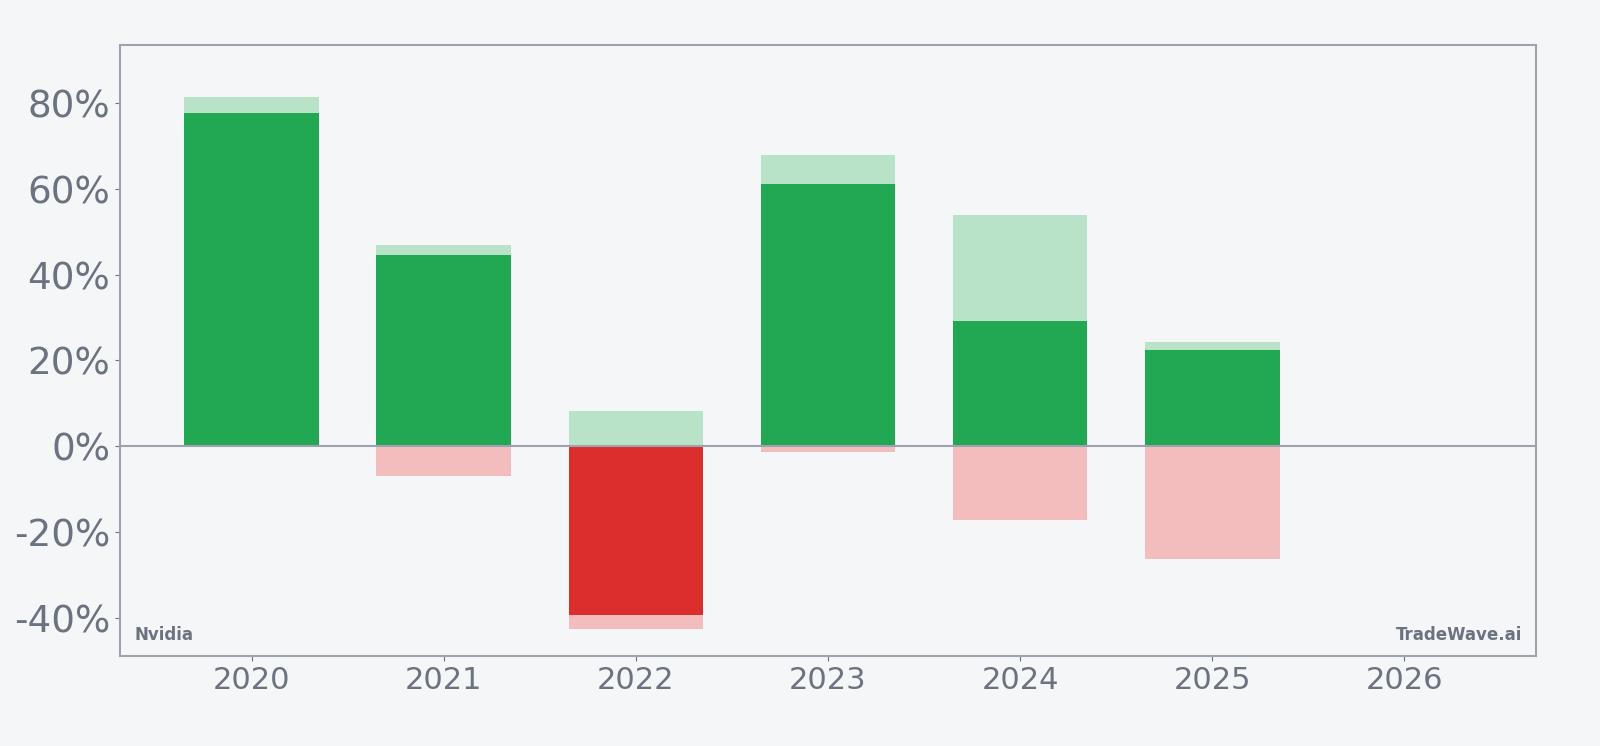
Viewed through that lens, the window looks historically favorable but not low risk. Years like 2023, with a 61.13% net gain and only a 1.33% worst drawdown, show how powerful the pattern can be when the trend is aligned. Others, such as 2024 and 2025, combine solid net gains of 29.18% and 22.5% with worst intraperiod drops of 17.31% and 26.41%, respectively, indicating that even ultimately successful years have required investors to tolerate sizable swings along the way. Taken together, the historical pattern defines the quantitative seasonal backdrop for the current period.
History does not guarantee future results; adverse excursions (MAE) can be large even in winning windows.
Price and near-term drivers
Nvidia closed Thursday at $185.34, down 5.2% after its latest quarterly report, as traders digested fresh numbers and guidance following the company’s Q4 and fiscal 2026 earnings release on Feb 25.[3] The stock’s pullback comes against a backdrop of strong reported fundamentals: in Q2 fiscal 2026, Nvidia delivered revenue of $46.7 billion, up 56% year over year, with adjusted EPS rising 54% and topping Wall Street expectations, and management has pointed to visibility into more than $500 billion in revenue through the end of next year.[1] That growth narrative has helped keep analyst sentiment firmly positive, with Barchart.com data showing a Strong Buy consensus rating and a $222 price target consensus, even as the shares remain volatile around earnings events.[1]
The chart below situates the latest move in its recent multi-month context.
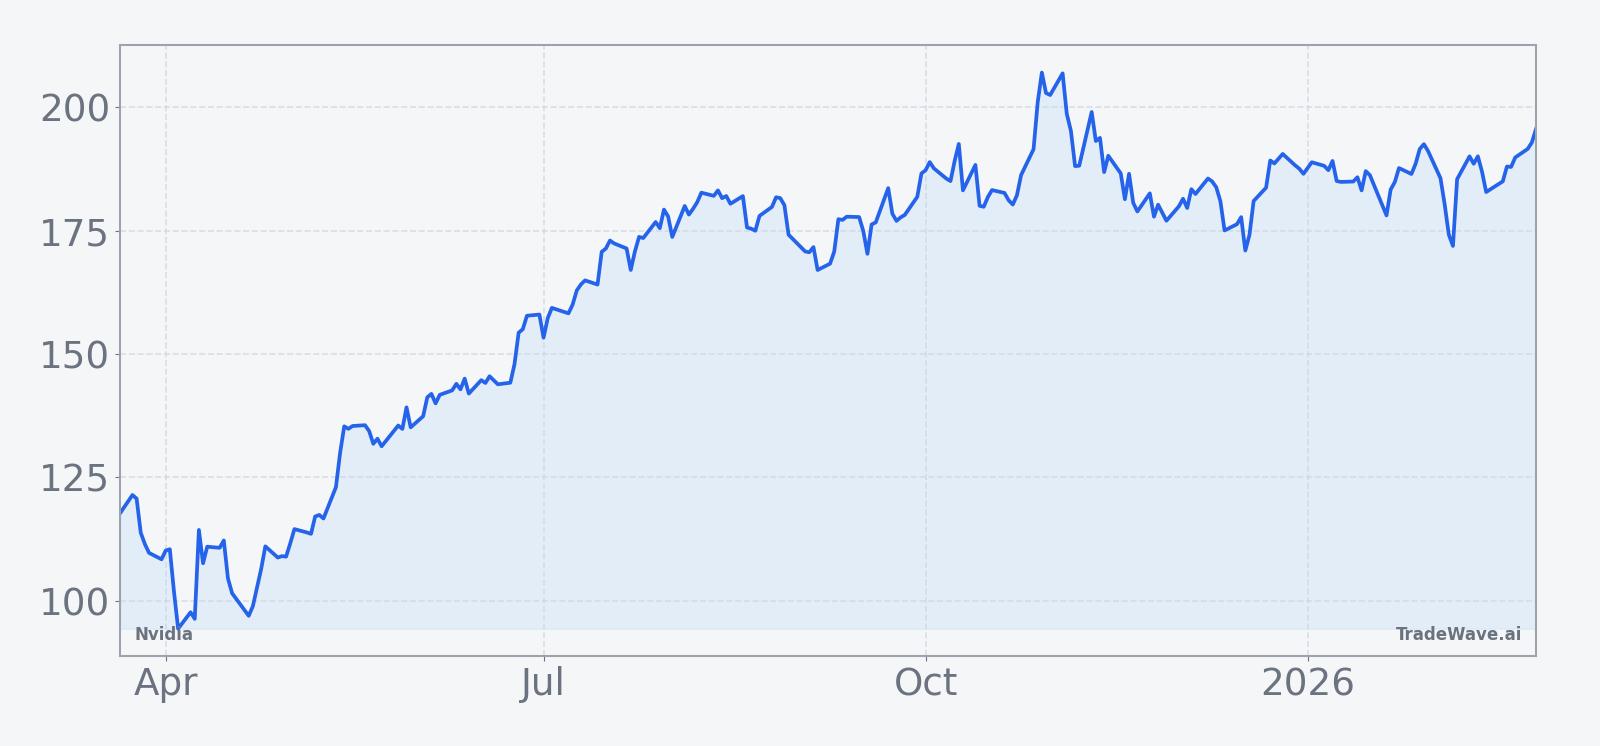
The company’s role at the center of the artificial intelligence build-out remains a key part of the bull case. MarketWatch reported in Nov 2025 that analysts saw a strong setup for Nvidia ahead of earnings, citing robust demand for its AI chips and data center products.[4] Around the same time, MarketWatch and other outlets highlighted that hyperscale cloud providers were planning a 69% increase in capital expenditures tied to AI infrastructure, a trend that has supported expectations for sustained demand for Nvidia’s accelerators.[4] Sector commentary has repeatedly emphasized that Nvidia’s performance in AI and chip technology has been a major driver of technology index gains and overall market-cap growth for the stock.[6]
At the same time, not all positioning has been one-way. In Feb 2025, Bloomberg reported that one of the day’s largest options trades was a massive bearish bet targeting a decline in Nvidia shares toward $115 by early March, effectively a wager on a double-digit drop from prevailing levels at the time.[14] That kind of downside-focused options activity illustrates how some investors have sought to hedge or speculate against the stock’s high valuation and rapid ascent, even as others have leaned into the AI growth story. Earlier in 2025, Bloomberg and Seeking Alpha both noted that chart watchers were bracing for more pain after a selloff, with debate intensifying over whether the stock was undervalued after the pullback or still vulnerable to further downside.[9][12]
Valuation has been a recurring flashpoint in that debate. In Oct 2025, Barchart.com highlighted that Nvidia had just received a new street-high price target, reflecting optimism about its long-term earnings power but also raising questions about how much of that growth was already priced in.[1] Several Seeking Alpha contributors through 2025 framed the stock as either a still-compelling growth story or a name where investors were “running out of time to sell,” underscoring how divided views have been on what constitutes a reasonable multiple for Nvidia’s AI franchise.[8][10][11] Those valuation concerns, combined with the stock’s large index weight, help explain why pullbacks around earnings can be sharp even when the fundamental story remains intact.
Looking ahead, the key question for traders is how that mix of strong reported growth, elevated expectations and occasionally bearish positioning will interact with the approaching seasonal window. If the historical pattern of strong spring-to-early-summer performance reasserts itself, it would do so against a backdrop of high sensitivity to earnings guidance, AI spending headlines and any shifts in options or short-interest data. Conversely, if the stock were to struggle through the window, it would echo the 2022 experience in which a single weak year stood out against an otherwise constructive seasonal history.
What to watch as the window approaches
With the 95-day seasonal window set to begin on Mar 21, investors will be watching several signposts. First, the stock’s behavior in the weeks leading up to the start date will matter: a stabilization above recent lows followed by improving momentum would be more consistent with the historical pattern of strong long-side outcomes, while continued heavy selling into the window would raise the risk of a repeat of the lone losing year in the sample.
Second, earnings follow-through will be critical. Markets will scrutinize whether Nvidia’s post-report commentary on AI demand and its stated visibility into more than $500 billion in revenue through the end of next year continues to hold up against actual order trends and hyperscaler spending data.[1][4] Any signs that large cloud customers are delaying or trimming AI-related capex could weigh on the stock during a period that has historically been favorable.
Third, traders will keep an eye on options and positioning. The large bearish bet reported in Feb 2025 showed that downside hedging and speculative shorts can build even when the fundamental story is strong, and similar patterns of heavy put buying or skew toward downside protection would signal that some investors remain cautious heading into the seasonal window.[14] A shift toward more balanced or call-heavy flow, by contrast, would suggest that the options market is leaning more in line with the historical long-biased pattern.
Finally, price levels and volatility inside the window will offer a real-time test of the seasonal backdrop. Historically, strong years have seen sizable rallies with relatively contained drawdowns, while weaker years have featured deeper adverse moves even when intraperiod rallies occurred. If Nvidia can hold key support zones established during the current pullback and build a series of higher highs and higher lows through late spring, it would align with the pattern’s constructive history. A failure to do so, especially if accompanied by renewed bearish positioning, would signal that this may be one of the exceptions in an otherwise strong seasonal record.
Sources
- [1] Barchart.com, “Nvidia Stock Just Got a New Street-High Price Target. Should You Buy NVDA Now?” (Oct 27, 2025)
- [2] Barchart.com, “Analysts Have High Hopes for Nvidia Ahead of August 27. Should You Buy NVDA Stock Here?” (Aug 22, 2025)
- [3] The Motley Fool, “Nvidia Earnings: What to Watch for on Feb. 25” (Feb 25, 2026)
- [4] MarketWatch, “Nvidia’s stock has a strong setup ahead of next week’s earnings, this analyst says” (Nov 13, 2025)
- [5] Bloomberg, “Nvidia (NVDA) Earnings: Key Takeaways From Fourth-Quarter Report” (Feb 26, 2025)
- [6] Yahoo Finance, “Nvidia CEO drops 8 bombshell quotes about its future” (Aug 30, 2025)
- [8] Seeking Alpha, “Nvidia: You're Running Out Of Time To Sell (NASDAQ:NVDA)” (Nov 26, 2025)
- [9] Seeking Alpha, “Nvidia stock analyzed amid recent selloff (NVDA:NASDAQ)” (Mar 8, 2025)
- [10] Seeking Alpha, “Nvidia: It's Not A Bubble, It's A Dam (NASDAQ:NVDA)” (Oct 16, 2025)
- [11] Seeking Alpha, “Nvidia: All-Time High Is In Sight, Upgrade To Strong Buy (NASDAQ:NVDA)” (Jun 13, 2025)
- [12] Bloomberg, “Nvidia (NVDA) Chart Watchers Brace for More Pain With Dip Buyers at Bay” (Mar 5, 2025)
- [13] Nasdaq, “NVDA Quantitative Stock Analysis” (Mar 11, 2025)
- [14] Bloomberg, “Nvidia Decline to a Five-Month Low Is Day’s Biggest Options Bet” (Feb 27, 2025)