Fed Rate Uncertainty Keeps Dow Jones Industrial Average (DJI) Near Records as Investors Brace
Dow Jones Industrial Average is hovering near record territory as it approaches a long seasonal window that has delivered steady gains over the past decade, even as sector rotation and macro uncertainty continue to shape trading.

Key takeaways
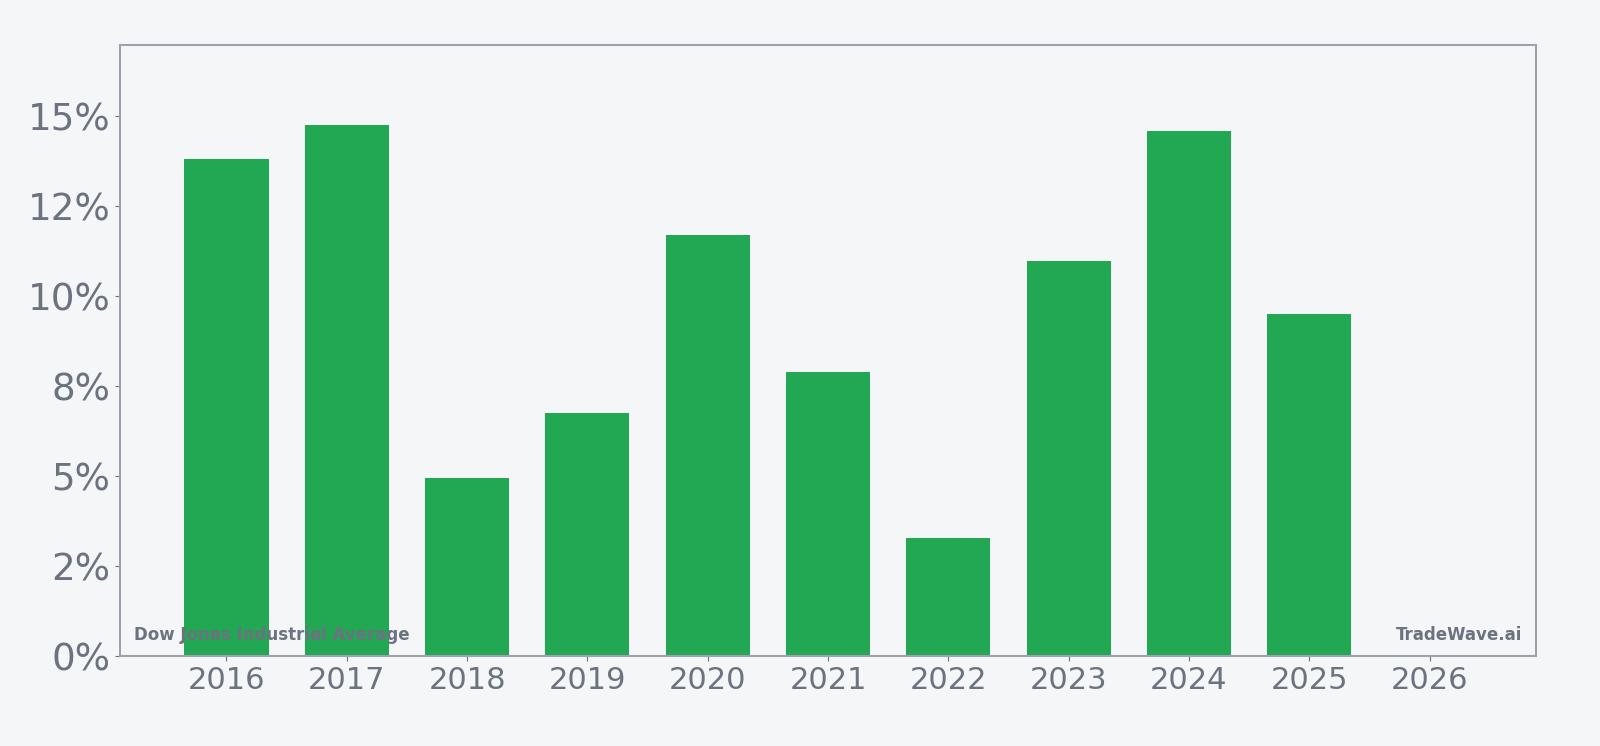
- Dow Jones Industrial Average is about to enter a 276-day seasonal window starting Mar 1 that has historically been strongly positive for the index.
- Across the past 10 years, this window has been profitable in 100% of cases, with 10 winners and 0 losers for a long-direction pattern.
- Average profit in winning years has been 9.82%, with a cumulative gain of 153% and an annualized return of 9.75% over the sample.
- The pattern’s Sharpe ratio of 1.68 and TradeWave Ratio of 2.84 point to a favorable risk-adjusted profile with meaningful travel in the trade direction.
- Intraperiod swings have varied, with some years showing deep temporary drawdowns, underscoring that adverse moves can be large even when the window ultimately finishes higher.
- The setup arrives as the Dow trades near record highs, following a series of milestones in late 2025 and early 2026 that reflected rotation into value and cyclicals.[7]
According to historical data from TradeWave.ai, the coming months line up with one of the Dow’s most consistently constructive seasonal stretches over the past decade. The next section looks at how that pattern has behaved and how it fits with today’s backdrop.
Seasonal window
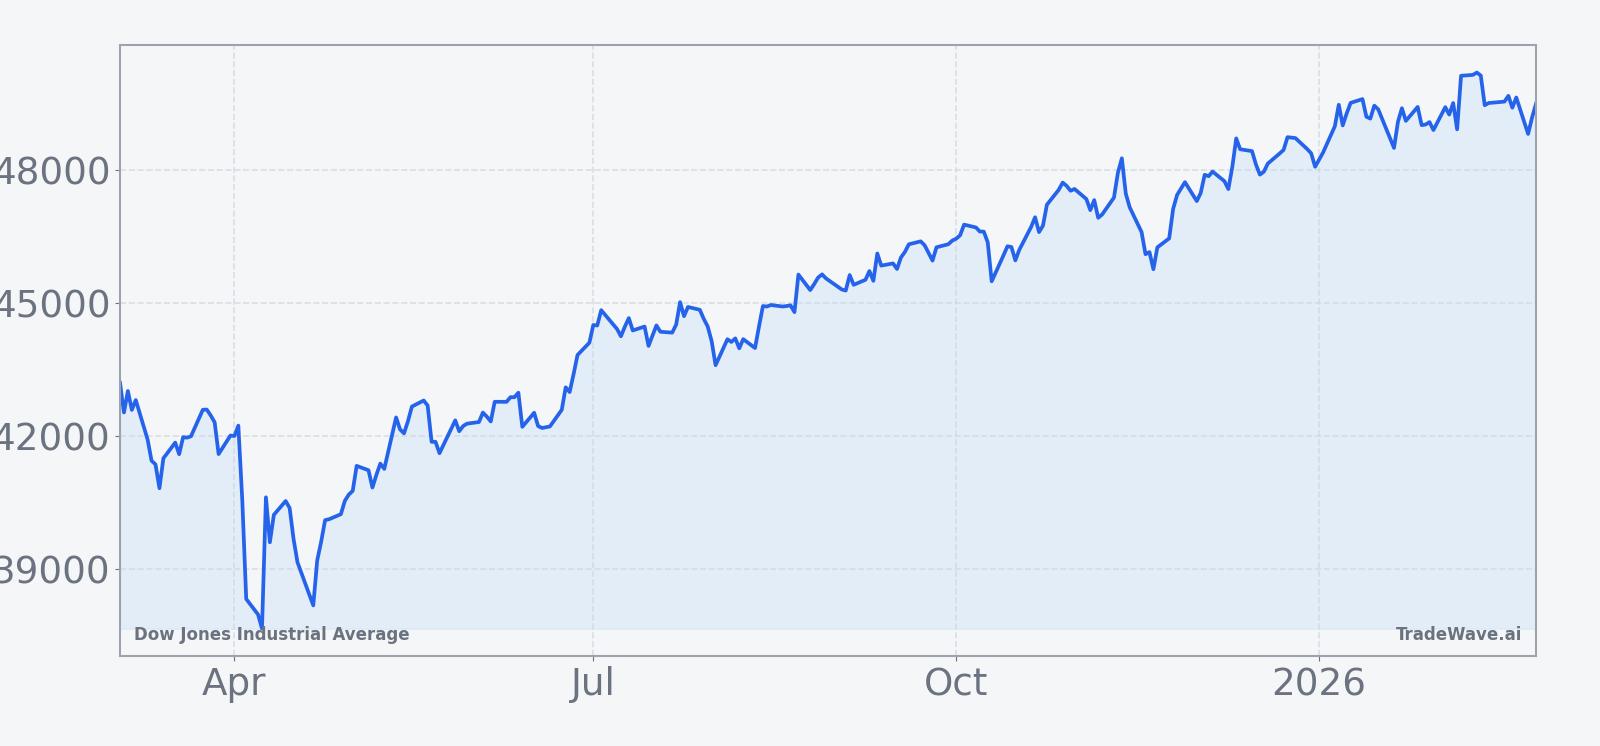
This seasonal window begins on 2026-03-01 and spans 276 days. Historically, during this period, Dow Jones Industrial Average has shown a strong upside tendency in line with a long-direction pattern. The index last closed at 49,523.14, edging up 0.08% on the day and holding close to record levels set in early January as investors weigh how long the current advance can persist.[7]
The 10-year average seasonal trend suggests that gains in this window tend to build steadily rather than in a single burst, with the index typically advancing in stages and consolidating along the way. That profile is consistent with a long-duration regime where cyclical sectors, financials and industrials often contribute over different parts of the year.
A second view of the pattern highlights how far the Dow has historically traveled in both favorable and adverse directions within the window.
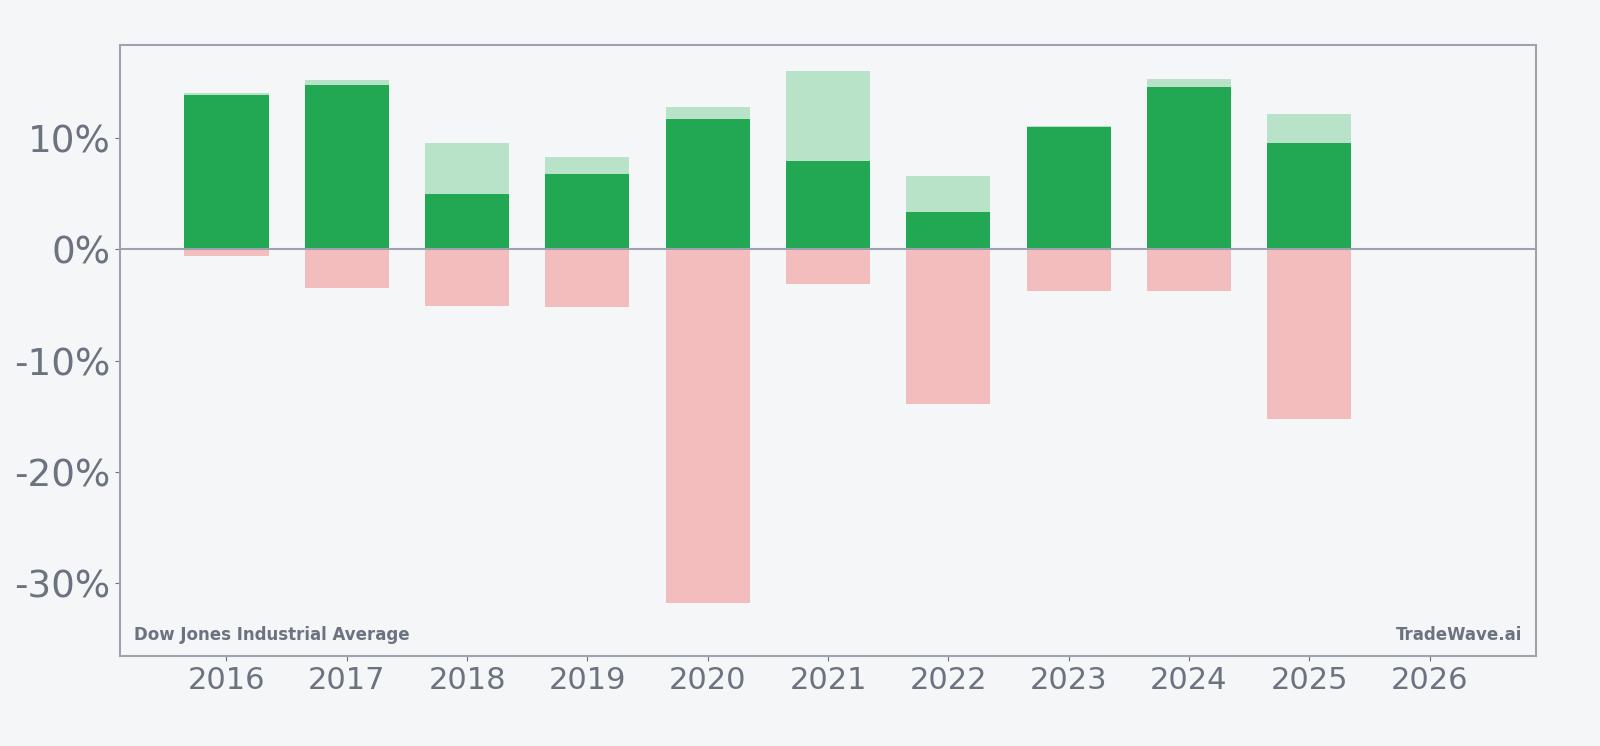
The combined net, maximum favorable move and maximum adverse move bars show that while every year in the sample finished higher, the path was not always smooth: 2020 and 2022, for example, saw sizeable worst-case drawdowns within the window even as they ultimately closed with gains. Taken together, the historical pattern defines the quantitative seasonal backdrop for the current period.
History does not guarantee future results, and adverse excursions can be large even in winning windows.
Price and near-term drivers
Dow Jones Industrial Average finished Thursday at 49,523.14, up 40.99 points or 0.08%, extending a stretch of trading near record highs that began after the index logged a fresh closing peak on Jan 5, 2026.[7] That milestone followed a strong late-2025 run in which the Dow outpaced more tech-heavy benchmarks as investors rotated toward energy, healthcare and other value-oriented sectors.[4]
In Nov 2025, the Dow’s “banner day” was driven by a pivot away from the S&P 500’s largest technology winners and into a broader mix of industrial, financial and defensive names, underscoring the index’s role as a beneficiary of sector rotation rather than pure growth momentum.[4] By late December, major indices, including the Dow, were finishing higher into the holiday-shortened week, helped by optimism around seasonal trends even as investors remained mindful of economic risks.[5]
That backdrop came after a choppy stretch in the second half of 2025, when struggling technology stocks and uncertainty over Federal Reserve rate decisions weighed on broader sentiment and periodically pulled major indices lower.[1] In August 2025, Wall Street’s main benchmarks slipped as traders digested retail earnings and the latest Fed meeting minutes, with the tech-focused Nasdaq bearing the brunt of the selling while the Dow proved relatively more resilient thanks to its sector mix.[2]
There were also episodes when single-stock moves hit the Dow directly. On Dec 9, 2025, a 4.7% drop in JPMorgan Chase shares dragged the index lower ahead of a key Fed interest-rate decision, highlighting how financials can amplify macro concerns inside the price-weighted benchmark.[6] Yet by late December, the tone had improved, and the Dow was again participating in a broad holiday rally that set the stage for the record close in early January.[5][7]
Macro uncertainty has remained a recurring theme, with investors toggling between optimism about eventual rate cuts and concern that economic instability or a potential recession could undercut earnings growth.[1] That tension has helped keep attention on the Dow’s sector composition, which leans more heavily toward industrials, financials, healthcare and consumer staples that can sometimes fare better than high-growth tech when rates stay elevated or volatility rises.[1][4]
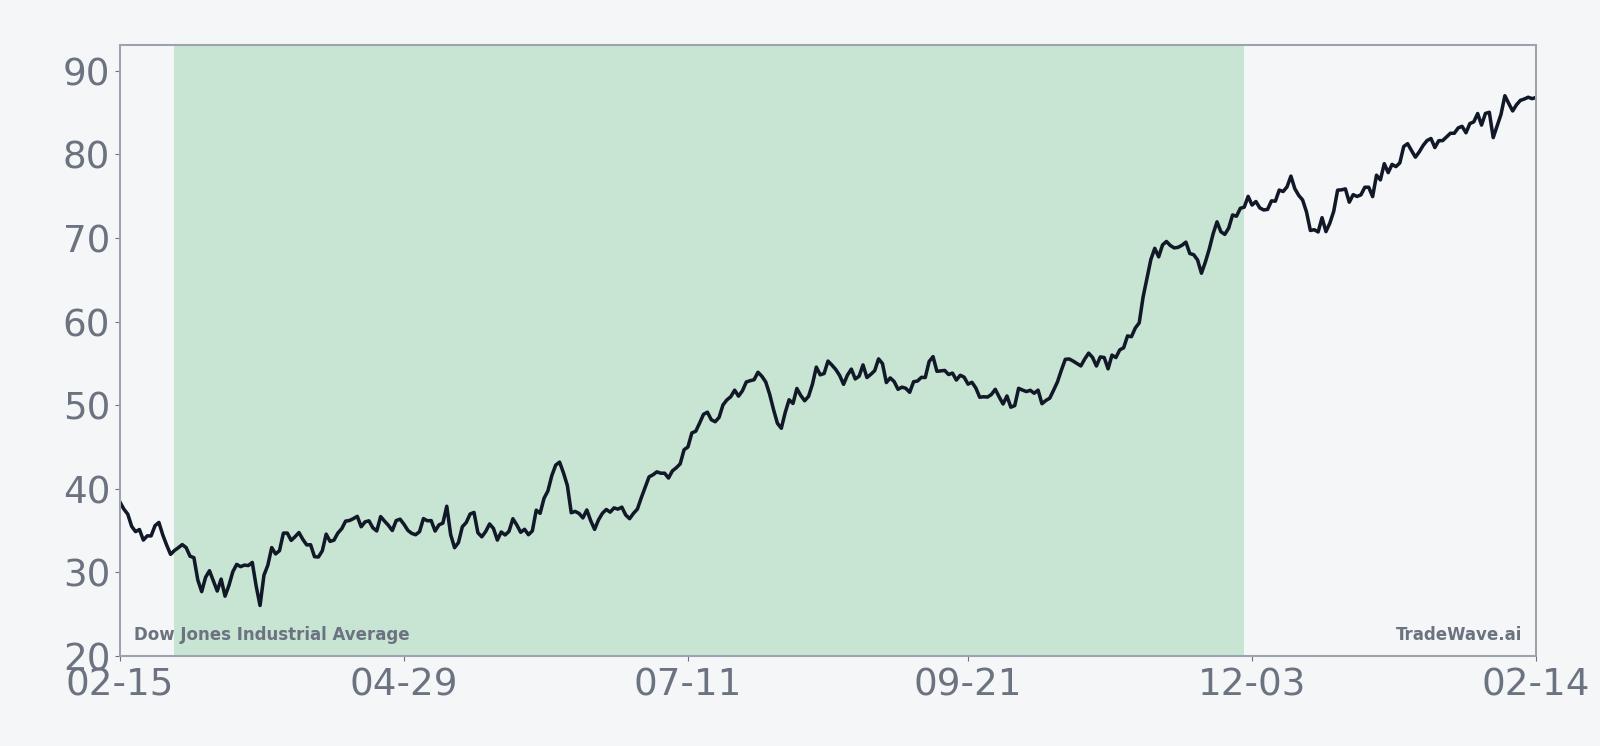
The chart below situates the latest move in its recent multi-month context.
What to watch as the window opens
As the 276-day seasonal window begins on Mar 1, the key question for traders and portfolio managers is how a historically strong pattern interacts with an index already trading near record highs. The long-direction bias and 10-for-10 winning track record in the sample underline that this stretch has often rewarded patience, but the history of sizable intraperiod drawdowns in some years is a reminder that the ride can be bumpy.
Several concrete markers will matter. First, breadth within the Dow and across related large-cap benchmarks will be important: if gains remain concentrated in a handful of mega-cap constituents, the seasonal pattern’s tendency toward broad-based participation may be slower to assert itself. Second, macro catalysts tied to Federal Reserve policy and growth expectations will continue to shape sector leadership, particularly for financials, industrials and energy, which have been central to prior strong years in this window.[1][4]
Third, traders will be watching how the index behaves around any pullbacks early in the window. Historically, some of the best-performing years still experienced meaningful worst-case drawdowns before recovering, so the depth and speed of any early declines will help determine whether the pattern is tracking closer to the smoother years or the more volatile ones. Finally, behavior around prior record levels will be closely monitored: sustained support near or above the early-January highs would be more consistent with the historical seasonal bias, while a prolonged break lower would signal that other forces are overpowering the pattern.[7]
For investors using seasonality as one input among many, the message is straightforward. The coming 276 days have, in the past decade, lined up with one of the Dow’s more constructive regimes, but the same history also shows that even strong windows can include sharp setbacks. How the index trades through upcoming macro events, sector rotations and any tests of support will reveal whether this cycle is inclined to follow the familiar script or write a different one.
Sources
- [1] Seeking Alpha, "U.S. stocks fall as tech sector struggles, rate-cut uncertainties rattle markets," Sep 24, 2025.
- [2] Seeking Alpha, "Wall Street moves lower as investors digest retail earnings and Fed minutes," Aug 20, 2025.
- [3] Seeking Alpha, "Cantor Fitzgerald doesn’t believe in Wall Street’s recent reprieve rally," Mar 21, 2025.
- [4] MarketWatch, "Dow’s banner day points to investor pivot beyond S&P 500’s top winners," Nov 11, 2025.
- [5] Seeking Alpha, "Wall Street finished higher to kick off the holiday shortened trading week," Dec 22, 2025.
- [6] The Wall Street Journal, "JPMorgan’s Stock Slide Weighs on Dow Industrials," Dec 9, 2025.
- [7] Barron's, "These Stocks Moved the Most Today: Chevron, Valero Energy, Comcast, Tesla, CoreWeave, IBM, Coinbase, and More," Jan 5, 2026.