US-China Trade Tensions Keep CBOE Volatility Index (VIX) Elevated as Hedging Demand Builds
CBOE Volatility Index is drifting lower ahead of a 130-day seasonal window that has historically seen volatility compress, a backdrop equity traders will be watching as they weigh hedging demand and risk appetite into midyear.

Key takeaways
- A 130-day seasonal window for the CBOE Volatility Index begins on Mar 6, 2026, and has historically favored lower VIX levels.
- Over the past 10 years this window has been profitable for a short-volatility stance in 100% of cases, with 10 winners and 0 losers.
- Average profit across those winning years was 23.95%, highlighting a strong tendency for implied volatility to compress during this stretch.
- The TradeWave Ratio of 3.05 suggests VIX has typically traveled meaningfully in the short direction within the window, even beyond the final close.
- Historical best and worst intraperiod moves show that while VIX often spikes sharply during the window, subsequent declines have dominated by the end of the period.
- Traders should treat this as a statistical backdrop rather than a forecast, since adverse swings inside the window have at times been large before volatility ultimately eased.
According to historical data from TradeWave.ai, this upcoming stretch has shown a distinct seasonal bias in prior years. The next section looks at how that pattern has behaved and what it could mean for volatility into midyear.
Seasonal window
This seasonal window begins on Mar 6, 2026 and spans 130 days. Historically, during this period, CBOE Volatility Index has shown a weak directional tendency, with volatility often fading from elevated levels as the window progresses. VIX last closed at 17.61 on Feb 25, slipping 1.8% on the day and sitting in the mid-teens range that many traders associate with a relatively calm equity backdrop.[9]
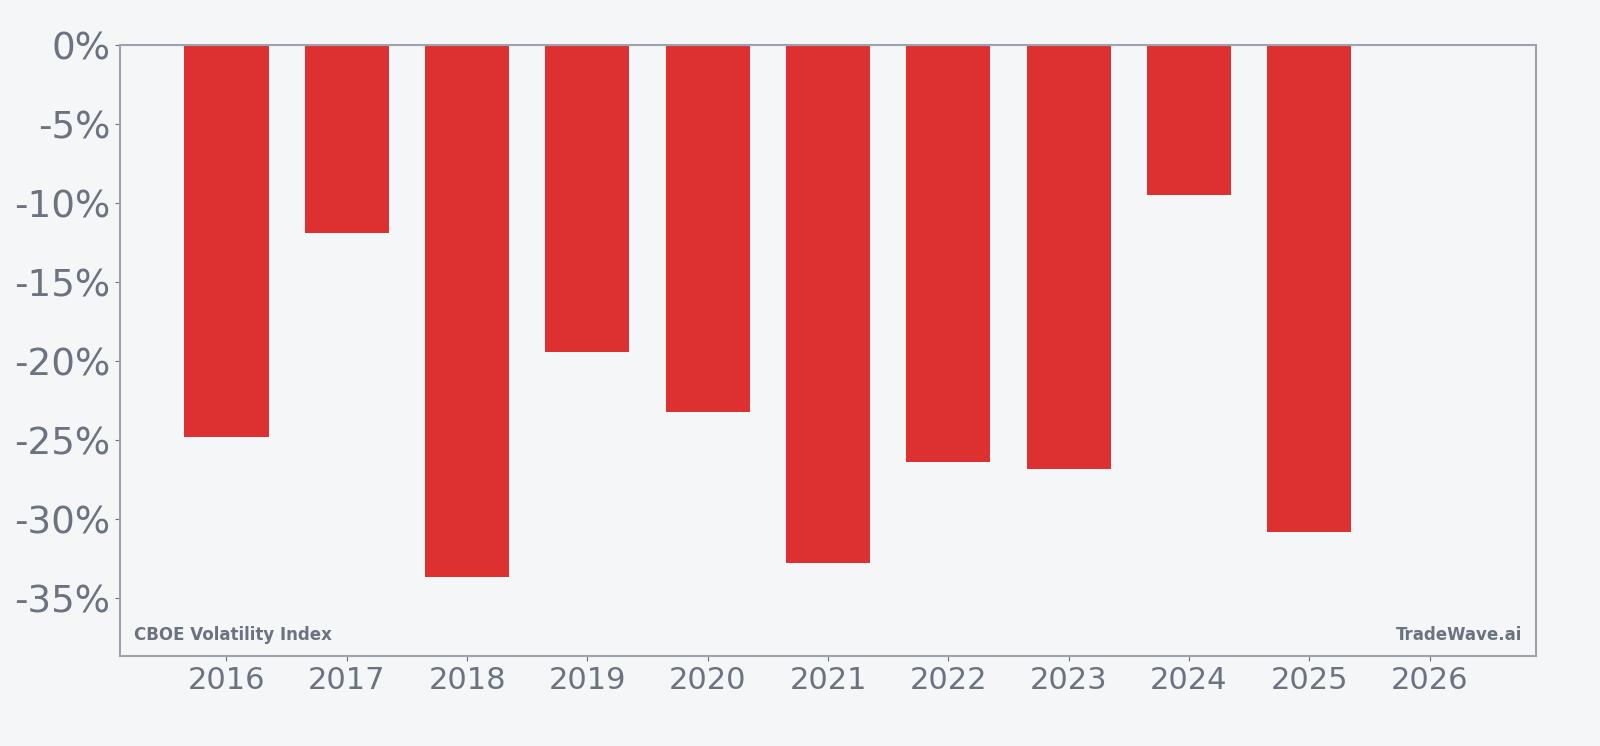
Across the 10-year sample, the pattern has aligned with a short-volatility stance: every year from 2016 through 2025 saw VIX end the window lower than it began, producing a 100% Percent Profitable record with 10 winners and 0 losers. Average profit of 23.95% means that, in a typical year, VIX finished the window almost one quarter below its starting level, even though the path between entry and exit could be choppy.
The per-year table highlights how this has played out in practice. The strongest year for the pattern was 2018, when VIX fell 33.66% from entry to exit despite experiencing a sizeable intraperiod spike, while the softest outcome was 2024, when the index still declined 9.52% over the window. In each case, the final result favored lower volatility by the end of the 130 days, consistent with the short trade direction.
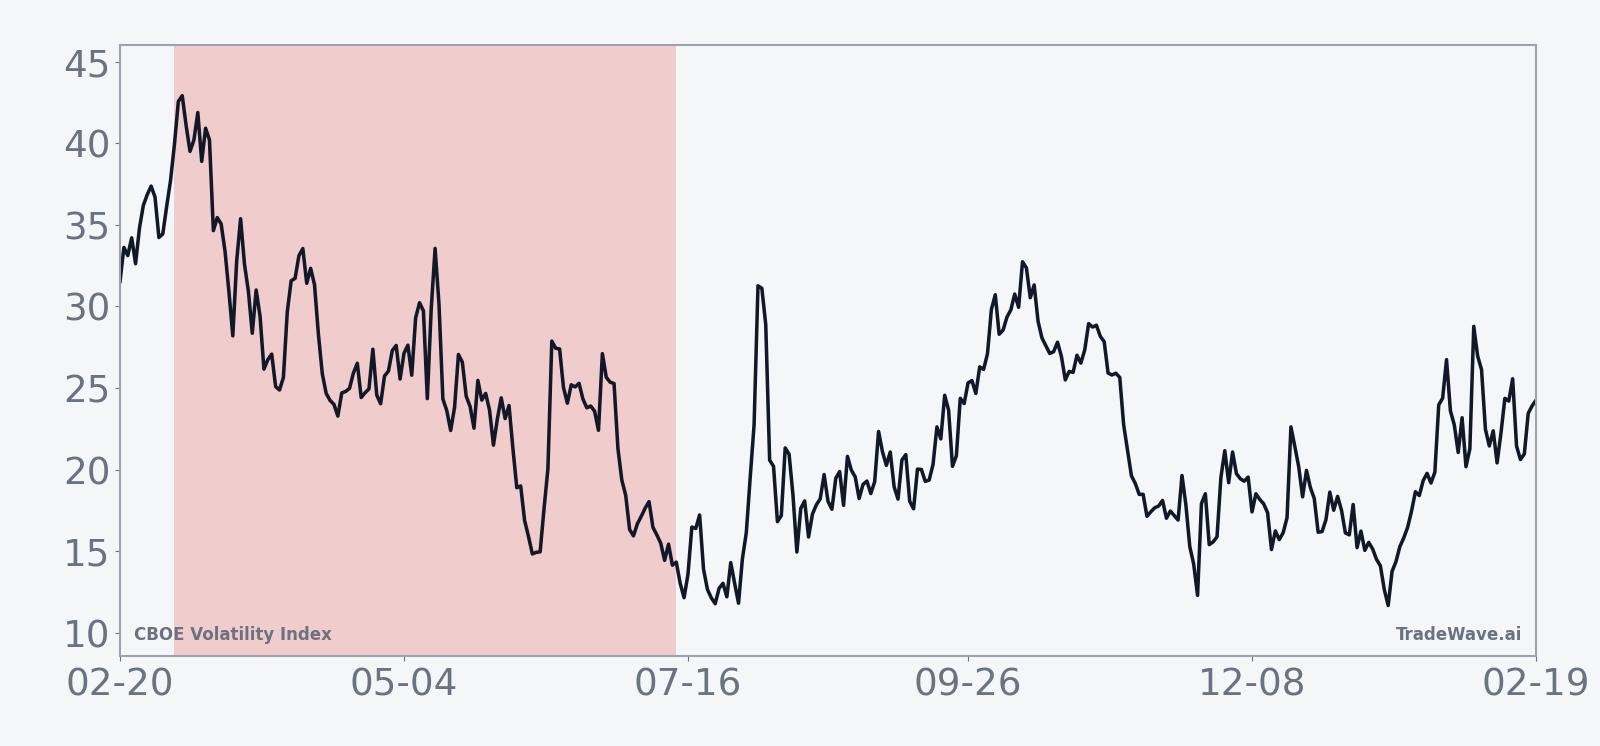
The 10-year average seasonal trend suggests that VIX often sees its most meaningful downside progress in the middle portion of the window, with declines tending to accumulate after any early spikes. The cumulative return profile, reflected in the summary statistics, points to a 738% cumulative return for the short pattern and an annualized return of 23.7%, paired with a Sharpe ratio of 2.74 that indicates historically strong risk-adjusted performance for this specific seasonal setup.
Year-by-year extremes in the pattern show how far VIX has tended to swing inside the window before settling lower.
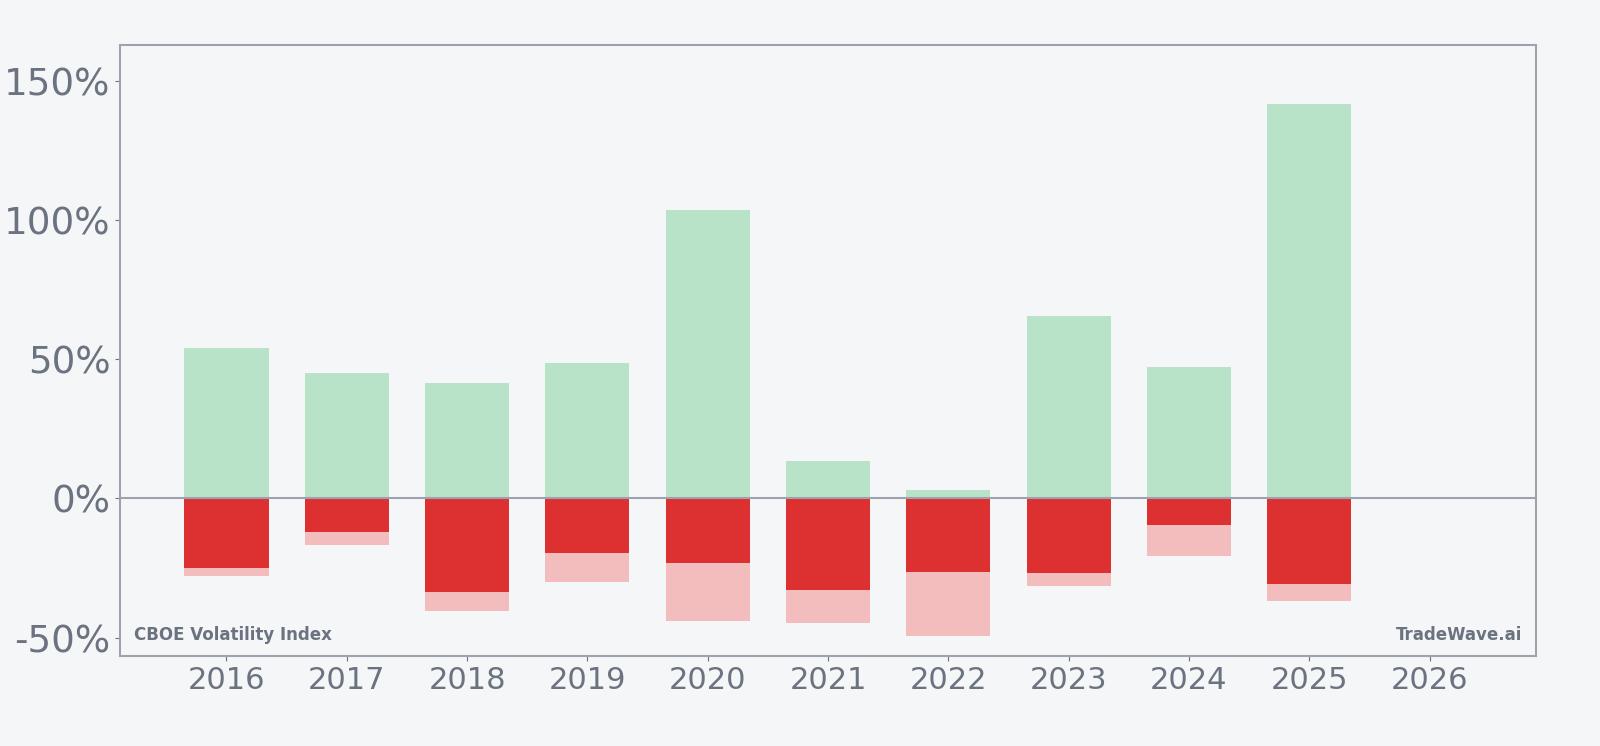
The combination of net returns with maximum favorable and adverse excursions underlines how volatile this “weak VIX” window can be. In 2020 and 2025, for example, VIX saw maximum favorable moves of 103.79% and 141.78% respectively, meaning the index more than doubled at its intraperiod peak before retreating, while maximum adverse moves such as the -49.38% reading in 2022 show that deep drawdowns from the entry level have also occurred. This mix of large positive and negative swings, paired with consistently lower end-of-window closes, suggests a regime where volatility spikes have historically been sold rather than sustained.
Taken together, the historical pattern defines the quantitative seasonal backdrop for the upcoming period.
History does not guarantee future results, and adverse excursions can be large even in windows that ultimately finish profitably.
Price and near-term drivers
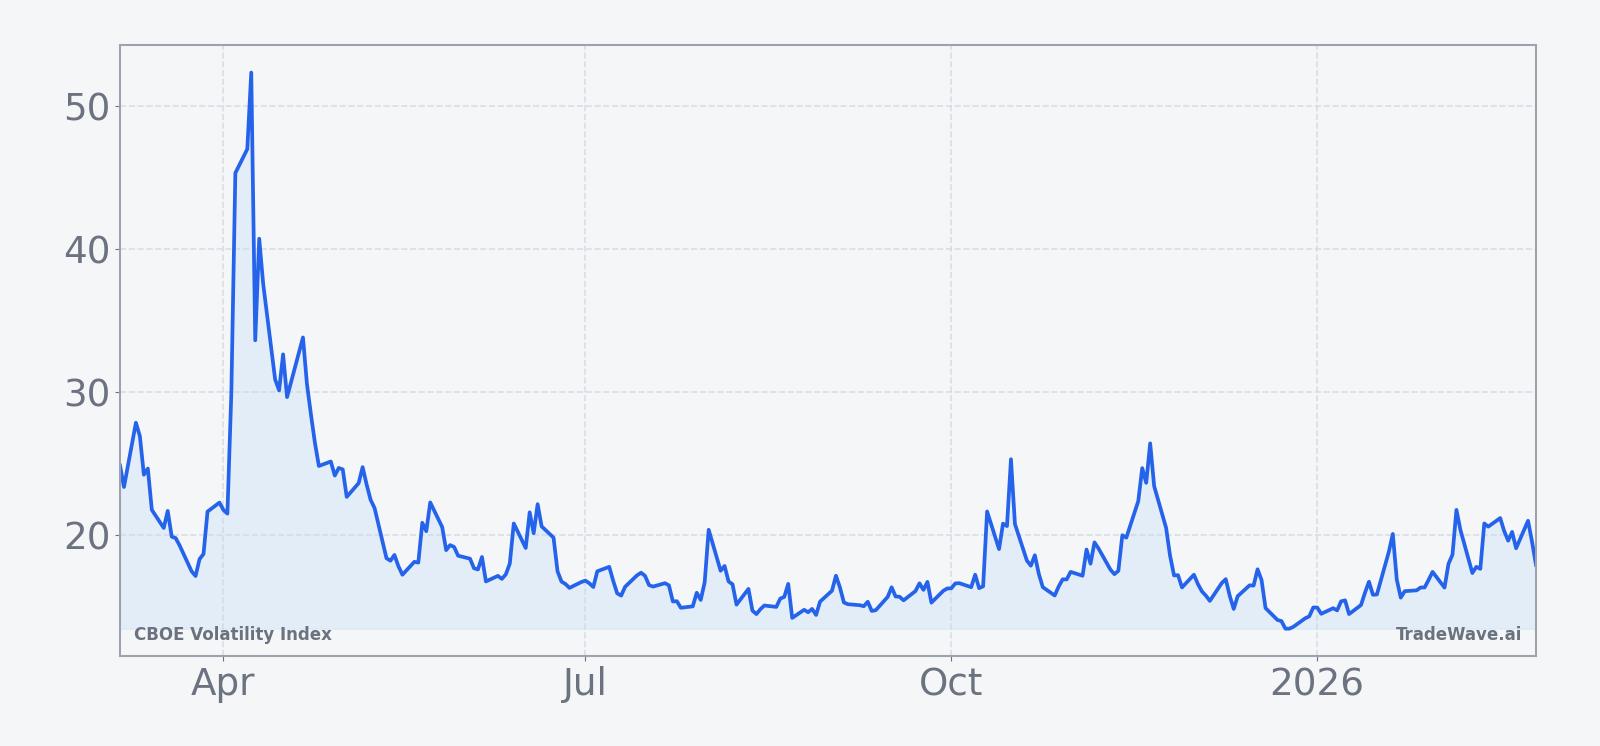
CBOE Volatility Index closed at 17.61 on Feb 25, down 1.8% on the day, as equity markets continued to trade in a relatively calm range and demand for near-term protection eased.[9] VIX has spent much of the past several weeks in the mid-teens, a level that many institutional investors view as consistent with a constructive risk backdrop rather than outright complacency, especially after the elevated readings seen during prior trade and policy shocks.[2][6][14]
In January, some derivatives strategists highlighted that the market appeared “too calm” relative to the macro and policy risks on the horizon, pointing to low implied volatility and modest hedging activity even as investors debated growth, inflation and geopolitical uncertainty.[9] That tension between subdued day-to-day swings and a long list of potential catalysts has kept attention on VIX as a barometer of whether investors are underpricing tail risk or simply comfortable with the current earnings and policy trajectory.
Historically, episodes of tariff and trade anxiety have produced abrupt spikes in VIX as investors rushed to add downside protection, with readings in 2025 climbing toward 30 and, at times, into the mid-40s when policy headlines surprised markets.[2][12][14] Those episodes underscored how quickly implied volatility can reprice when macro narratives shift, even if the subsequent path often involved a gradual bleed lower as fears subsided and equity indices stabilized.
Options positioning has periodically reflected that dynamic, with some volatility-focused investors using high volumes of VIX calls and related instruments to hedge against sudden market breaks during periods of heightened political and trade uncertainty.[8] While that activity is not constant, it has tended to cluster around moments when policy signals were most unpredictable, reinforcing VIX’s role as a real-time gauge of how aggressively investors are paying for insurance against equity drawdowns.
The chart below situates the latest move in its recent multi-month context.
Macro backdrop and equity implications
VIX’s behavior matters because it is tightly linked to expectations for future equity volatility: implied volatility typically compresses when investors are confident in the earnings and policy outlook, and it tends to expand sharply when risk-off episodes or abrupt drawdowns hit major indices.[1][9] The current mid-teens level suggests that, for now, markets are assigning relatively low odds to an imminent shock, even as they remain alert to potential surprises from trade policy, central banks and geopolitics.
In 2025, renewed US-China trade tensions and tariff threats repeatedly pushed VIX higher as investors reassessed the potential impact on global growth and corporate margins.[1][12][14] Those moves were often short-lived, however, with volatility receding once headlines softened or policy guidance became clearer, a pattern that aligns with the historical tendency for VIX to spike on shocks and then grind lower as uncertainty is resolved.
Policy volatility has been a recurring theme in recent years, with shifting rhetoric on tariffs and trade contributing to a more fragile equilibrium in risk assets.[2][9] For equity investors, the upcoming seasonal window for VIX will sit against that backdrop: if macro conditions remain relatively stable, the historical pattern of volatility compression could reinforce a constructive environment for stocks, while any surprise policy or growth scare could test how durable that seasonal tendency really is.
What to watch as the window opens
As the Mar 6 window approaches, traders will be watching whether VIX can stay anchored in the mid-teens or whether preemptive hedging pushes it higher ahead of key macro and policy events. A sustained move back into the low teens early in the window would be consistent with the historical pattern of volatility fading over this 130-day stretch, while a break toward the high teens or low 20s that persists could signal that macro risks are overwhelming the usual seasonal pull.
Options flow will be an important tell: if demand for VIX calls and related hedges builds meaningfully, echoing prior episodes when investors used volatility products to guard against policy shocks, it could create larger intraperiod swings even if the index ultimately drifts lower by the end of the window.[8] Conversely, muted hedging activity would suggest that investors are comfortable leaning on the historical tendency for volatility to compress into midyear, at least until a new catalyst emerges.
Equity traders will also focus on how major indices respond to any VIX spikes inside the window. Historically, some of the largest maximum favorable moves in VIX during this period have coincided with sharp but temporary equity pullbacks, followed by recoveries as volatility retreated. If a similar pattern plays out, brief surges in VIX that quickly reverse would fit the seasonal template, while a prolonged period of elevated volatility would mark a departure from the past decade’s behavior.
Ultimately, the seasonal statistics frame expectations rather than dictate outcomes. The coming 130 days have, in prior years, been a time when volatility shocks were more often sold than sustained, but how VIX behaves this time will depend on the interplay between macro headlines, policy decisions and investors’ willingness to pay for protection.
Sources
- [1] Reuters, "Wall Street futures gain as corporate earnings momentum builds," Oct 20, 2025.
- [2] MarketWatch, "Wall Street’s ‘fear gauge’ soars to a rare ‘crisis’ level," Apr 7, 2025.
- [6] Bloomberg, "VIX Futures Curve Sends Distress Signal as Equities Slump," Mar 4, 2025.
- [8] Business Insider, "Inside the volatility-trading strategy one investor is using to capitalize on Trump market madness," Apr 29, 2025.
- [9] CNBC, "Some traders say the market is way too calm given the risks out there. How to hedge for a volatility spike," Jan 13, 2026.
- [10] Barchart.com, "Rosen Law Firm Encourages Soleno Therapeutics, Inc. Investors to Inquire About Securities Class Action Investigation - SLNO," Oct 5, 2025.
- [11] Barchart.com, "Agricultural Biologicals Market Size, Growth Drivers, Latest Trends, Opportunities," Oct 6, 2025.
- [12] Reuters, "Wall Street's fear gauge climbs as US-China trade fears rise," Oct 14, 2025.
- [14] Bloomberg, "VIX Nears 30 First Time Since August Shock on Tariff Anxiety," Mar 10, 2025.