Analysts See Upside Breakout Potential in S&P 500 Energy Sector SPDR (XLE) Amid Policy Uncertainty
S&P 500 Energy Sector SPDR is stepping into a 55-day seasonal stretch with a choppy long bias just as energy stocks digest last year’s gains and investors reassess macro risks and sector valuations.

Key takeaways
- The current 55-day window for S&P 500 Energy Sector SPDR has a long trade direction but a mixed record, with 4 winning years and 2 losing years in the past six.
- Percent Profitable stands at 67%, yet the all-years average outcome is a loss of -3%, reflecting the impact of a few deep drawdown years.
- Winning years have been strong, with an average gain of 6.16%, while the worst losing years have seen net declines of more than -30% over the window.
- Historical maximum favorable moves have often reached the mid-teens in % terms, but maximum adverse excursions have at times exceeded -50%, underscoring sizable intraperiod risk.
- The seasonal trend profile tilts positive overall, though returns have been uneven from year to year, with 2020 and 2025 standing out as notably weak periods.
- For investors using XLE as a proxy for the S&P 500 energy sector, this window has historically combined meaningful upside potential with the possibility of sharp downside swings.
According to historical data from TradeWave.ai, this part of the calendar has shown a distinct seasonal pattern for XLE in recent years. The next section looks at how that backdrop fits with today’s energy-sector narrative.
Seasonal window
This seasonal window is currently underway, spanning 55 days, and has historically been a volatile but slightly positive stretch for S&P 500 Energy Sector SPDR. With current price and 52-week context unavailable, the focus for investors is less on a single level and more on how XLE behaves relative to its own recent trading range as this pattern plays out. That combination of a long-biased setup and uneven outcomes makes this period particularly relevant for traders using the ETF to express sector views.
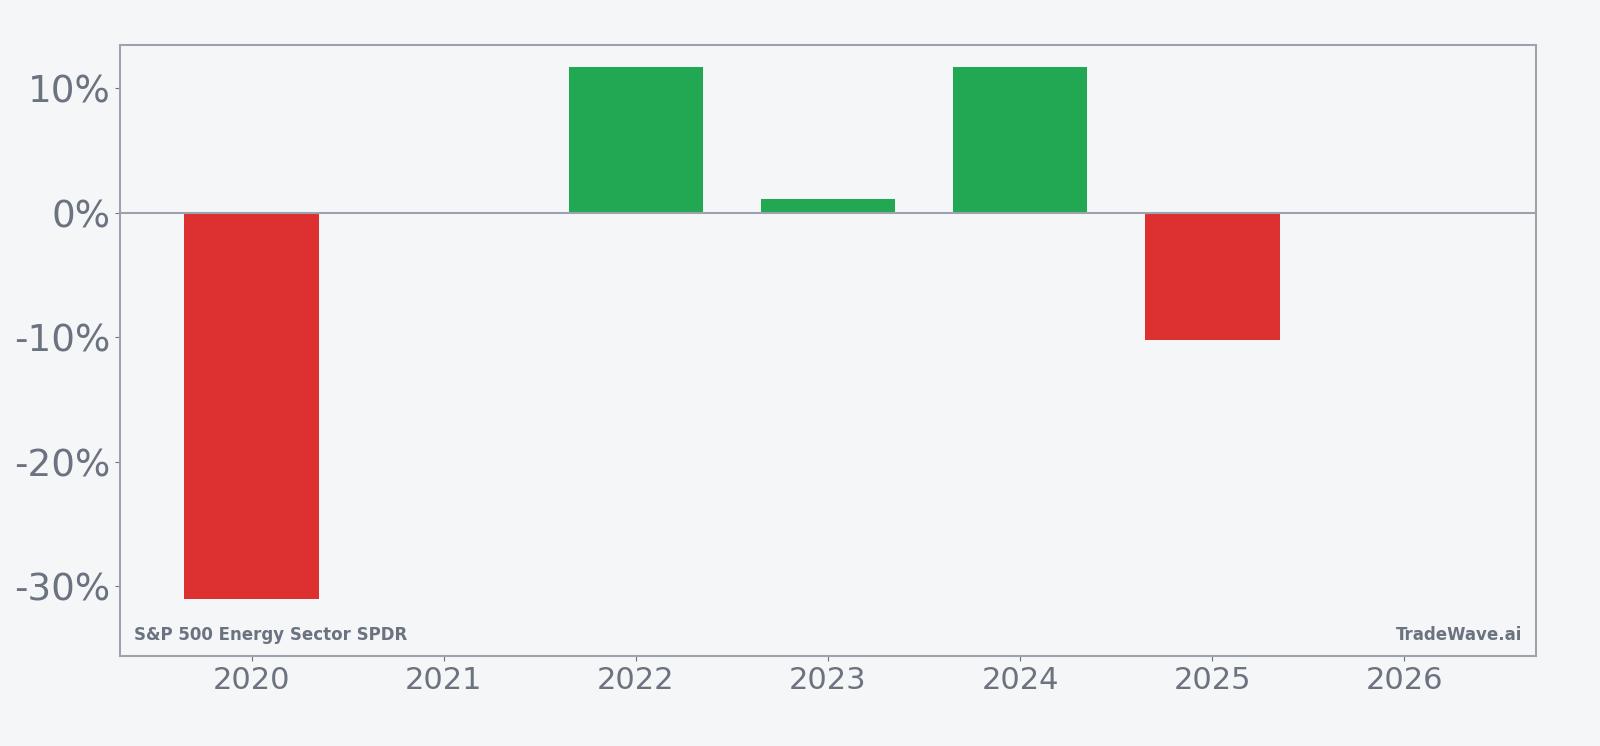
Across the six-year sample, this long-directed pattern has produced more winners than losers, with 67% of years finishing higher over the 55-day span and 4 winning outcomes versus 2 losing ones. The average gain in those winning years has been 6.16%, but once the two weak years are included, the all-years average drops to -3%, underscoring how a handful of poor windows can outweigh several moderate advances.
The distribution of outcomes is wide. In 2022 and 2024, XLE logged double-digit net gains of 11.73% and 11.71% respectively over the window, while 2020 and 2025 saw net losses of -31.0% and -10.26%. That mix of strong rallies and sharp setbacks is consistent with a sector that is highly sensitive to commodity prices, policy headlines and macro risk appetite.
Intraperiod swings have also been significant. In the strongest years, the maximum favorable move from entry has reached between roughly 12% and 17%, while the worst drawdowns within the window have ranged from modest single digits in some years to more than -50% in 2020. Those maximum favorable and maximum adverse excursions show that even when the final result is positive, the path can involve sizable interim downside.
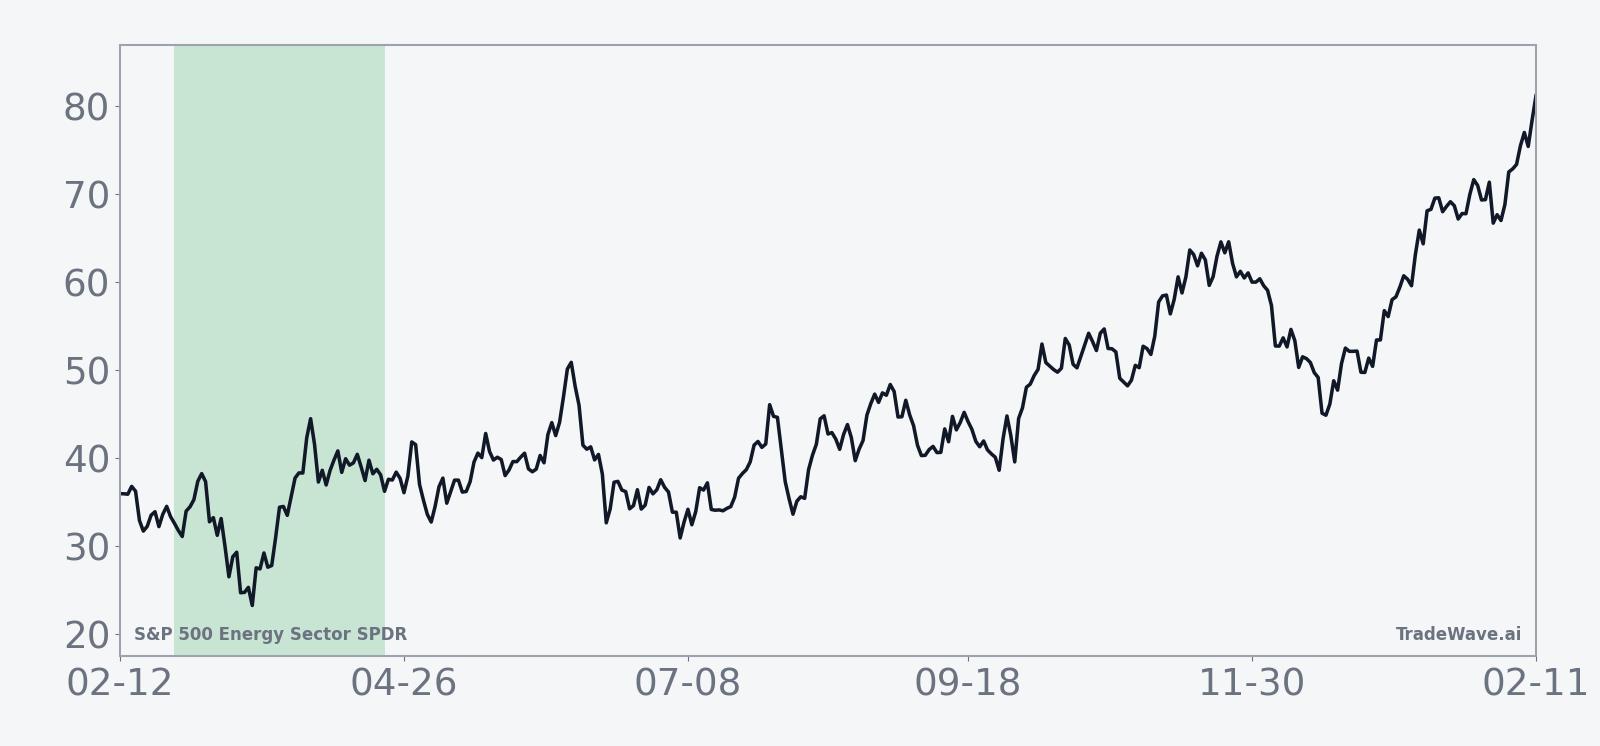
The historical seasonal trend chart suggests that, on average, gains tend to build gradually rather than in a straight line, with periods of consolidation and pullback embedded within the broader upward bias. The cumulative pattern does not show a smooth climb, which is consistent with the sector’s tendency to react quickly to shifting oil prices and macro headlines.
A closer look at yearly net results alongside peak rallies and worst drawdowns highlights how upside potential and downside risk have coexisted in this window.
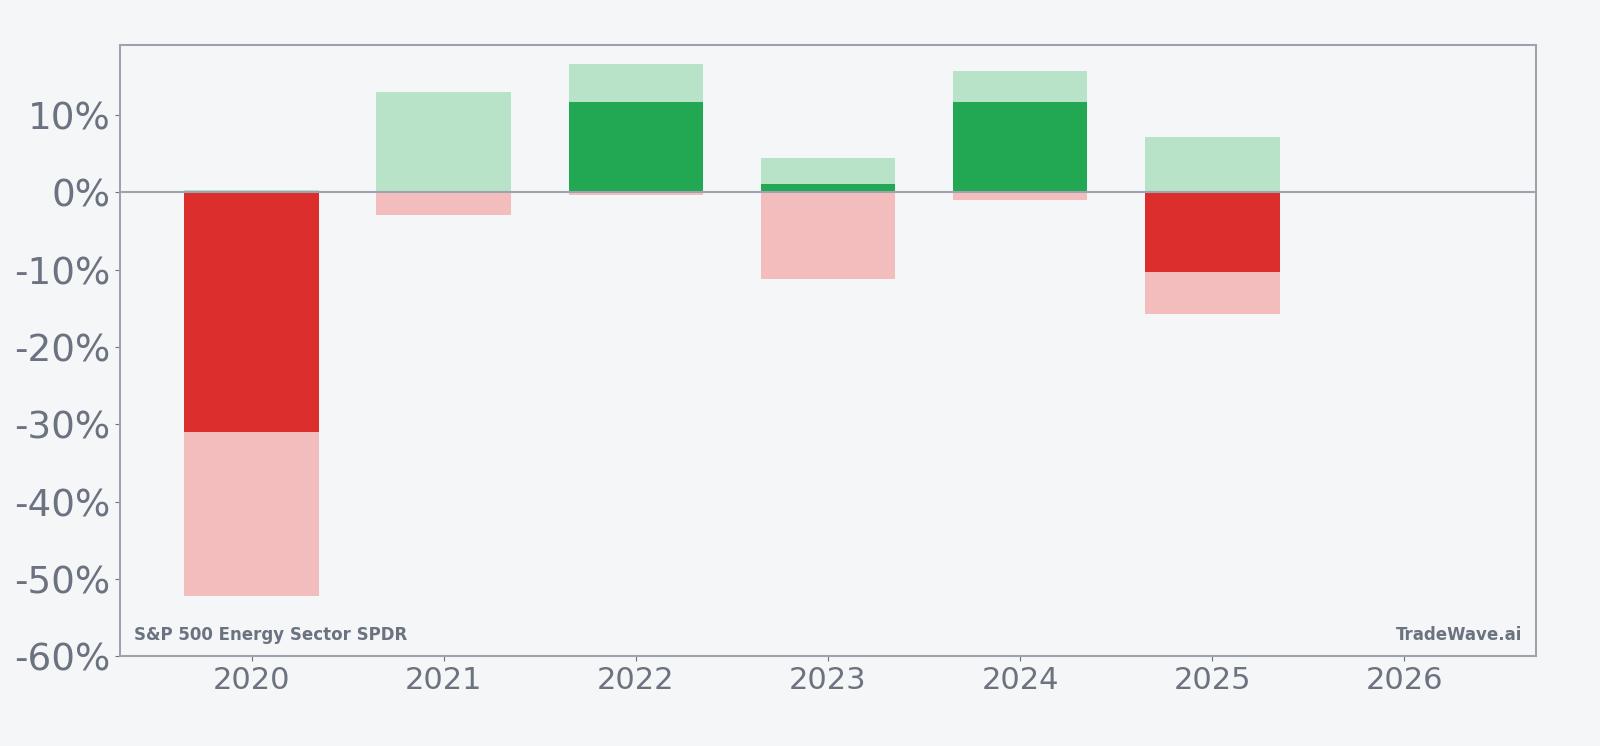
Viewed through the combined net, peak favorable and worst adverse moves, the pattern looks like a high-variance long setup: several years delivered solid net gains with controlled drawdowns, while others saw deep adverse moves even when intraperiod rallies were present. Taken together, the historical pattern defines the quantitative seasonal backdrop for the current period.
History does not guarantee future results, and adverse excursions can be large even in winning windows.
Price and near-term drivers
Real-time pricing and flow data for S&P 500 Energy Sector SPDR were not available as of this analysis, but the ETF remains a primary vehicle for investors seeking broad exposure to the S&P 500 energy sector. That makes the current seasonal window particularly relevant as traders weigh how much of last year’s strength in energy equities is already reflected in valuations and how sensitive the group may be to shifts in macro expectations.
In Q3 2025, the energy sector gained 6.2%, outperforming Real Estate, Materials and Consumer Staples, a reminder that the group has been capable of leading the broader market when conditions align.[14] That outperformance came against a backdrop of geopolitical risks and expectations for easier monetary policy, both of which have tended to support interest in real assets such as energy stocks.[14] At the same time, some strategists have argued that energy remains undervalued, with options strategies on XLE highlighted as a way to position for a potential catch-up move in a lagging sector during 2025.[9]
Technical analysts have also framed XLE as sitting near an important decision point. In Nov 2025, one widely followed technician described the S&P 500 energy sector as trading into the apex of converging trendlines, with the potential for an upside breakout if buyers could sustain momentum.[8] That kind of setup can amplify the importance of a seasonal window: if the ETF is already coiled in a tight range, historical tendencies toward volatility or trend can matter more than usual.
Fundamentally, the sector’s earnings and cash flow profile has been supported by disciplined capital spending and shareholder-return policies at major constituents, even as broader equity markets have been dominated by debates over artificial-intelligence spending and big-tech valuations.[4] For diversified investors, XLE has often served as a counterbalance to growth-heavy exposures, particularly when inflation or geopolitical tensions push commodity prices higher.
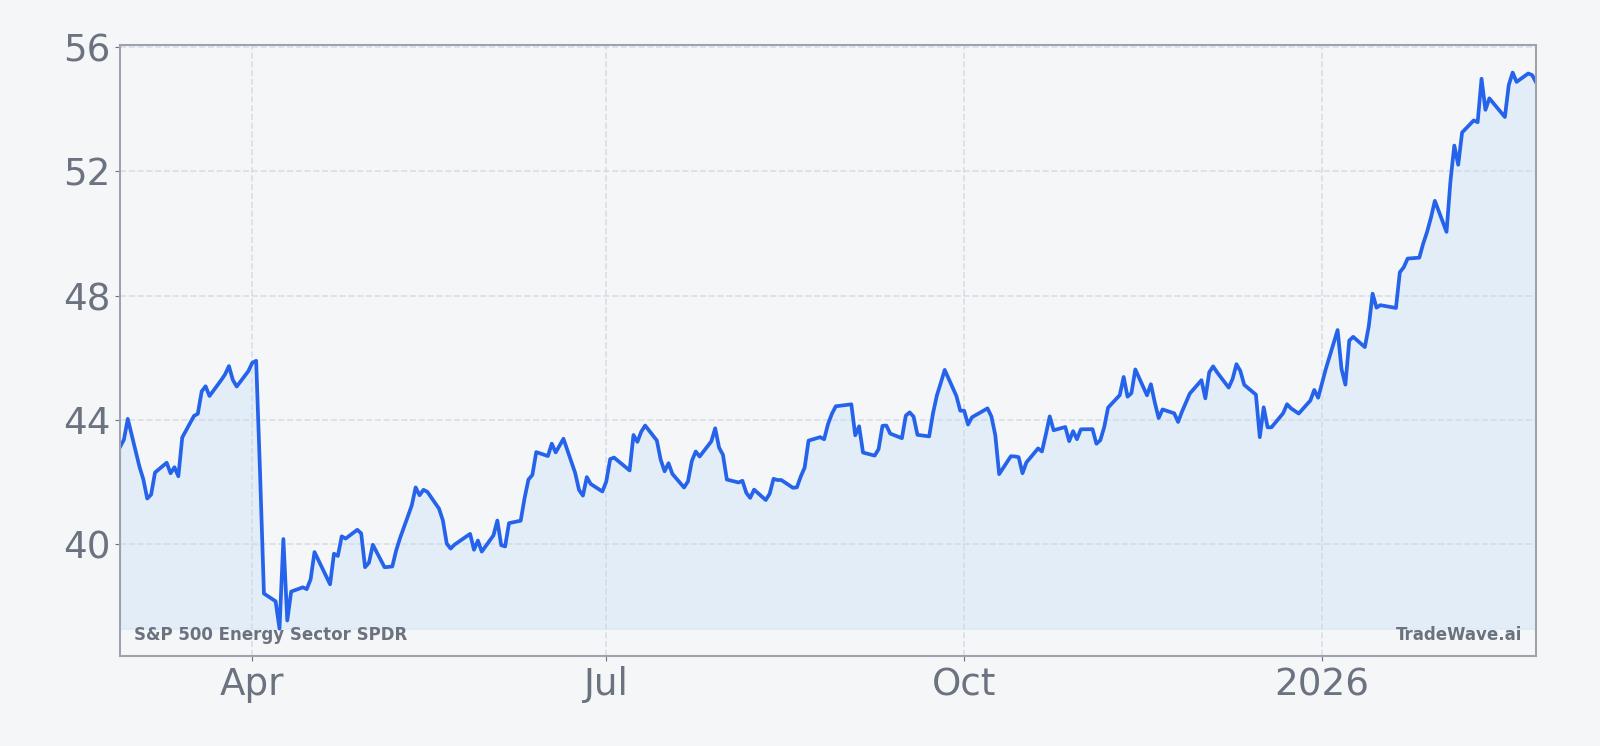
The chart below situates the latest trading in XLE within its recent 12-month range.
Macro backdrop and sector exposure
S&P 500 Energy Sector SPDR tracks the energy constituents of the S&P 500, giving investors a liquid, exchange-traded way to access large integrated oil companies, exploration and production firms, refiners and related services names. As a result, the ETF’s performance is closely tied to crude oil and natural gas prices, but also to broader macro variables such as global growth expectations, inflation trends and currency moves.
Geopolitical risks have remained a key driver for the sector, with periodic supply disruptions and regional tensions influencing both spot prices and forward curves.[14] At the same time, expectations for central-bank rate cuts have supported the case for real assets, including energy, as investors look for hedges against potential reflation or renewed commodity strength.[2] These forces can interact with the seasonal pattern by either reinforcing historical tendencies toward volatility or, in quieter periods, muting them.
Relative to other sectors, energy’s earnings and cash flows can be more cyclical, which helps explain why the seasonal window around late February and early spring has produced such a wide range of outcomes. In years when global demand is firm and supply is constrained, the window has coincided with strong rallies in XLE. In years marked by oversupply concerns or growth scares, the same calendar stretch has lined up with sharp drawdowns.
For portfolio builders, XLE’s role as a sector proxy also means that its seasonal behavior can influence broader index performance at the margin, particularly when energy’s weight in the S&P 500 rises. While the sector is smaller than technology or health care, outsized moves in energy can still affect factor exposures such as value, dividend yield and inflation sensitivity.
What to watch in this window
With XLE trading inside a 55-day window that has historically combined a modest long bias with substantial volatility, investors will be watching several signposts. First, the ETF’s behavior around recent support and resistance levels on the 12-month chart will help indicate whether this year is tracking closer to the strong years like 2022 and 2024 or the weaker episodes seen in 2020 and 2025. Sustained breaks above prior range highs would be more consistent with the winning years in the sample, while failures near resistance or swift reversals from new highs would echo the losing patterns.
Second, macro catalysts will matter. Upcoming data on global growth, inflation and central-bank policy expectations could shift the narrative around real assets and energy equities, either reinforcing the case for continued sector leadership or reviving concerns about demand and pricing power. Any renewed flare-up in geopolitical risk that affects supply routes or production could also tilt the balance of risk within this seasonal window.
Third, traders will be monitoring how XLE trades relative to other cyclical and defensive sectors. If energy continues to outperform areas like Real Estate, Materials and Consumer Staples, as it did in Q3 2025,[14] that would suggest investors are still willing to pay for commodity-linked earnings and cash flows. Underperformance, by contrast, could signal that the sector’s perceived undervaluation is narrowing or that macro concerns are starting to dominate.
Finally, the intraperiod path will be as important as the end result. Historical maximum favorable and adverse excursions show that even winning years have featured meaningful drawdowns, while losing years have sometimes included sharp but fleeting rallies. For investors using XLE to express energy views during this stretch, the key will be whether price action respects historical tendencies toward choppy but constructive behavior or instead begins to resemble the more severe downside episodes that have pulled the all-years average into negative territory.
Sources
- Seeking Alpha: Cantor Fitzgerald doesn’t believe in Wall Street’s recent reprieve rally (Mar 21, 2025)
- Seeking Alpha: Fed rate cuts likely to support U.S. equities, but with muted gains: BMO’s Belski (Sep 14, 2025)
- Seeking Alpha: Exxon Mobil Q3: Guyana, Permian, And Capital Strength Confirm A Bullish Breakout (Nov 5, 2025)
- Forbes: Q4 Earnings Beat, But AI Capex Clouds Big Tech Outlook (Feb 8, 2026)
- MarketBeat: HudBay Minerals Inc Stock Holdings Raised by Franklin Resources Inc. (Dec 1, 2025)
- MarketBeat: Lundin Mining Shares Gap Up - Here's What Happened (Nov 8, 2025)
- MarketBeat: Endeavour Silver Trading Down 5.1% - Here's Why (Jul 12, 2025)
- CNBC: Buy energy stocks for a prospective breakout, says Carter Worth (Nov 14, 2025)
- CNBC: Energy due for a bounce? Trading for a comeback in the sector using options (Oct 3, 2025)
- MarketBeat: Investors Purchase High Volume of Call Options on Endeavour Silver (Jun 7, 2025)
- MarketBeat: Ur-Energy Stock Passes Below 50-Day Moving Average (Dec 11, 2025)
- MarketBeat: NexMetals Mining Corp. Short Interest Up 106.5% in October (Nov 1, 2025)
- MarketBeat: La Mancha Investments S.à R.L. Sells Shares of Endeavour Mining (Oct 11, 2025)
- Forbes: The Top-Performing Energy Stocks Of Q3 2025 (Oct 2, 2025)